From 2018 to 2019, the U.S. population grew by .48%, its slowest rate in 100 years. Declining births, increasing deaths largely due to the graying Baby Boomer population, and a crackdown on immigration have contributed to many states seeing net population losses in recent years.
But in other pockets of the country, populations are growing. These shifts can be due to job opportunities, high quality of life, easy commutability to job centers, low rents, or any combination of these or other factors. Stacker compiled a list of the fastest-growing counties in New Mexico using data from the U.S. Census Bureau. Counties are ranked by the highest population growth from 2010 to 2019, based on 5-year estimates.
A county typically sees population growth as a “bedroom community” (a municipality with an atypically large commuting population) to a large city. These communities are typically quieter than their feeder cities, offer lower rents and a higher quality of living, and are remote enough to be immune to the feeder city’s crime, traffic, and crowds. Keep reading to see if your home county made the list.
Story continues below
- News: VIDEO: Deputies find dead 5-year-old during Silver City callout
- Events: What’s happening around New Mexico May 24-30
- Trending: City of Santa Fe unveils resolution to give homes to two controversial statues
- Community: Albuquerque hosting its first-ever cricket tournament at Balloon Fiesta Park

AllenS // Wikimedia Commons
#30. Luna County
– 2010 to 2019 population change: -1,169
— #2,746 among all counties nationwide
– 2010 to 2019 percent population change: -4.6%
— #20 among counties in New Mexico, #2,536 among all counties nationwide
– 2019 population: 24,083
— #18 largest county in New Mexico, #1,638 largest county nationwide

Canva
#29. Socorro County
– 2010 to 2019 population change: -1,106
— #2,728 among all counties nationwide
– 2010 to 2019 percent population change: -6.2%
— #25 among counties in New Mexico, #2,780 among all counties nationwide
– 2019 population: 16,858
— #22 largest county in New Mexico, #1,985 largest county nationwide

Gestalt Imagery // Shutterstock
#28. Lincoln County
– 2010 to 2019 population change: -1,041
— #2,708 among all counties nationwide
– 2010 to 2019 percent population change: -5.1%
— #21 among counties in New Mexico, #2,632 among all counties nationwide
– 2019 population: 19,461
— #19 largest county in New Mexico, #1,854 largest county nationwide

Carptrash // Wikimedia Commons
#27. Rio Arriba County
– 2010 to 2019 population change: -1,036
— #2,703 among all counties nationwide
– 2010 to 2019 percent population change: -2.6%
— #18 among counties in New Mexico, #2,143 among all counties nationwide
– 2019 population: 39,159
— #13 largest county in New Mexico, #1,197 largest county nationwide

Canva
#26. San Juan County
– 2010 to 2019 population change: -1,002
— #2,693 among all counties nationwide
– 2010 to 2019 percent population change: -0.8%
— #15 among counties in New Mexico, #1,734 among all counties nationwide
– 2019 population: 126,515
— #5 largest county in New Mexico, #497 largest county nationwide

AllenS // Wikimedia Commons
#25. Torrance County
– 2010 to 2019 population change: -948
— #2,657 among all counties nationwide
– 2010 to 2019 percent population change: -5.8%
— #23 among counties in New Mexico, #2,735 among all counties nationwide
– 2019 population: 15,519
— #23 largest county in New Mexico, #2,068 largest county nationwide

psyberartist // Wikimedia Commons
#24. Sierra County
– 2010 to 2019 population change: -907
— #2,626 among all counties nationwide
– 2010 to 2019 percent population change: -7.6%
— #29 among counties in New Mexico, #2,922 among all counties nationwide
– 2019 population: 11,031
— #25 largest county in New Mexico, #2,351 largest county nationwide

Tony Hisgett // Wikimedia Commons
#23. Quay County
– 2010 to 2019 population change: -676
— #2,473 among all counties nationwide
– 2010 to 2019 percent population change: -7.5%
— #28 among counties in New Mexico, #2,914 among all counties nationwide
– 2019 population: 8,326
— #26 largest county in New Mexico, #2,561 largest county nationwide

Calvin Beale // Wikimedia Commons
#22. Hidalgo County
– 2010 to 2019 population change: -667
— #2,462 among all counties nationwide
– 2010 to 2019 percent population change: -13.4%
— #32 among counties in New Mexico, #3,103 among all counties nationwide
– 2019 population: 4,297
— #29 largest county in New Mexico, #2,877 largest county nationwide

Vacaypicts // Wikimedia Commons
#21. Harding County
– 2010 to 2019 population change: -502
— #2,317 among all counties nationwide
– 2010 to 2019 percent population change: -53.2%
— #33 among counties in New Mexico, #3,142 among all counties nationwide
– 2019 population: 441
— #33 largest county in New Mexico, #3,137 largest county nationwide

Wordbuilder // Wikimedia Commons
#20. Roosevelt County
– 2010 to 2019 population change: -484
— #2,297 among all counties nationwide
– 2010 to 2019 percent population change: -2.5%
— #17 among counties in New Mexico, #2,123 among all counties nationwide
– 2019 population: 18,888
— #20 largest county in New Mexico, #1,874 largest county nationwide

AllenS // Wikimedia Commons
#19. Mora County
– 2010 to 2019 population change: -387
— #2,184 among all counties nationwide
– 2010 to 2019 percent population change: -7.9%
— #30 among counties in New Mexico, #2,940 among all counties nationwide
– 2019 population: 4,536
— #27 largest county in New Mexico, #2,859 largest county nationwide

U.S. Army Corps of Engineers // Wikimedia Commons
#18. Guadalupe County
– 2010 to 2019 population change: -345
— #2,125 among all counties nationwide
– 2010 to 2019 percent population change: -7.3%
— #27 among counties in New Mexico, #2,898 among all counties nationwide
– 2019 population: 4,353
— #28 largest county in New Mexico, #2,872 largest county nationwide
Canva
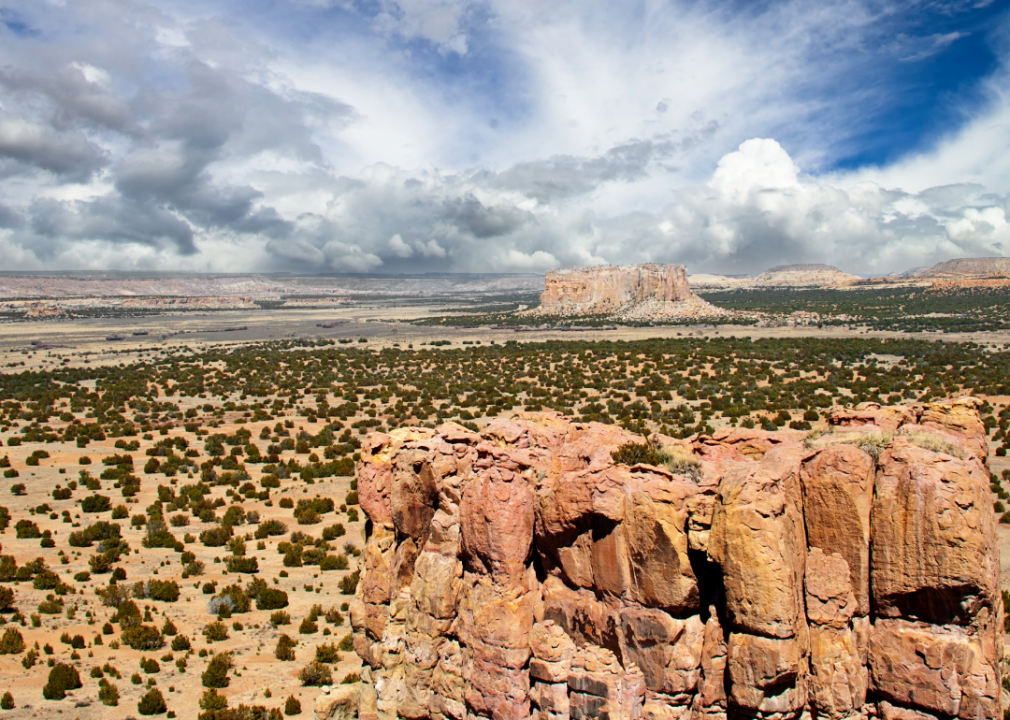
#17. Cibola County
– 2010 to 2019 population change: -288
— #2,046 among all counties nationwide
– 2010 to 2019 percent population change: -1.1%
— #16 among counties in New Mexico, #1,790 among all counties nationwide
– 2019 population: 26,891
— #17 largest county in New Mexico, #1,529 largest county nationwide

Wordbuilder // Wikimedia Commons
#16. Union County
– 2010 to 2019 population change: -255
— #1,985 among all counties nationwide
– 2010 to 2019 percent population change: -5.8%
— #24 among counties in New Mexico, #2,737 among all counties nationwide
– 2019 population: 4,133
— #30 largest county in New Mexico, #2,890 largest county nationwide

Peter Potrowl // Wikimedia Commons
#15. Catron County
– 2010 to 2019 population change: -126
— #1,752 among all counties nationwide
– 2010 to 2019 percent population change: -3.5%
— #19 among counties in New Mexico, #2,328 among all counties nationwide
– 2019 population: 3,526
— #31 largest county in New Mexico, #2,936 largest county nationwide

Lochaven // Wikimedia Commons
#14. Taos County
– 2010 to 2019 population change: +212
— #1,329 among all counties nationwide
– 2010 to 2019 percent population change: +0.7%
— #14 among counties in New Mexico, #1,434 among all counties nationwide
– 2019 population: 32,786
— #14 largest county in New Mexico, #1,362 largest county nationwide

Wordbuilder // Wikimedia Commons
#13. De Baca County
– 2010 to 2019 population change: +268
— #1,279 among all counties nationwide
– 2010 to 2019 percent population change: +15.1%
— #1 among counties in New Mexico, #191 among all counties nationwide
– 2019 population: 2,040
— #32 largest county in New Mexico, #3,044 largest county nationwide
Joseph Sohm // Shutterstock
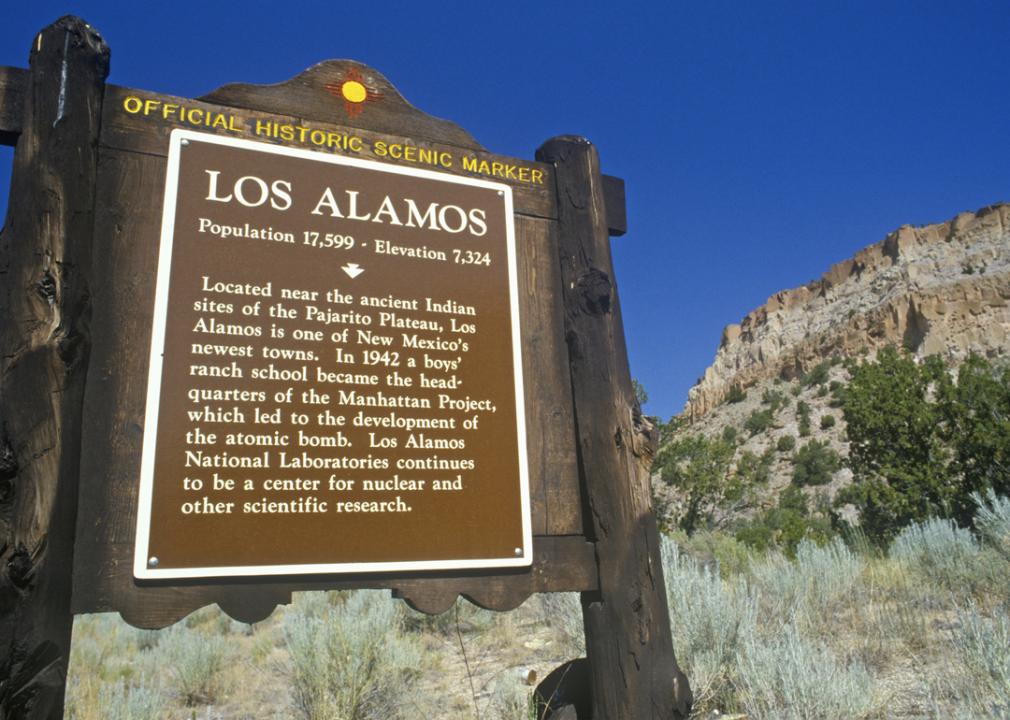
#12. Los Alamos County
– 2010 to 2019 population change: +534
— #1,138 among all counties nationwide
– 2010 to 2019 percent population change: +3.0%
— #10 among counties in New Mexico, #1,060 among all counties nationwide
– 2019 population: 18,625
— #21 largest county in New Mexico, #1,891 largest county nationwide
Cheri Alguire // Shutterstock
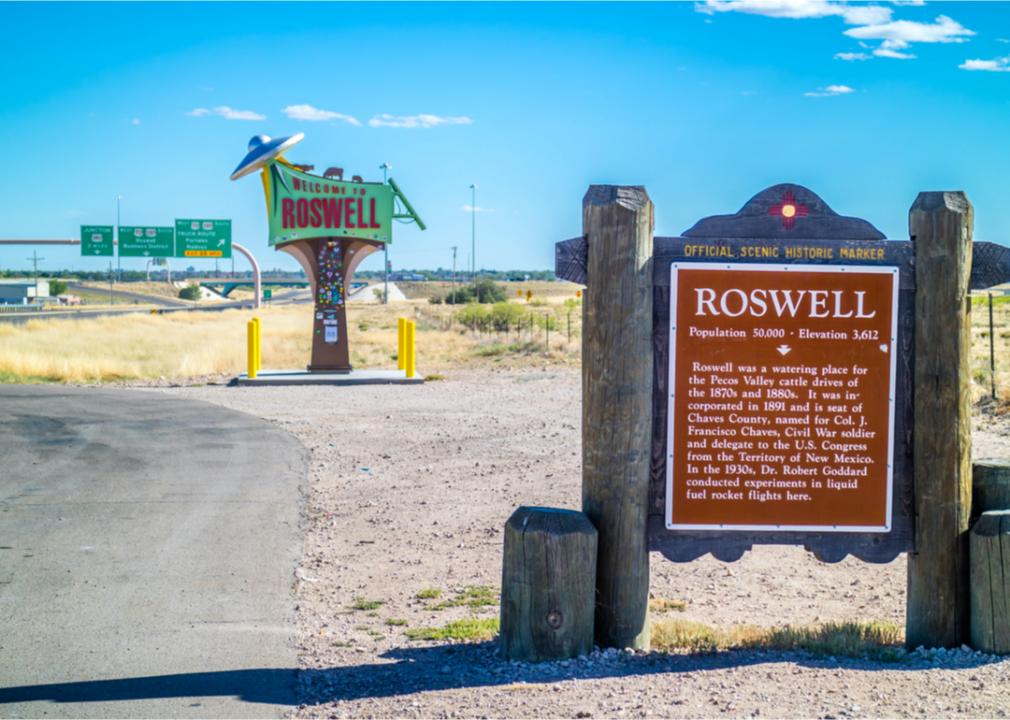
#11. Chaves County
– 2010 to 2019 population change: +876
— #1,015 among all counties nationwide
– 2010 to 2019 percent population change: +1.4%
— #13 among counties in New Mexico, #1,308 among all counties nationwide
– 2019 population: 65,144
— #10 largest county in New Mexico, #819 largest county nationwide

Drmccreedy // Wikimedia Commons
#10. Valencia County
– 2010 to 2019 population change: +1,473
— #865 among all counties nationwide
– 2010 to 2019 percent population change: +2.0%
— #12 among counties in New Mexico, #1,211 among all counties nationwide
– 2019 population: 76,027
— #6 largest county in New Mexico, #729 largest county nationwide

StockPhotoAstur // Shutterstock
#9. McKinley County
– 2010 to 2019 population change: +1,775
— #805 among all counties nationwide
– 2010 to 2019 percent population change: +2.5%
— #11 among counties in New Mexico, #1,126 among all counties nationwide
– 2019 population: 72,438
— #7 largest county in New Mexico, #748 largest county nationwide

Billy Hathorn // Wikimedia Commons
#8. Curry County
– 2010 to 2019 population change: +2,808
— #681 among all counties nationwide
– 2010 to 2019 percent population change: +6.0%
— #6 among counties in New Mexico, #701 among all counties nationwide
– 2019 population: 49,732
— #12 largest county in New Mexico, #988 largest county nationwide

Kristi Blokhin // Shutterstock
#7. Otero County
– 2010 to 2019 population change: +3,355
— #635 among all counties nationwide
– 2010 to 2019 percent population change: +5.3%
— #8 among counties in New Mexico, #763 among all counties nationwide
– 2019 population: 66,137
— #9 largest county in New Mexico, #808 largest county nationwide

Canva
#6. Eddy County
– 2010 to 2019 population change: +5,067
— #541 among all counties nationwide
– 2010 to 2019 percent population change: +9.6%
— #4 among counties in New Mexico, #425 among all counties nationwide
– 2019 population: 57,732
— #11 largest county in New Mexico, #893 largest county nationwide

Asaavedra32 // Wikimedia
#5. Santa Fe County
– 2010 to 2019 population change: +7,591
— #454 among all counties nationwide
– 2010 to 2019 percent population change: +5.4%
— #7 among counties in New Mexico, #758 among all counties nationwide
– 2019 population: 149,293
— #3 largest county in New Mexico, #442 largest county nationwide

AllenS // Wikimedia Commons
#4. Lea County
– 2010 to 2019 population change: +7,774
— #444 among all counties nationwide
– 2010 to 2019 percent population change: +12.4%
— #3 among counties in New Mexico, #276 among all counties nationwide
– 2019 population: 70,277
— #8 largest county in New Mexico, #766 largest county nationwide
David Langford // Shutterstock
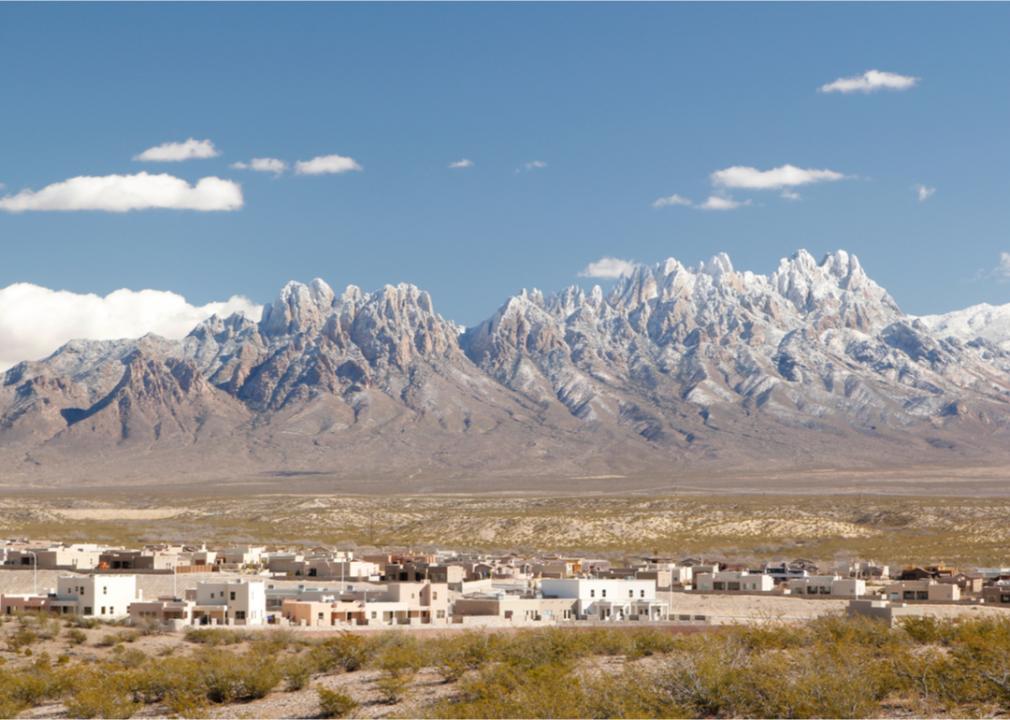
#3. Dona Ana County
– 2010 to 2019 population change: +14,399
— #323 among all counties nationwide
– 2010 to 2019 percent population change: +7.1%
— #5 among counties in New Mexico, #600 among all counties nationwide
– 2019 population: 216,069
— #2 largest county in New Mexico, #308 largest county nationwide
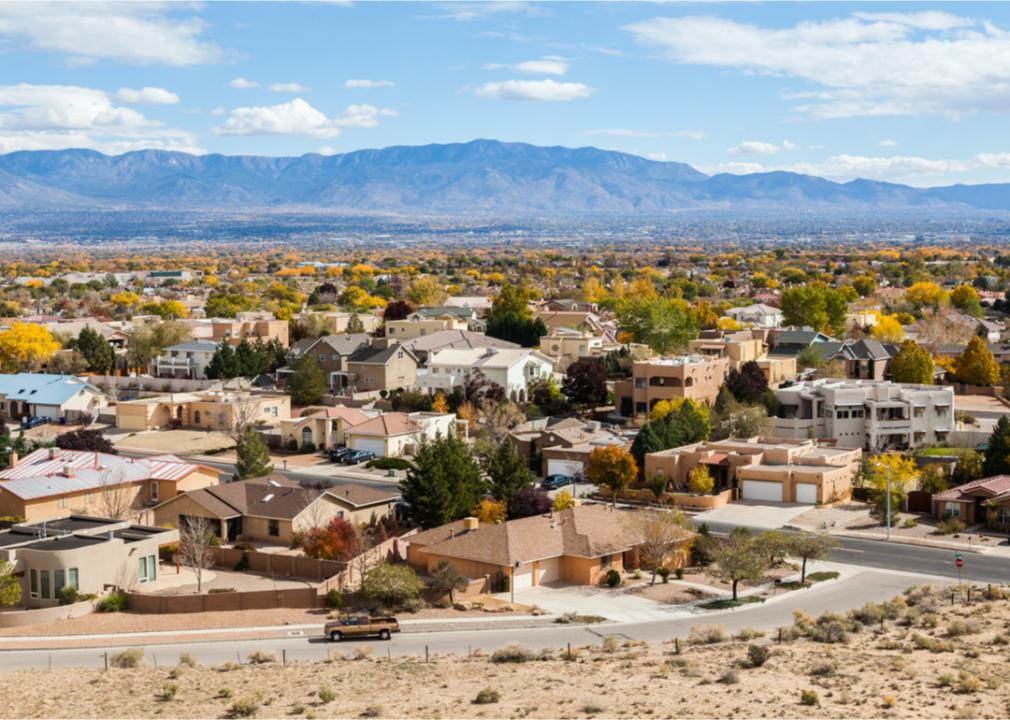
turtix // Shutterstock
#2. Sandoval County
– 2010 to 2019 population change: +18,441
— #283 among all counties nationwide
– 2010 to 2019 percent population change: +14.8%
— #2 among counties in New Mexico, #202 among all counties nationwide
– 2019 population: 142,704
— #4 largest county in New Mexico, #453 largest county nationwide

M.Bucka // Wikimedia Commons
#1. Bernalillo County
– 2010 to 2019 population change: +30,977
— #175 among all counties nationwide
– 2010 to 2019 percent population change: +4.8%
— #9 among counties in New Mexico, #822 among all counties nationwide
– 2019 population: 677,858
— #1 largest county in New Mexico, #99 largest county nationwide


