Your solution’s ready to go!
Our expert help has broken down your problem into an easy-to-learn solution you can count on.
See AnswerSee Answer done loadingQuestion: 14. Gas Prices In the student sample program files for this chapter, you will find a text file named GasPrices.txt. The file contains the weekly average prices for a gallon of gas in the United States, beginning on April 5th, 1993, and ending on August 26th, 2013. Figure 8-7 shows an example of the first few lines of the file's contents: Figure 8-7 The
 There are 3 steps to solve this one.Step 1View the full answer
INTRODUCTION:
Flowchart: A flowchart represents the sequence of steps in a process using graphical sy...
Step 2 UnlockStep 3UnlockAnswerUnlock
Transcribed image text:
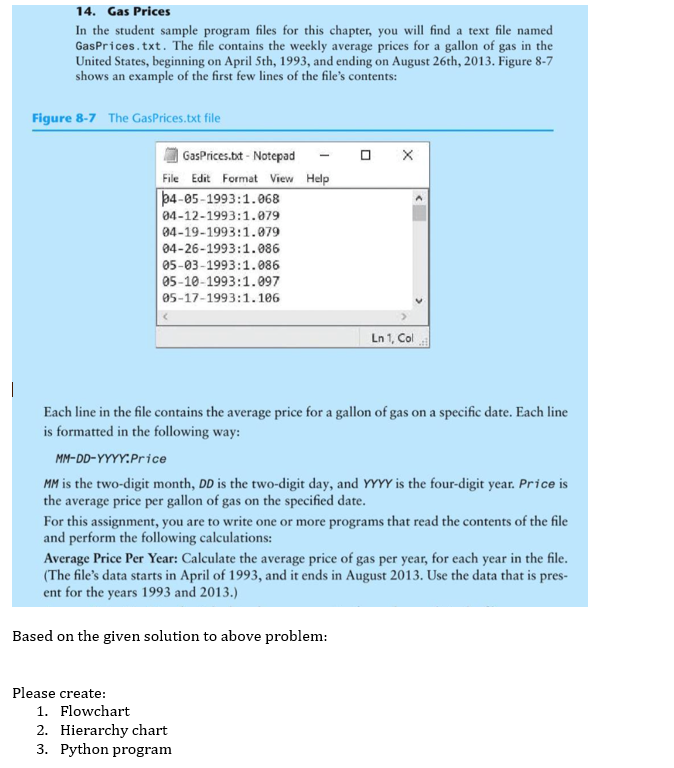
14. Gas Prices In the student sample program files for this chapter, you will find a text file named GasPrices.txt. The file contains the weekly average prices for a gallon of gas in the United States, beginning on April 5th, 1993, and ending on August 26th, 2013. Figure 8-7 shows an example of the first few lines of the file's contents: Figure 8-7 The GasPrices.txt file O X - Help 3 GasPrices.bst - Notepad File Edit Format View b4-05-1993:1.068 04-12-1993:1.079 04-19-1993:1.079 04-26-1993:1.086 05-03-1993:1.086 05-10-1993:1.097 05-17-1993:1.106 Ln 1, Col. Each line in the file contains the average price for a gallon of gas on a specific date. Each line is formatted in the following way: MM-DD-YYYY.Price MM is the two-digit month, DD is the two-digit day, and YYYY is the four-digit year. Price is the average price per gallon of gas on the specified date. For this assignment, you are to write one or more programs that read the contents of the file and perform the following calculations: Average Price Per Year: Calculate the average price of gas per year, for each year in the file. (The file's data starts in April of 1993, and it ends in August 2013. Use the data that is pres- ent for the years 1993 and 2013.) Based on the given solution to above problem: Please create: 1. Flowchart 2. Hierarchy chart 3. Python program
Not the question you’re looking for?
Post any question and get expert help quickly.