
WHAT IS A WEATHER FORECAST?
A weather forecast is simply a scientific estimate of future weather condition. Weather condition is the state of the atmosphere at a given time expressed in terms of the most significant weather variables. The significant weather variables being forecast differ from place to place. In the Philippines, the weather parameters with significant variation and therefore of interest to the users of the forecast are cloudiness, rainfall and wind.
In forecasting the weather, a Meteorologist must at least know something about the existing weather condition over a large area before he can make a reliable forecast. The accuracy of his forecast depends largely upon his knowledge of the prevailing weather conditions over a very wide area. The forecast decision is based on various forecasting tools. The basic tool of a weather forecaster is the WEATHER MAP.
The weather map depicts the distribution patterns of atmospheric pressure, wind, temperature and humidity at the different levels of the atmosphere. There are two types of the basic weather map namely, the surface map and the upper-air maps. There are five standard levels of the upper-air maps that are constructed twice daily at twelve-hourly interval. The surface maps are made four times daily at six-hourly intervals. On the surface maps, the distribution patterns of rain or other forms of precipitation and cloudiness can also be delineated.
1st Step: Observation
Observation of different weather elements are made simultaneously as follows:

Surface observations are made at least every three hours over land and sea.
Land-based weather stations around the world and automatic stations observe the atmospheric pressure, wind direction and speed, temperature of the air, humidity, clouds, precipitation and visibility using standard weather instruments such as the barometer, wind vane, anemometer, thermometer, psychrometer or hygrometer and raingauge. In addition to these, coastal weather stations, weather ships and ocean data buoy observe the state of the sea by observing the height and period of wave.

Upper air stations around the world also make observations at least every twelve hours.
The pressure, temperature, dew point temperature, wind direction and speed are observed at selected levels in the atmosphere using radiosondes which record these data by tracking helium-filled balloons attached to transmitters. Another apparatus, the theodolite, is used in observing wind direction and speed also at selected levels. In addition to these, commercial air planes observe the weather along their routes at specified times.
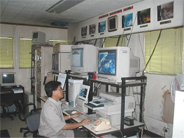
Meteorological satellites, geostationary and polar orbiting, take pictures of the cloud imagery of the atmosphere. These satellites take picture of the earth's cloud formations every hour and continuously, respectively.
Weather radars are also used to observe the cloud coverage within the range of the radar.
A vast array of weather data are fed to the computer which analyzes them as programmed and makes a time integration of physical equations. This is called numerical weather prediction.
2nd Step: Collection and Transmission of Weather Data
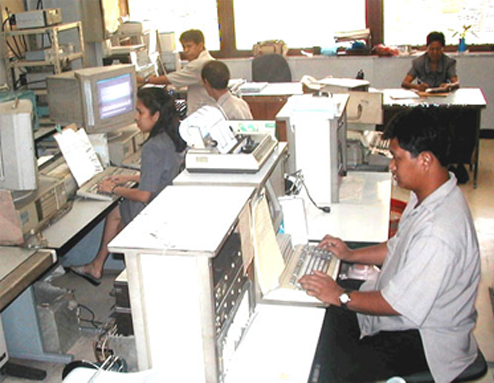
Weather observations which are condensed into coded figures, symbols and numerals are transmitted via radiophone, teletype, facsimile machine or telephone to designated collection centers for further transmission to the central forecasting station at WFFC. Weather satellite pictures are transmitted to ground receiving stations while radar observations are transmitted to forecasting centers through a local communication system.
3rd Step: Plotting of Weather Data
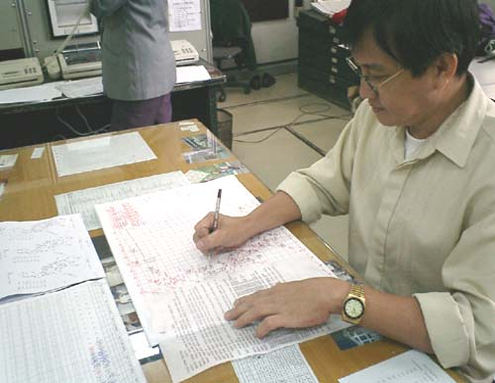
Upon receipt of the coded messages, they are decoded and each set of observations is plotted in symbols or numbers on weather charts over the respective areas or regions. Observations made over land and sea are plotted on the surface or mean sea level charts which are prepared four times a day. Radiosonde, theodolite, aircraft and satellite wind observations are plotted on upper level charts which are prepared twice daily.
4th Step: Analysis Of Weather Maps, Satellite And Radar Imageries And Other Data
Current weather maps are analyzed as follows:
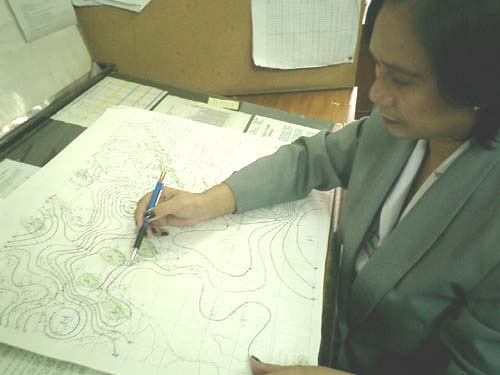
SURFACE (MSL) CHART: The data plotted on this weather map are analyzed isobarically. This means the same atmospheric pressure at different places are inter-connected with a line taking into consideration the direction of the wind. Through this analysis, weather systems or the so-called centers of action such as high and low pressure areas, tropical cyclones, cold and warm fronts, intertropical convergence zone, can be located and delineated.
UPPER AIR CHARTS: The data plotted on this weather map are analyzed using streamline analysis. Lines are drawn to illustrate the flow of the wind. With this kind of analysis, anticyclones or high pressure areas and cyclones or low pressure areas can be delineated.
NUMERICAL WEATHER PREDICTION MODEL OUTPUT: The computer-plotted weather maps are analyzed manually so that weather systems like cyclones and anticyclones, troughs, etc. are located.
MONITOR WEATHER CHARTS: Plotted data on the cross-section, rainfall and 24-hour pressure change charts are analyzed to determine the movement of wind waves, rainfall distribution and the behavior of the atmospheric pressure.
Compare the current weather maps with the previous 24 - 72 hour weather maps level by level to determine the development and movement of weather systems that may affect the forecast area.
Examine the latest weather satellite picture, noting the cloud formations in relation to the weather systems on the current weather maps.
Compare the latest weather satellite picture with the previous satellite pictures (up to 48 hours) noting the development and movement of weather systems that may affect the country.
Examine the latest computer output of the numerical weather prediction model noting the 24-hour, 48-hour and 72-hour objective forecast of the weather systems that may affect the forecast area.
Analyze the latest radar reports and other minor forecasting tools.
5th Step: Formulation of the Forecast
After the analysis of all available meteorological information/data has been completed, the preparation of forecasts follows. The first and one of the preliminary steps is the determination as accurately as the data permit, of the location 24 hours hence of the different weather systems and the existing weather over a particular region. In many cases a fairly satisfactory estimate of the direction and rate of movement may be made by simply measuring the movement during the last 12 or 24 hours and then extrapolating, or extending, this movement into the future and hence what weather will be experienced in different areas in the immediate future.

The forecasts are then aired in various radio stations by telephone or sent by telefax machines a few minutes after completion and are immediately sent to the weather stations nationwide. Copies are also furnished to different media outlets without delay.