Best examples of timelines, Gantt charts, and roadmaps for the Energy industry
Get a high-level overview of your energy projects and impress stakeholders with beautiful Gantt charts, timelines, and roadmaps made with Office Timeline.

Global supply chain disruptions, labor shortages, and constant pressure to meet increased demand while reducing carbon emissions — the energy industry is navigating a turbulent period right now.
At the same time, the growing interest in sustainable technology is growing around the world and so is the investment in the renewable energy sector. Though strenuous and slow, this switchover to a green alternative to fossil fuels has resulted in a series of long-term projects set to drive innovation and improve the infrastructure for cleaner energy sources.
If you’re a project manager or portfolio manager overseeing projects in the energy industry, you have your work cut out. We’re here to make things easier for you so that you can keep track of project tasks and communicate progress to executives and investors in the best way possible.
Have a look at the 3 examples of project visuals below to learn more about the amazing benefits of Gantt charts, timelines, and roadmaps. You can download the PowerPoint slides we’ve created for free and use the Office Timeline free trial to adjust them to your liking.
1. Solar farm construction Gantt chart
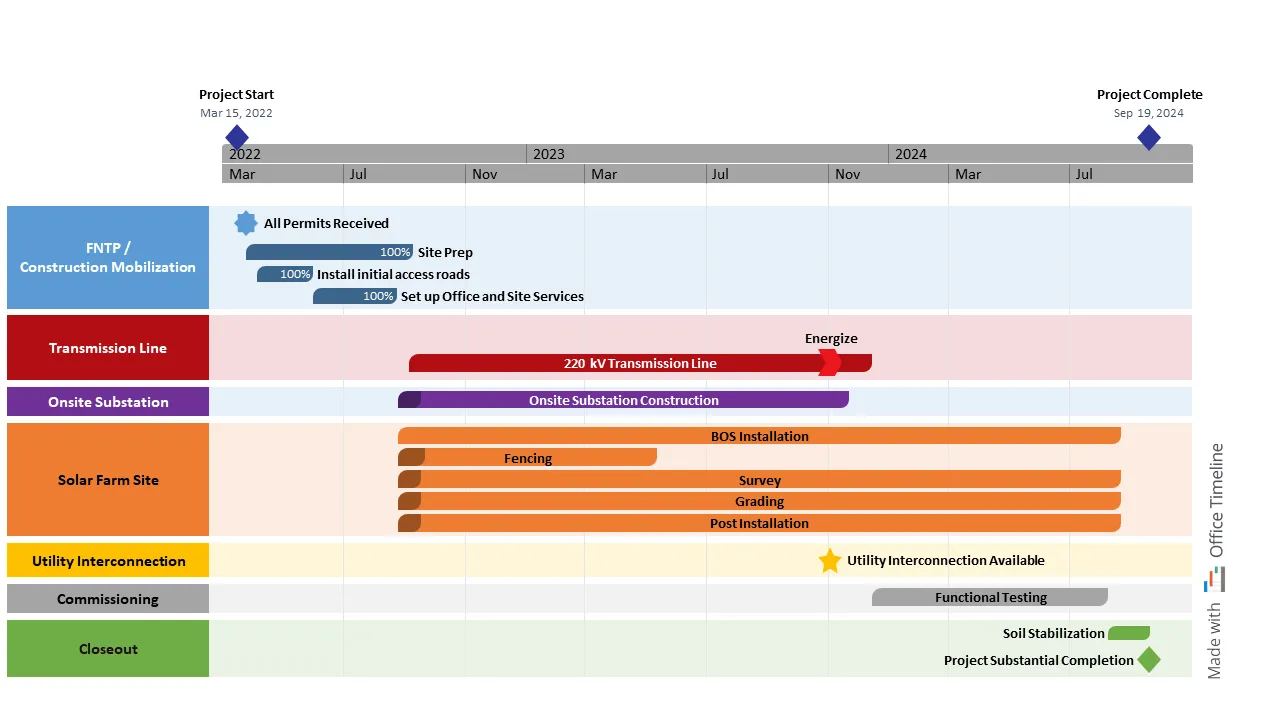
As a site manager for one of Australia’s leading solar farm construction companies, Victor’s job is to oversee all energy contracting projects. His top responsibilities include managing the daily activities of site engineers and subcontractors and ensuring project plans are implemented safely and efficiently.
Victor is also the one who monitors progress and keeps clients updated throughout the duration of the project. So when a new solar installation launched in March, he knew he had to create a Gantt chart that would give everyone involved a clear overview of tasks and their status.
The schedule for the solar array construction needed to summarize multiple aspects like building the transmission line, setting up the substation, and preparing the solar farm site without looking cluttered. Plus, it had to have an attractive, professional design that would be consistent with the company’s brand image.
Normally, getting the visual to be presentable would have taken Victor a good couple of hours of impatiently fiddling with PowerPoint’s native features. However, thanks to having discovered the Office Timeline add-in and using it already to meet a tight deadline, the schedule was ready in a matter of minutes. Not to mention, the design looked clean and elegant.
After he grouped tasks based on the parent category and put them into swimlanes, Victor used the styling options to show each phase of the solar farm project in a different color. Then he added two milestones on the timeband to display the project’s start and end dates and one on a task when the transmission line gets energy.
Using the percent complete, Victor made the progress of each critical task in the project visible at a glance. This alone reduced the time spent in review meetings significantly and helped him spot internal roadblocks and delays in time.
2. Well inspection timeline
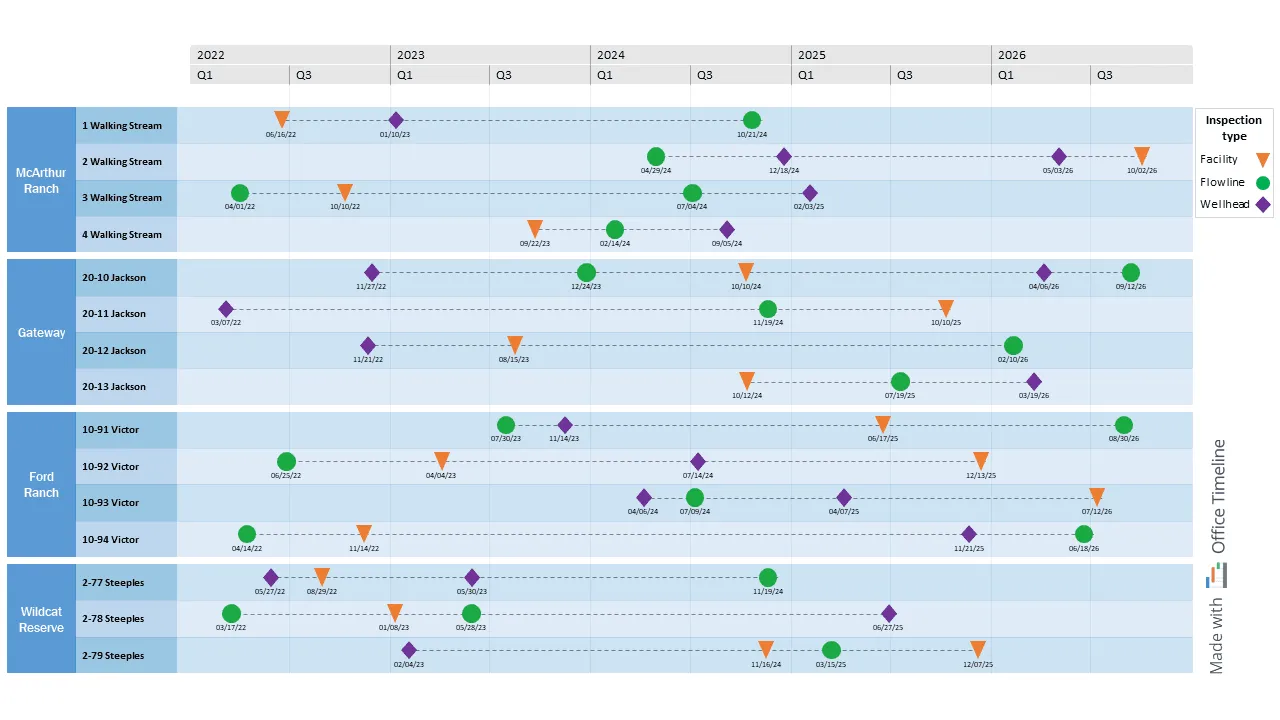
Dora’s job as a field inspector in the engineering and operations team of a top-performing US contractor is anything but dull. She gets to travel all around the country while also inspecting oil and gas wells for safety compliance with Commission rules.
Her fast-paced schedule demands her to have a simple yet effective timeline of major inspection deadlines for oil and gas wells located in different fields. She used to keep that data in an Excel spreadsheet until she tested the Office Timeline tool for the first time.
It was love at first timeline. The seamless data import from Excel and visual customization options made the tool a must-have for her yearly inspections. These events are shown as colorful milestones in separate rows for each well and are connected to each other through a dotted line done in PowerPoint.
Dora also grouped the wells into swimlanes based on the oil field location to be able to quickly identify them when checking her schedule. Then she assigned different colors and shapes based on the type of inspection activity — wellhead, flowline, or facility — and added a legend on the slide to make the timeline easy to read.
With the help of the Office Timeline Style Pane, Dora included the inspection dates under each milestone to make sure there were no mistakes. Altogether, the timeline made it easier for her to perform timely inspections and prevent severe injuries and illness among rig workers.
And the best part is that, unlike her previous experience with Excel sheets, she doesn’t have to deal anymore with the stress of thinking she might have got the dates and places accidentally mixed up. Now everything is clear as day (and pleasing to the eye too).
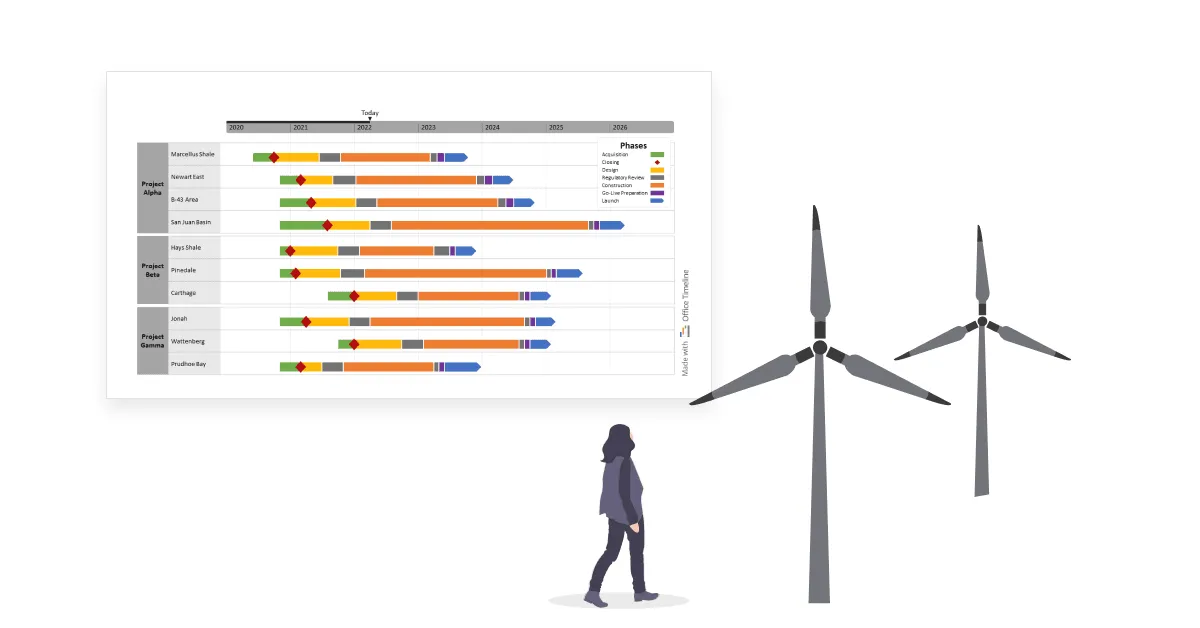
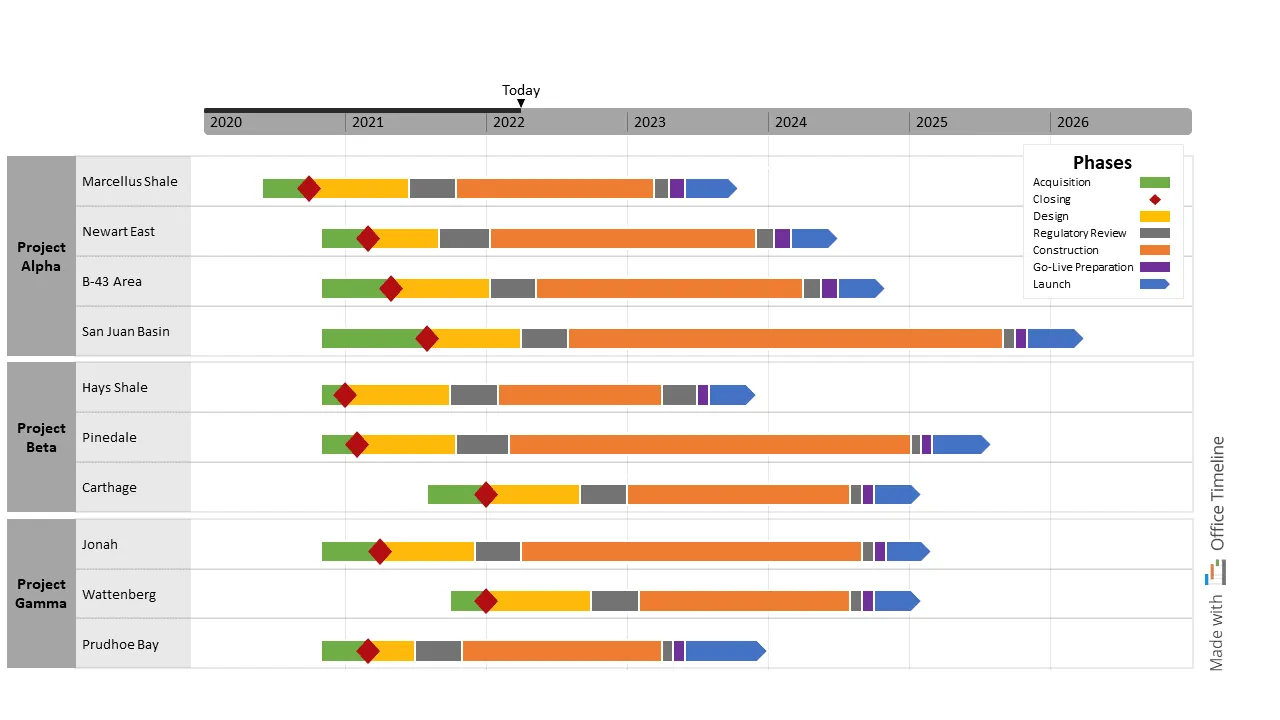
3. Midstream project portfolio
Julian is a portfolio manager for a major oil company and he’s been tasked with tracking high-level milestones across multiple midstream projects. After several failed attempts to display his portfolio of midstream energy projects as a series of timelines split into standard project phases using Microsoft Project, he did a last-minute search on Google.
Julian hoped there was a more user-friendly tool out there that would help him build and customize the visual. That’s when he came across an Office Timeline tutorial and decided to test its features and see what it could do.
First of all, Julian was delighted when he discovered he could quickly import the MS Project data for his multiple project plans into Office Timeline using the import wizard. With that out of the way, he moved on to grouping sites into major projects by adding swimlanes.
He then used the Timeline View to align the midstream project phases into a single row to illustrate the progress made at each site. Julian assigned a distinct color for each stage of the project; green for acquisition, red for closing, blue for launch, yellow for design, and so on, until each phase stood out among the others displayed on the visual.
Since Julian is a big fan of clarity, he took great care when adding the last finishing touches. He placed a legend on the top left of the portfolio to help people identify similar activities and added a ‘Today’ marker to bring everything into perspective.
Julian’s experiment with Office Timeline was a real success — who would have thought that showing multiple timelines on a single slide would be so simple?
Get a high-level overview of your project plans and activities without compromising on design
The energy sector is facing the challenge of bouncing back from the losses the pandemic incurred on its value chains while also transitioning to a more sustainable future. For that effort to bring positive results, managers require enhanced visibility and focus when it comes to planning, implementing, and tracking projects.
That’s where Office Timeline comes in to help you reach project goals on time and on budget. Browse our rich library of timeline templates, roadmap templates, and Gantt chart templates and choose your favorite visuals to personalize according to your project needs. Download the Office Timeline free trial and start building project visuals that guide you on your path to success.
Project management tips and tricks
Tagged With:
Examples by industryTurn project data into professional timelines
Get the advanced features of Office Timeline free for 14 days.
