

- >>Weather by month // weather averages Niagara Falls
- >>Climate graph // Weather by Month Niagara Falls
- >>average temperature by month Niagara Falls
- >>Weather Niagara Falls
Niagara Falls is in the northern hemisphere. -> It is situated in the upper half of the planet. Summer begins in September and ends at the end of June. The months of summer are: June, July, August, September.
Climate graph // Weather by Month Niagara Falls
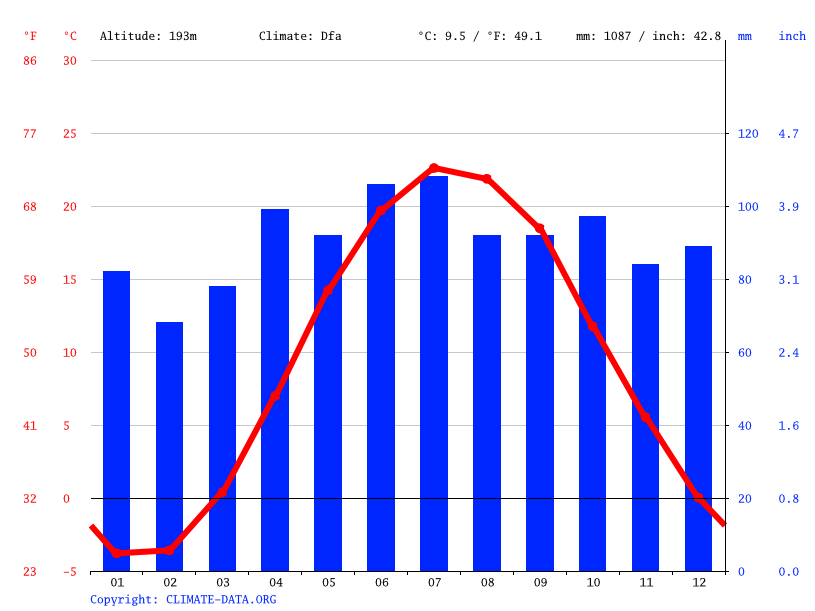
The least amount of rainfall occurs in February. The average in this month is 68 mm | 2.7 inch. The majority of rainfall occurs during the month with the highest precipitation, which is July, and has an average amount of 108 mm | 4.3 inch.
average temperature by month Niagara Falls
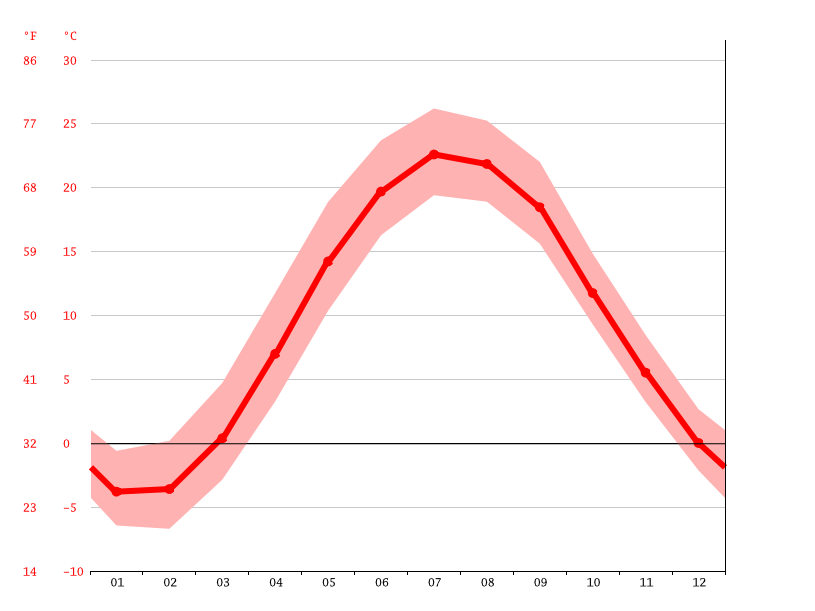
The temperatures are highest on average in July, at around 22.6 °C | 72.7 °F. During the month of January, the mean temperature registers at a minimum value of -3.8 °C | 25.2 °F. This represents the coldest monthly average throughout the entire year.
Weather by month // weather averages Niagara Falls
| Avg. Temperature °C (°F) | Min. Temperature °C (°F) | Max. Temperature °C (°F) | Precipitation / Rainfall mm (in) | Humidity (%) | Rainy days (d) | avg. Sun hours (hours) | |
|---|---|---|---|---|---|---|---|
| January |
-3.8 (25.2) |
-6.4 (20.4) |
-0.6 (30.9) |
82 (3.2) |
74% | 10 | 3.0 |
| February |
-3.6 (25.5) |
-6.7 (19.9) |
0.2 (32.3) |
68 (2.7) |
71% | 8 | 5.0 |
| March |
0.4 (32.7) |
-2.9 (26.9) |
4.7 (40.5) |
78 (3.1) |
70% | 9 | 6.0 |
| April |
7 (44.6) |
3.3 (37.9) |
11.8 (53.2) |
99 (3.9) |
67% | 9 | 8.0 |
| May |
14.2 (57.6) |
10.4 (50.7) |
18.9 (66) |
92 (3.6) |
68% | 9 | 10.0 |
| June |
19.7 (67.5) |
16.3 (61.3) |
23.7 (74.7) |
106 (4.2) |
70% | 9 | 11.0 |
| July |
22.6 (72.7) |
19.4 (66.9) |
26.2 (79.2) |
108 (4.3) |
69% | 10 | 11.0 |
| August |
21.9 (71.3) |
18.9 (66) |
25.3 (77.5) |
92 (3.6) |
71% | 9 | 10.0 |
| September |
18.5 (65.2) |
15.6 (60.1) |
22 (71.6) |
92 (3.6) |
72% | 8 | 8.0 |
| October |
11.8 (53.2) |
9.3 (48.8) |
14.8 (58.7) |
97 (3.8) |
72% | 9 | 6.0 |
| November |
5.5 (41.9) |
3.2 (37.8) |
8.5 (47.3) |
84 (3.3) |
75% | 9 | 5.0 |
| December |
0 (32) |
-2.1 (28.2) |
2.7 (36.8) |
89 (3.5) |
74% | 10 | 3.0 |
| January | February | March | April | May | June | July | August | September | October | November | December | |
|---|---|---|---|---|---|---|---|---|---|---|---|---|
| Avg. Temperature °C (°F) |
-3.8 °C (25.2) °F |
-3.6 °C (25.5) °F |
0.4 °C (32.7) °F |
7 °C (44.6) °F |
14.2 °C (57.6) °F |
19.7 °C (67.5) °F |
22.6 °C (72.7) °F |
21.9 °C (71.3) °F |
18.5 °C (65.2) °F |
11.8 °C (53.2) °F |
5.5 °C (41.9) °F |
0 °C (32) °F |
| Min. Temperature °C (°F) |
-6.4 °C (20.4) °F |
-6.7 °C (19.9) °F |
-2.9 °C (26.9) °F |
3.3 °C (37.9) °F |
10.4 °C (50.7) °F |
16.3 °C (61.3) °F |
19.4 °C (66.9) °F |
18.9 °C (66) °F |
15.6 °C (60.1) °F |
9.3 °C (48.8) °F |
3.2 °C (37.8) °F |
-2.1 °C (28.2) °F |
| Max. Temperature °C (°F) |
-0.6 °C (30.9) °F |
0.2 °C (32.3) °F |
4.7 °C (40.5) °F |
11.8 °C (53.2) °F |
18.9 °C (66) °F |
23.7 °C (74.7) °F |
26.2 °C (79.2) °F |
25.3 °C (77.5) °F |
22 °C (71.6) °F |
14.8 °C (58.7) °F |
8.5 °C (47.3) °F |
2.7 °C (36.8) °F |
| Precipitation / Rainfall mm (in) |
82 (3) |
68 (2) |
78 (3) |
99 (3) |
92 (3) |
106 (4) |
108 (4) |
92 (3) |
92 (3) |
97 (3) |
84 (3) |
89 (3) |
| Humidity(%) | 74% | 71% | 70% | 67% | 68% | 70% | 69% | 71% | 72% | 72% | 75% | 74% |
| Rainy days (d) | 10 | 9 | 9 | 9 | 9 | 9 | 10 | 9 | 7 | 9 | 9 | 10 |
| avg. Sun hours (hours) | 3.2 | 4.5 | 6.5 | 8.3 | 10.1 | 10.9 | 11.2 | 10.0 | 8.2 | 6.1 | 4.8 | 3.3 |
Data: 1991 - 2021 Min. Temperature °C (°F), Max. Temperature °C (°F), Precipitation / Rainfall mm (in), Humidity, Rainy days. Data: 1999 - 2019: avg. Sun hours
The variation in the precipitation between the driest and wettest months is 40 mm | 2 inch. Throughout the year, there is a fluctuation in average temperatures by 26.4 °C | 47.5 °F.
The month of highest relative humidity is November (74.72 %). The month with the lowest relative humidity is April (66.78 %). The month which sees the most rainfall is December (9.93 days). The driest month of the year is September (13.77 days).
Niagara Falls weather and climate for every month
Hours of sunshine in Niagara Falls
- avg. hours of sun
- Total hours of sun


In Niagara Falls, the month with the most daily hours of sunshine is July with an average of 11.25 hours of sunshine. In total there are 348.69 hours of sunshine throughout July.
The month exhibiting the least number of daily sunshine hours in Niagara Falls is January, presenting an average of only 3.3 hours per day. The total accumulation of sunlight during this period amounts to approximately 102.16.
Around 2652.55 hours of sunshine are counted in Niagara Falls throughout the year. On average there are 87.04 hours of sunshine per month.
Airport close to Niagara Falls
The closest Airports of Niagara Falls are: Billy Bishop Toronto City Airport (YTZ) 63.38km,John C. Munro Hamilton International Airport (YHM) 66.27km,Toronto Pearson International Airport (YYZ) 76.13km
You can reach Niagara Falls from this Cities by Plane: London (LGW), Athens (ATH), Glasgow (GLA), Copenhagen (CPH), Islamabad (ISB), Lahore (LHE), Paris (CDG), Ottawa (YOW), Thunder Bay (YQT), Halifax (YHZ), Beijing (PEK), Ponta Delgada (PDL), Porto (OPO), Havana (HAV), Dallas (DFW), Saskatoon (YXE), Regina (YQR), San Francisco (SFO), Calgary (YYC), Frankfurt am Main (FRA)
