Crime per Capita in Montgomery County
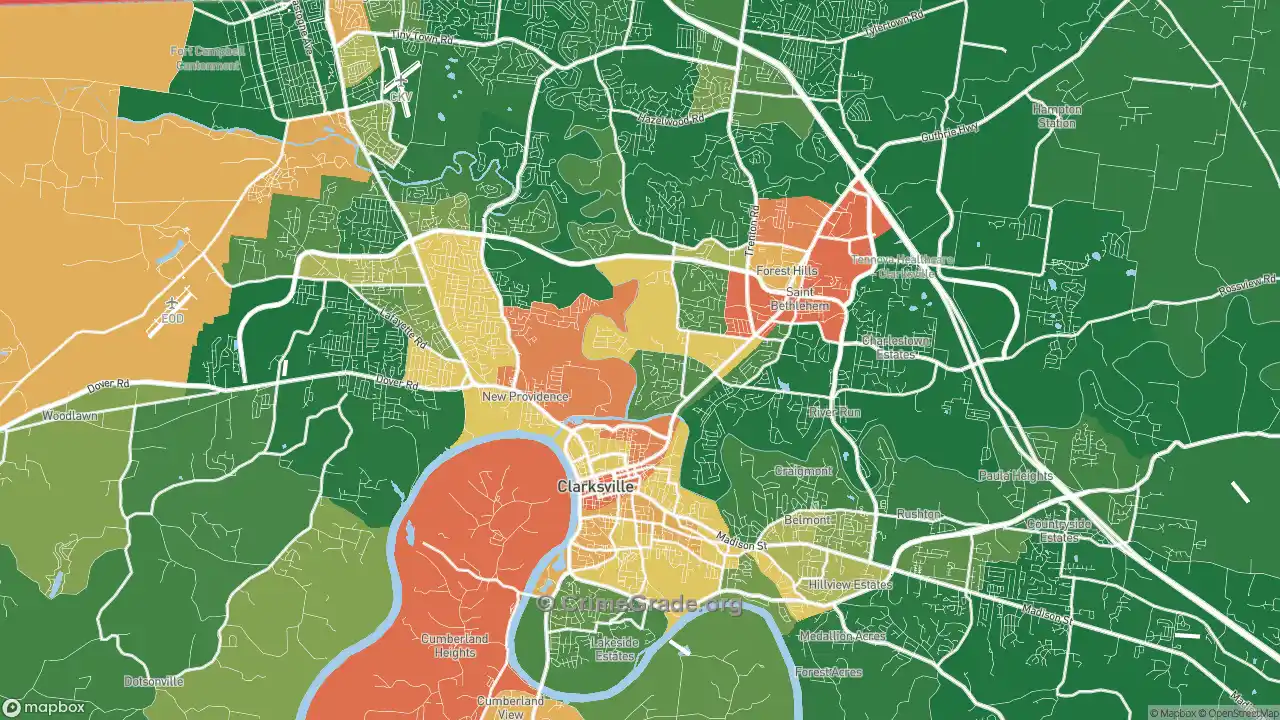
The map below shows crime per 1,000 Montgomery County residents.
The map below shows crime per 1,000 Montgomery County residents.
A
Overall Crime Grade™
B+ |
|
A+ |
|
Other Crime Grade |
C+ |
A crime occurs every 1 hour 11 minutes (on average) in Montgomery County.
Your home is 300% more likely to be robbed with no home security system.
Crime Grade's crime map shows the safest places in Montgomery County in green. The most dangerous areas in Montgomery County are in red, with moderately safe areas in yellow. Crime rates on the map are weighted by the type and severity of the crime.
The A grade means the rate of crime is much lower than the average US county. Montgomery County is in the 91st percentile for safety, meaning 9% of counties are safer and 91% of counties are more dangerous. This analysis applies to Montgomery County's proper boundaries only. See the table on nearby places below for nearby counties.
The rate of crime in Montgomery County is 31.31 per 1,000 residents during a standard year. People who live in Montgomery County generally consider the southeast part of the county to be the safest.
Your chance of being a victim of crime in Montgomery County may be as high as 1 in 17 in the central neighborhoods, or as low as 1 in 50 in the southeast part of the county. See the section on interpreting the crime map, however, because comparing rates for crime or any other crime is not as intuitive as it may seem.
The map below shows a simple count for crime in Montgomery County, meaning it will closely resemble state population maps.
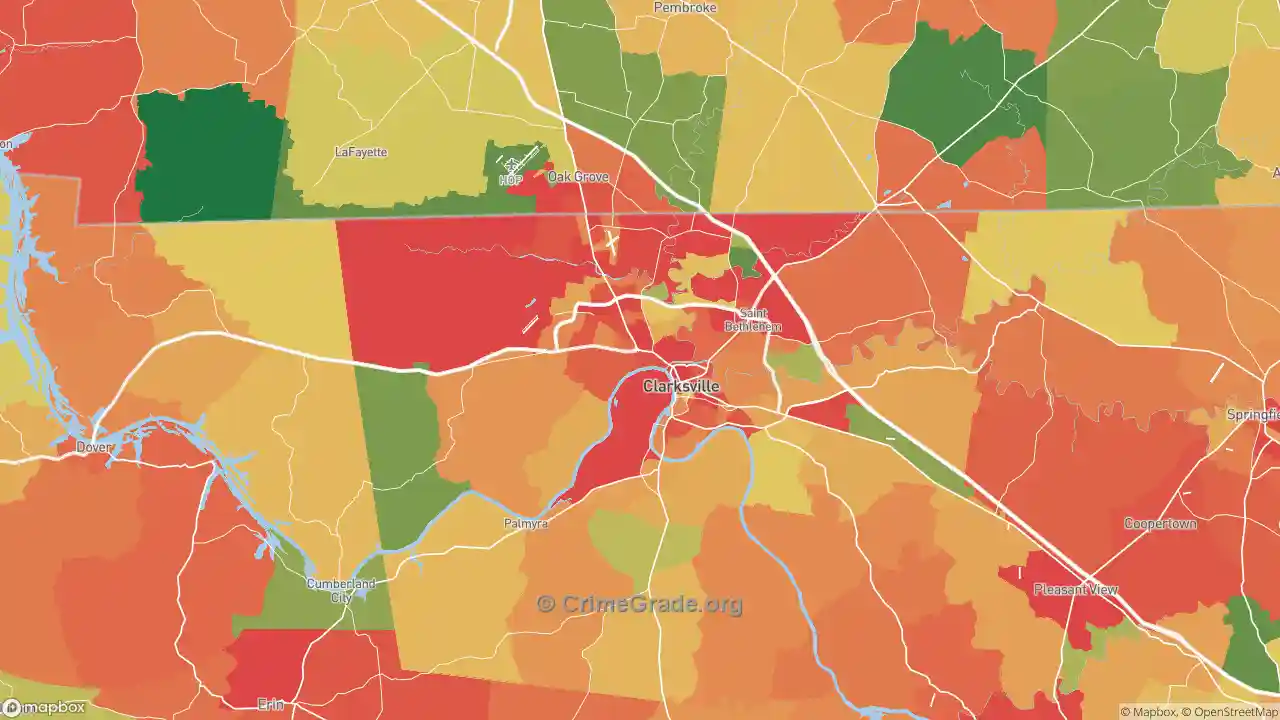
By a simple count ignoring population, more crimes occur in the central parts of Montgomery County, TN: about 1,448 per year. The southwest part of Montgomery County has fewer cases of crime with only 281 in a typical year.
When looking at the crime map for Montgomery County, remember that the rate of crime per resident may appear inflated when people visit the area during the day, but do not live there. For example, there are more retail establishments in the central part of the county. Many crimes are committed in retail areas in blocks where few people live. Red areas on the crime rate map do not always indicate danger for Montgomery County residents who live there.
More issues arise with places like airports, parks, and schools. Major airports, of which Montgomery County has 0, always look like high-crime locations due to the large number of people and the low population nearby. Parks and designated recreational areas, of which Montgomery County has 18, have the same problem. Of Montgomery County’s 220,069 residents, few live near recreational areas. Because many people visit, crime rates may appear higher even for safe parks. Ultimately crime happens where people are, whether they live there or not. Before writing off an area as unsafe, look at both the crime rate and total crime maps, then consider nearby destinations that people may be visiting.
To better understand and navigate these intricate crime maps, a high-speed internet connection can be crucial. Fast and seamless online connectivity ensures that map details load efficiently, providing users with clearer, uninterrupted insights. If you're considering enhancing your online experience, check out high speed internet in Montgomery County, TN at ISP Reports.
The tables below show which crimes are used to calculate the Crime Grades above. All crime rates are shown as the number of crimes per 1,000 Montgomery County residents in a standard year.
Crime Type |
Crime Rate |
|---|---|
Assault |
3.322 |
Robbery |
0.7673 |
Rape |
0.4097 |
Murder |
0.0208 |
Total Violent Crime |
4.520 (B+) |
Crime Type |
Crime Rate |
|---|---|
Theft |
12.87 |
Vehicle Theft |
1.293 |
Burglary |
4.518 |
Arson |
0.1578 |
Total Property Crime |
18.83 (A+) |
Crime Type |
Crime Rate |
|---|---|
Kidnapping |
0.0693 |
Drug Crimes |
1.719 |
Vandalism |
5.507 |
Identity Theft |
0.6272 |
Animal Cruelty |
0.0291 |
Total “Other” Rate |
7.952 (C+) |
Compared to surrounding counties, the rate of crime in Montgomery County is lower. The table below shows Crime Grades for counties close to Montgomery County.
Nearby County | Overall Crime Grade | Violent Crime Grade | Property Crime Grade |
|---|---|---|---|
A | F | A+ | |
A+ | B | A+ | |
C+ | F | B- | |
D | B- | D | |
F | D- | D- | |
F | F | F | |
C | D- | B | |
B+ | D | A | |
F | D- | F | |
D | D | D+ |
Montgomery County is lower versus other counties of the same size for crime. The table below compares crime in counties with comparable overall population in the county‘s boundaries.
Similar County | Overall Crime Grade | Violent Crime Grade | Property Crime Grade |
|---|---|---|---|
B+ | B | B | |
B- | D+ | D+ | |
B- | A+ | A+ | |
A+ | A | A | |
C- | D- | D- | |
B | C- | C- | |
A- | A | A | |
F | F | F | |
C+ | B- | B- | |
B+ | B | B |
Considering only the crime rate, Montgomery County is safer than the Tennessee state average and safer than the national average.
CrimeGrade.org is devoted to the most accurate data available. Errors still occur, but on average CrimeGrade maps are the most accurate and detailed crime maps available. Data is available for licensing, and has been used by insurance companies, home security companies, and more. Read more about our USA crime data and licensing here.
Our proprietary data is available for download by zip code or by state in a CSV Flat File. Please visit our download page for pricing and terms.
Download CSV
A crime occurs on average every 1 hour 11 minutes in Montgomery County. Want to protect your home?
Home Security Companies in Montgomery County, TN
All maps and statistics above are projections, not certainties, and provided without guarantee free of charge. Verify all info before making any decisions based on the data.