Markets
The Biggest Companies in the World in 2021
View the full-resolution version of this infographic.


The Biggest Companies in the World
View the high-resolution version of the infographic by clicking here.
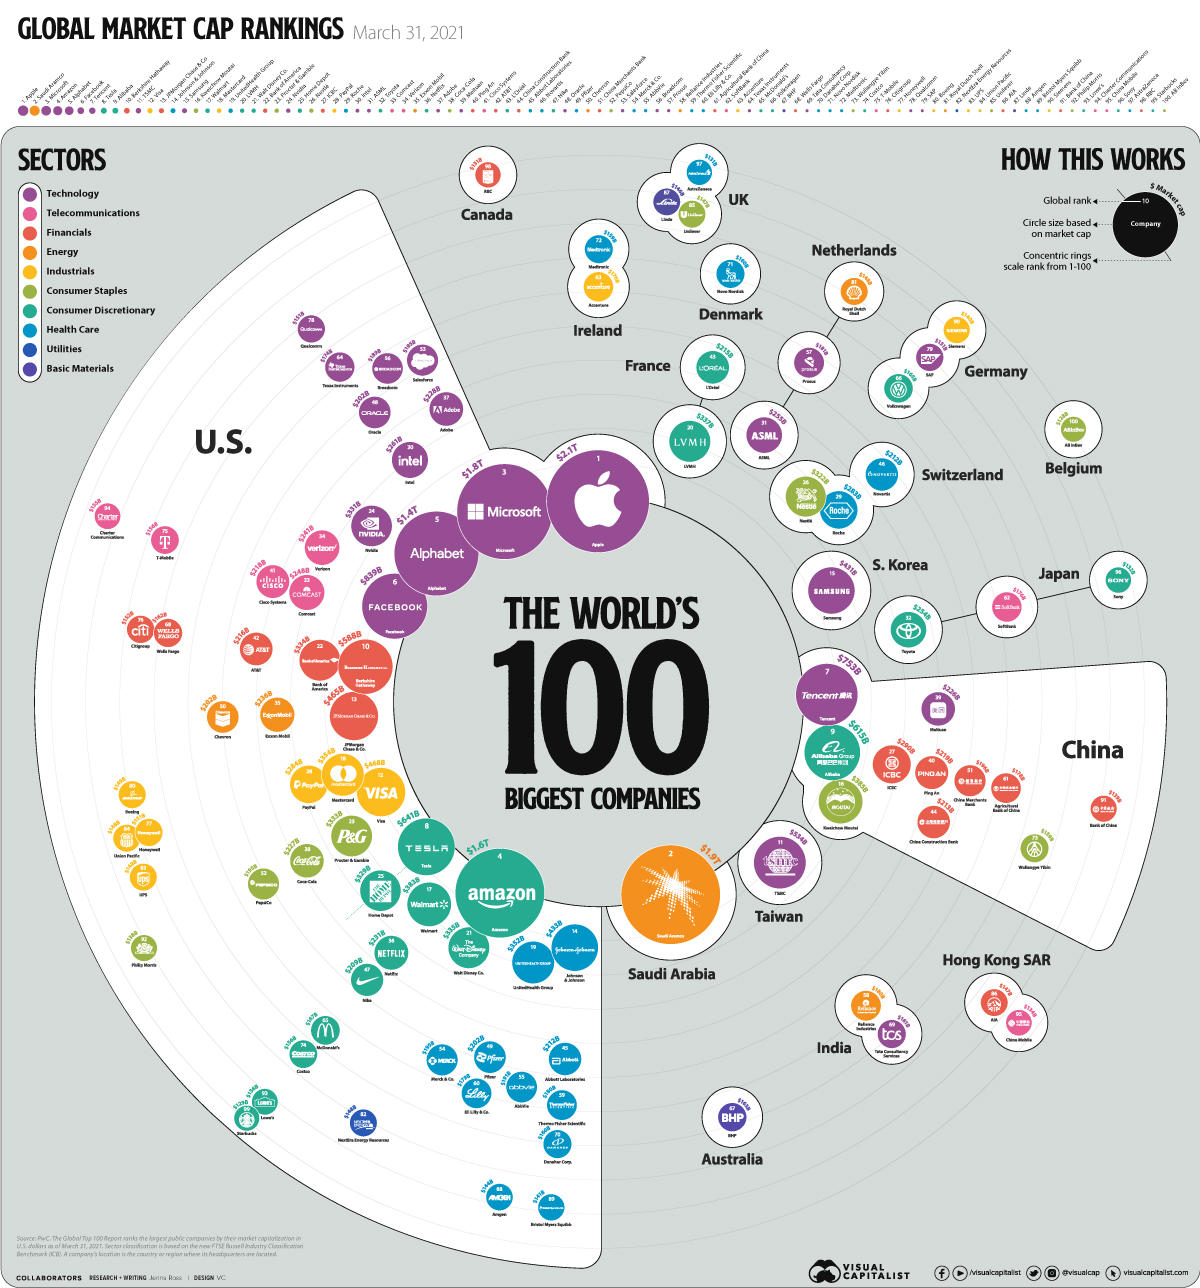
Since the COVID-19 crash, global equity markets have seen a strong recovery. The 100 biggest companies in the world were worth a record-breaking $31.7 trillion as of March 31 2021, up 48% year-over-year. As a point of comparison, the combined GDP of the U.S. and China was $35.7 trillion in 2020.
In today’s graphic, we use PwC data to show the world’s biggest businesses by market capitalization, as well as the countries and sectors they are from.
The Top 100, Ranked
PwC ranked the largest publicly-traded companies by their market capitalization in U.S. dollars. It’s also worth noting that sector classification is based on the FTSE Russell Industry Classification Benchmark, and a company’s location is based on where its headquarters are located.
Here is the top 100 ranking of the biggest companies in the world, organized from the biggest to the smallest.
| Rank | Company name | Location | Sector | Market Capitalization |
|---|---|---|---|---|
| 1 | APPLE INC | 🇺🇸 United States | Technology | $2.1T |
| 2 | SAUDI ARAMCO | 🇸🇦 Saudi Arabia | Energy | $1.9T |
| 3 | MICROSOFT CORP | 🇺🇸 United States | Technology | $1.8T |
| 4 | AMAZON.COM INC | 🇺🇸 United States | Consumer Discretionary | $1.6T |
| 5 | ALPHABET INC | 🇺🇸 United States | Technology | $1.4T |
| 6 | FACEBOOK INC | 🇺🇸 United States | Technology | $839B |
| 7 | TENCENT | 🇨🇳 China | Technology | $753B |
| 8 | TESLA INC | 🇺🇸 United States | Consumer Discretionary | $641B |
| 9 | ALIBABA GRP | 🇨🇳 China | Consumer Discretionary | $615B |
| 10 | BERKSHIRE HATHAWAY | 🇺🇸 United States | Financials | $588B |
| 11 | TSMC | 🇹🇼 Taiwan | Technology | $534B |
| 12 | VISA INC | 🇺🇸 United States | Industrials | $468B |
| 13 | JPMORGAN CHASE | 🇺🇸 United States | Financials | $465B |
| 14 | JOHNSON & JOHNSON | 🇺🇸 United States | Health Care | $433B |
| 15 | SAMSUNG ELECTRONICS | 🇰🇷 South Korea | Technology | $431B |
| 16 | KWEICHOW MOUTA | 🇨🇳 China | Consumer Staples | $385B |
| 17 | WALMART INC | 🇺🇸 United States | Consumer Discretionary | $383B |
| 18 | MASTERCARD INC | 🇺🇸 United States | Industrials | $354B |
| 19 | UNITEDHEALTH GRP | 🇺🇸 United States | Health Care | $352B |
| 20 | LVMH MOET HENNESSY | 🇫🇷 France | Consumer Discretionary | $337B |
| 21 | WALT DISNEY CO | 🇺🇸 United States | Consumer Discretionary | $335B |
| 22 | BANK OF AMERICA | 🇺🇸 United States | Financials | $334B |
| 23 | PROCTER & GAMBLE | 🇺🇸 United States | Consumer Staples | $333B |
| 24 | NVIDIA CORP | 🇺🇸 United States | Technology | $331B |
| 25 | HOME DEPOT INC | 🇺🇸 United States | Consumer Discretionary | $329B |
| 26 | NESTLE SA | 🇨🇭 Switzerland | Consumer Staples | $322B |
| 27 | IND & COMM BK | 🇨🇳 China | Financials | $290B |
| 28 | PAYPAL HOLDINGS | 🇺🇸 United States | Industrials | $284B |
| 29 | ROCHE HOLDING | 🇨🇭 Switzerland | Health Care | $283B |
| 30 | INTEL CORP | 🇺🇸 United States | Technology | $261B |
| 31 | ASML HOLDING NV | 🇳🇱 Netherlands | Technology | $255B |
| 32 | TOYOTA MOTOR | 🇯🇵 Japan | Consumer Discretionary | $254B |
| 33 | COMCAST CORP | 🇺🇸 United States | Telecommunications | $248B |
| 34 | VERIZON COMMUNICATIONS | 🇺🇸 United States | Telecommunications | $241B |
| 35 | EXXON MOBIL CORP | 🇺🇸 United States | Energy | $236B |
| 36 | NETFLIX INC | 🇺🇸 United States | Consumer Discretionary | $231B |
| 37 | ADOBE INC | 🇺🇸 United States | Technology | $228B |
| 38 | COCA-COLA CO | 🇺🇸 United States | Consumer Staples | $227B |
| 39 | MEITUAN | 🇨🇳 China | Technology | $226B |
| 40 | PING AN | 🇨🇳 China | Financials | $219B |
| 41 | CISCO SYSTEMS | 🇺🇸 United States | Telecommunications | $218B |
| 42 | AT&T INC | 🇺🇸 United States | Financials | $216B |
| 43 | L'OREAL | 🇫🇷 France | Consumer Discretionary | $215B |
| 44 | CHINA CONSTRUCTION BANK | 🇨🇳 China | Financials | $213B |
| 45 | ABBOTT LABS | 🇺🇸 United States | Health Care | $212B |
| 46 | NOVARTIS AG | 🇨🇭 Switzerland | Health Care | $212B |
| 47 | NIKE INC | 🇺🇸 United States | Consumer Discretionary | $209B |
| 48 | ORACLE CORP | 🇺🇸 United States | Technology | $202B |
| 49 | PFIZER INC | 🇺🇸 United States | Health Care | $202B |
| 50 | CHEVRON CORP | 🇺🇸 United States | Oil & Gas | $202B |
| 51 | CHINA MERCH | 🇨🇳 China | Financials | $196B |
| 52 | PEPSICO INC | 🇺🇸 United States | Consumer Staples | $195B |
| 53 | SALESFORCE.COM | 🇺🇸 United States | Technology | $195B |
| 54 | MERCK & CO | 🇺🇸 United States | Health Care | $195B |
| 55 | ABBVIE INC | 🇺🇸 United States | Health Care | $191B |
| 56 | BROADCOM INC | 🇺🇸 United States | Technology | $189B |
| 57 | PROSUS NV | 🇳🇱 Netherlands | Technology | $181B |
| 58 | RELIANCE INDS | 🇮🇳 India | Energy | $180B |
| 59 | THERMO FISHER | 🇺🇸 United States | Health Care | $180B |
| 60 | ELI LILLY & CO | 🇺🇸 United States | Health Care | $179B |
| 61 | AGRICULTURAL BANK OF CHINA | 🇨🇳 China | Financials | $178B |
| 62 | SOFTBANK GROUP | 🇯🇵 Japan | Telecommunications | $176B |
| 63 | ACCENTURE PLC | 🇮🇪 Ireland | Industrials | $176B |
| 64 | TEXAS INSTRUMENT | 🇺🇸 United States | Technology | $174B |
| 65 | MCDONALDS CORP | 🇺🇸 United States | Consumer Discretionary | $167B |
| 66 | VOLKSWAGEN AG | 🇩🇪 Germany | Consumer Discretionary | $165B |
| 67 | BHP GROUP LTD | 🇦🇺 Australia | Basic Materials | $163B |
| 68 | WELLS FARGO & CO | 🇺🇸 United States | Financials | $162B |
| 69 | TATA CONSULTANCY | 🇮🇳 India | Technology | $161B |
| 70 | DANAHER CORP | 🇺🇸 United States | Health Care | $160B |
| 71 | NOVO NORDISK | 🇩🇰 Denmark | Health Care | $160B |
| 72 | MEDTRONIC PLC | 🇮🇪 Ireland | Health Care | $159B |
| 73 | WULIANGYE YIBI | 🇨🇳 China | Consumer Staples | $159B |
| 74 | COSTCO WHOLESALE | 🇺🇸 United States | Consumer Discretionary | $156B |
| 75 | T-MOBILE US INC | 🇺🇸 United States | Telecommunications | $156B |
| 76 | CITIGROUP INC | 🇺🇸 United States | Financials | $152B |
| 77 | HONEYWELL INTL | 🇺🇸 United States | Industrials | $151B |
| 78 | QUALCOMM INC | 🇺🇸 United States | Technology | $151B |
| 79 | SAP SE | 🇩🇪 Germany | Technology | $151B |
| 80 | BOEING CO | 🇺🇸 United States | Industrials | $149B |
| 81 | ROYAL DUTCH SHELL | 🇳🇱 Netherlands | Oil & Gas | $148B |
| 82 | NEXTERA ENERGY | 🇺🇸 United States | Utilities | $148B |
| 83 | UNITED PARCEL | 🇺🇸 United States | Industrials | $148B |
| 84 | UNION PAC CORP | 🇺🇸 United States | Industrials | $148B |
| 85 | UNILEVER PLC | 🇬🇧 United Kingdom | Consumer Staples | $147B |
| 86 | AIA | 🇭🇰 Hong Kong SAR | Financials | $147B |
| 87 | LINDE PLC | 🇬🇧 United Kingdom | Basic Materials | $146B |
| 88 | AMGEN INC | 🇺🇸 United States | Health Care | $144B |
| 89 | BRISTOL-MYER SQB | 🇺🇸 United States | Health Care | $141B |
| 90 | SIEMENS AG | 🇩🇪 Germany | Industrials | $140B |
| 91 | BANK OF CHINA | 🇨🇳 China | Financials | $139B |
| 92 | PHILIP MORRIS INC | 🇺🇸 United States | Consumer Staples | $138B |
| 93 | LOWE'S COS INC | 🇺🇸 United States | Consumer Discretionary | $136B |
| 94 | CHARTER COMMUNICATIONS | 🇺🇸 United States | Telecommunications | $135B |
| 95 | CHINA MOBILE | 🇭🇰 Hong Kong SAR | Telecommunications | $134B |
| 96 | SONY GROUP CORP | 🇯🇵 Japan | Consumer Discretionary | $132B |
| 97 | ASTRAZENECA PLC | 🇬🇧 United Kingdom | Health Care | $131B |
| 98 | ROYAL BANK OF CANADA | 🇨🇦 Canada | Financials | $131B |
| 99 | STARBUCKS CORP | 🇺🇸 United States | Consumer Discretionary | $129B |
| 100 | ANHEUSER-BUSCH | 🇧🇪 Belgium | Consumer Staples | $128B |
Note: Data as of March 31, 2021.
Within the ranking, there was a wide disparity in value. Apple was worth over $2 trillion, more than 16 times that of Anheuser-Busch (AB InBev), which took the 100th spot at $128 billion.
In total, 59 companies were headquartered in the United States, making up 65% of the top 100’s total market capitalization. China and its regions was the second most common location for company headquarters, with 14 companies on the list.
Risers and Fallers
What are some of the notable changes to the biggest companies in the world compared to last year’s ranking?
Tesla’s market capitalization surged by an eye-watering 565%, temporarily making Elon Musk the richest person in the world. Food delivery platform Meituan and PayPal benefited from growing e-commerce popularity with their market capitalizations growing by 221% and 151% respectively.
Tech companies TSMC and ASML Holdings were also among the top 10 risers, thanks to a shortage of semiconductor chips and growing demand.
On the other end of the scale, Swiss companies Nestlé, Novartis, and Roche Holding were all among the bottom 10 companies by market capitalization growth. China Mobile was the only company to decline with a -12% change. The company was delisted from the New York Stock Exchange as a result of an executive order issued by former president Donald Trump, and recently announced its intention to list on the Shanghai Stock Exchange.
A Sector View
Across the 100 biggest companies in the world, some sectors had higher weightings.
| Sector | Total Market Cap in Top 100 | % of Top 100 Market Cap | Number of Companies in Top 100 |
|---|---|---|---|
| Technology | $10.5T | 33.0% | 20 |
| Consumer Discretionary | $6.0T | 18.9% | 17 |
| Financials | $3.4T | 10.8% | 14 |
| Health Care | $3.3T | 10.5% | 16 |
| Energy | $2.7T | 8.5% | 5 |
| Consumer Staples | $2.0T | 6.4% | 9 |
| Industrials | $2.0T | 6.4% | 9 |
| Telecommunications | $1.3T | 4.1% | 7 |
| Basic Materials | $0.3T | 1.0% | 2 |
| Utilities | $0.1T | 0.5% | 1 |
Technology had the highest market capitalization and was also the most common sector, with Big Tech dominating the top 10. Companies in the consumer discretionary, financials, and health care sectors also had a strong representation in the ranking.
Despite having only five companies on the list, the energy sector amounted to almost 10% of the top 100’s market capitalization, mostly due to Saudi Aramco’s whopping valuation.
An Uncertain Recovery
From near market lows on March 31, 2020, all sectors saw increases in their market capitalization. However, top 100 companies in some sectors outperformed their respective industry index, while others did not.
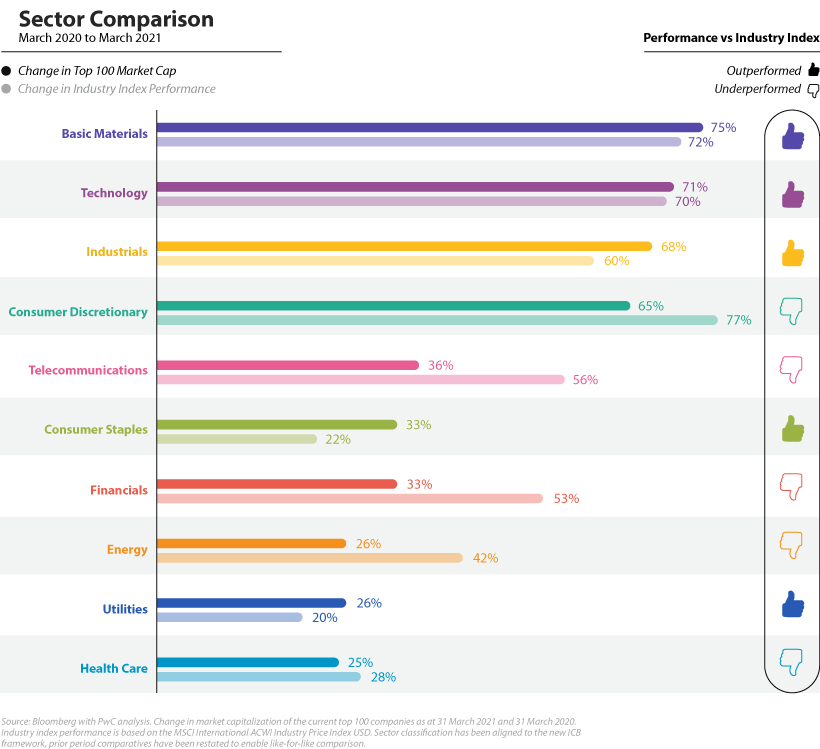
Basic materials and industrials, both cyclical sectors, were high performers in the top 100 and outperformed their respective industry indexes. Technology companies also outperformed, and accounted for $255 billion or 31% of all shareholder distributions by the top 100, far more than any other sector. Apple alone spent $73 billion on share buybacks and $14 billion in dividends in the 2020 calendar year.
On the other hand, the worst-performing sectors in the top 100 were health care, utilities, and energy. While the index performance for health care and utilities was also relatively poor, the wider energy sector performed fairly well.
It’s perhaps not surprising that all sectors saw positive returns since their low levels in March 2020, buoyed by fiscal stimulus and central bank policies. As countries begin to reopen, will the value of the biggest companies in the world continue to climb?


Markets
The Top Retailers in the World, by Store Count
Here are the top retailers in the world by physical store presence, illustrating the dominance of convenience and drug store chains.
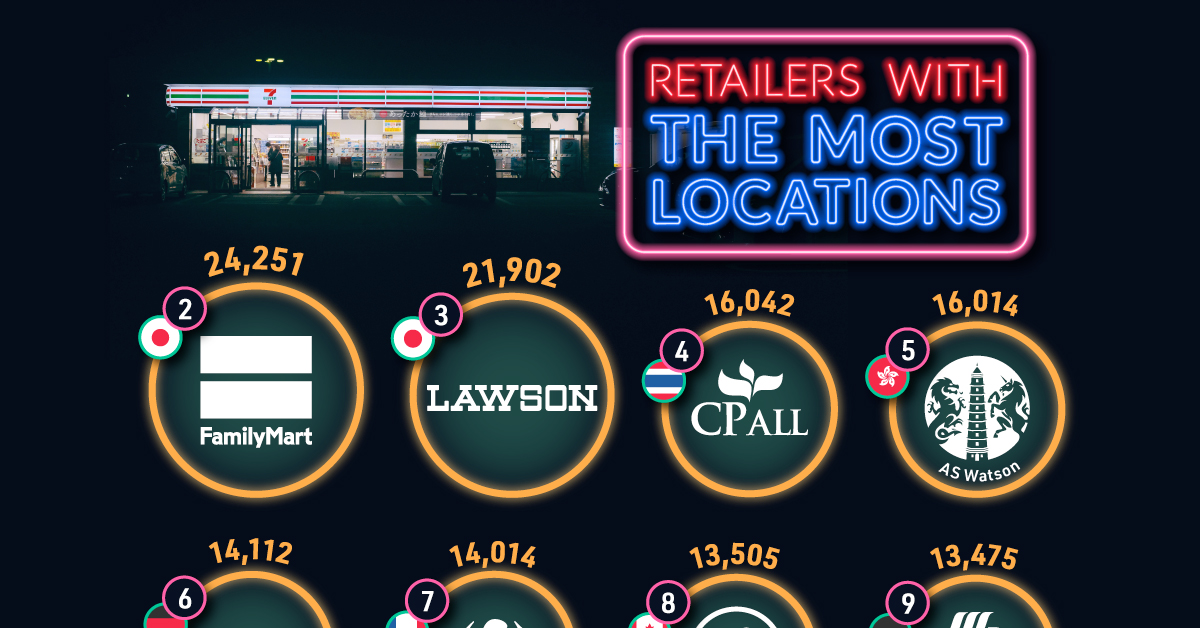
The Top Retailers in the World, by Store Count
This was originally posted on our Voronoi app. Download the app for free on iOS or Android and discover incredible data-driven charts from a variety of trusted sources.
Which retail chains have the highest global store counts?
Owing to their rapid speed of service in providing the basics to customers, convenience chains stand as the clear leaders. Going further, their smaller footprint allows them to expand their store counts at a greater scale.
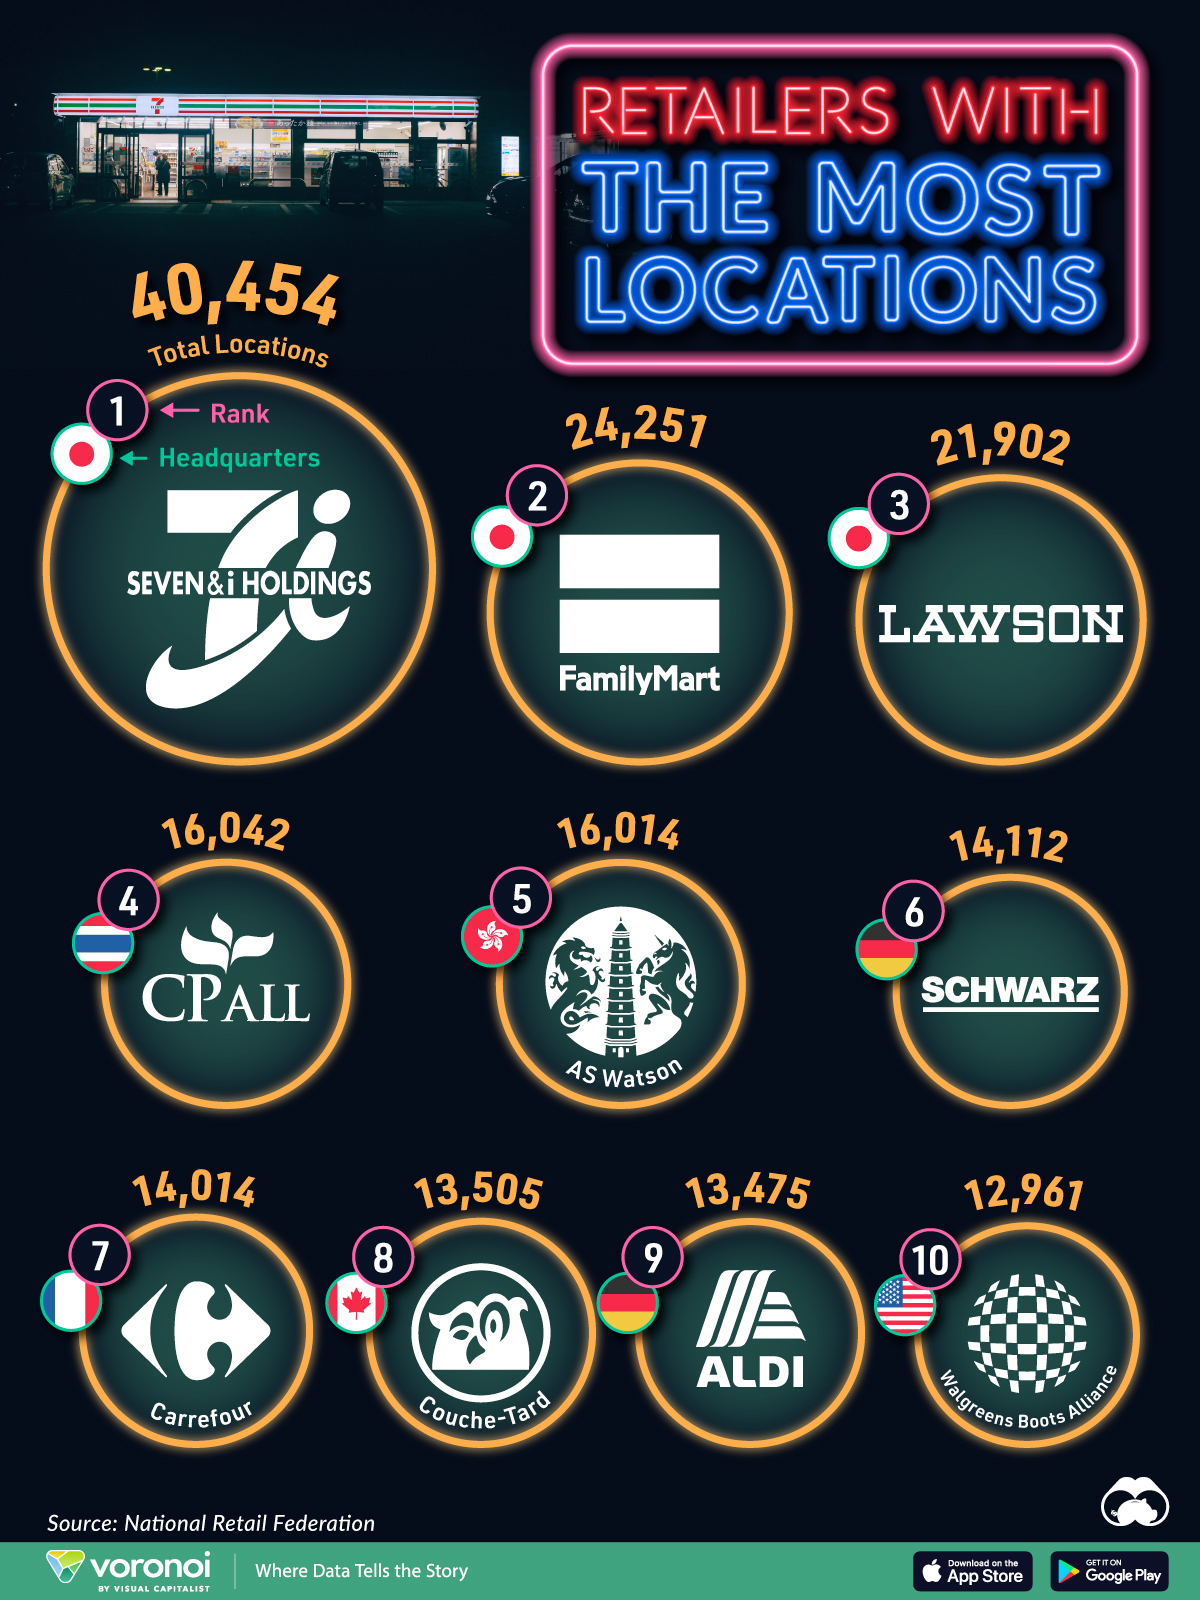
This graphic shows the top retailers in the world by store count, based on data from the National Retailers Federation.
Japanese Retailers Dominate the Pack
Below, we show the global retailers with the most physical storefronts in 2023:
| Ranking | Retailer | Total Stores Worldwide | Industry | Headquarters |
|---|---|---|---|---|
| 1 | Seven & I | 40,454 | Convenience Store | 🇯🇵 Japan |
| 2 | FamilyMart | 24,251 | Convenience Store | 🇯🇵 Japan |
| 3 | Lawson | 21,902 | Convenience Store | 🇯🇵 Japan |
| 4 | CP All | 16,042 | Convenience Store | 🇹🇭 Thailand |
| 5 | AS Watson | 16,014 | Drug Store | 🇭🇰 Hong Kong |
| 6 | Schwarz Group | 14,112 | Discount Grocery | 🇩🇪 Germany |
| 7 | Carrefour | 14,014 | Supermarkets | 🇫🇷 France |
| 8 | Couche-Tard | 13,505 | Convenience Store | 🇨🇦 Canada |
| 9 | Aldi | 13,475 | Discount Grocery | 🇩🇪 Germany |
| 10 | Walgreens Boots Alliance | 12,961 | Drug Store | 🇺🇸 U.S. |
Leading by a wide margin is Japan’s Seven & I Holdings, with 40,454 store locations worldwide.
The retail giant includes the 7-Eleven franchise along with Ito-Yokado, its supermarket chain. While the world’s largest convenience chain traces its origins to Dallas, Texas, the remainder of the U.S-based company (27%) was acquired in 2005 in a $1.2 billion deal that took the company fully private. Today, the company operates in 10 markets globally.
Next in line are Japan’s FamilyMart and Lawson, each boasting over 20,000 locations. For perspective, Walmart, America’s largest retail company by revenues, operates 10,569 locations globally.
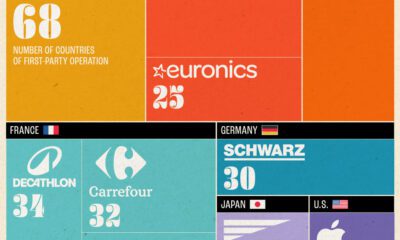
In Europe, Germany’s discount grocery chain Schwarz takes the lead, due to its extensive network of stores. Operating across 30 countries and with over 500,000 employees, the no-frills chain stands as a powerhouse. France’s supermarket giant, Carrefour, follows closely behind.
Ranking in eighth is Canadian retailer, Couche-Tard, with stores largely concentrated in North America and Europe. Since 2004, the company has made over 60 acquisitions, including 2,200 gas stations from French oil company TotalEnergies in 2023. The company is known for its Circle K brand, which operates in 24 countries globally.
Closing off the list is Walgreens Boots Alliance, the only American retailer in the rankings. The company owns the ubiquitous UK-based Boots brand, which was founded in 1849 in Nottingham. Yet as profits margins face increasing strains, it is looking to sell the subsidiary and instead focus more heavily on its U.S. pharmacy and healthcare businesses. With a presence in 13 countries, the pharmacy chain operates 12,961 stores worldwide.

-
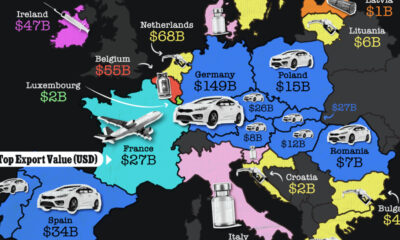
 Maps1 week ago
Mapped: The Top Export in Each EU Country
-
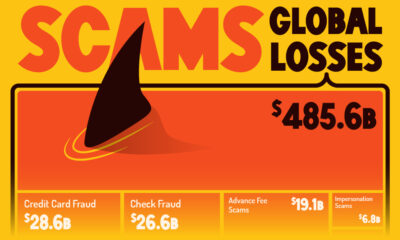
 Crime2 weeks ago
Visualizing Global Losses from Financial Scams
-
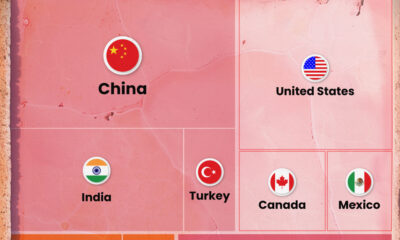
 Mining2 weeks ago
The Biggest Salt Producing Countries in 2023
-

 Markets2 weeks ago
Ranked: The Top 6 Economies by Share of Global GDP (1980-2024)
-
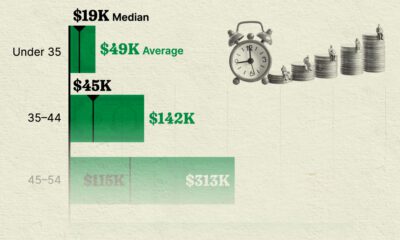
 Money2 weeks ago
Visualizing America’s Average Retirement Savings, by Age
-

 Markets2 weeks ago
Top 10 Countries Most in Debt to the IMF
-

 Politics2 weeks ago
Charted: How Democrats and Republicans View Government Agencies
-

 Maps2 weeks ago
Mapped: The Top Exports in Asian Countries