
Here’s How Much the Definition of Rich Has Changed in Every State

Over the five years of 2017 through 2022, wealth has changed significantly across most U.S. states. The median income may be $500,000 or more for those in the top 5% depending on where you live.
Read More: 6 Valuable Everyday Items You Should Never Throw Away
Find Out: 5 Unusual Ways To Make Extra Money (That Actually Work)
To determine how the definition of being rich has changed in each state over a five-year timeline, GOBankingRates studied the 2017 and 2022 American Community Surveys. Each state’s median income, the average income of the top 20% of earners and the average income of the top 5% of earners were found along with the five-year change in the average income of the top 20%.
Key Findings
The state with the largest five-year percentage increase in average income of the top 5% is Washington at 43.9%.
North Dakota ranks as the state with the lowest five-year percentage increase in average income of the top 5% at 14.68%.
In 2017, only Connecticut and the District of Columbia (D.C.) had median incomes of the top 5% of $500,000-plus. Five years later in 2022, this number rose to 12 U.S. states. The median income of the top 5% in Washington, California, Massachusetts, Hawaii, Virginia, Colorado, New York, New Jersey, Illinois, Maryland, Connecticut and the District of Columbia is more than $500,000-plus annually.
Read on for the ranking of states with the largest to smallest five-year change in average income.

Washington
5-Year Change (%) in Average Income of Top 5%: 43.9%
2022 Average Income of Top 5%: $544,518
2017 Average Income of Top 5%: $378,374
Check Out: 5 Unnecessary Bills You Should Stop Paying in 2024
Explore More: How To Get $340 Per Year in Cash Back on Gas and Other Things You Already Buy
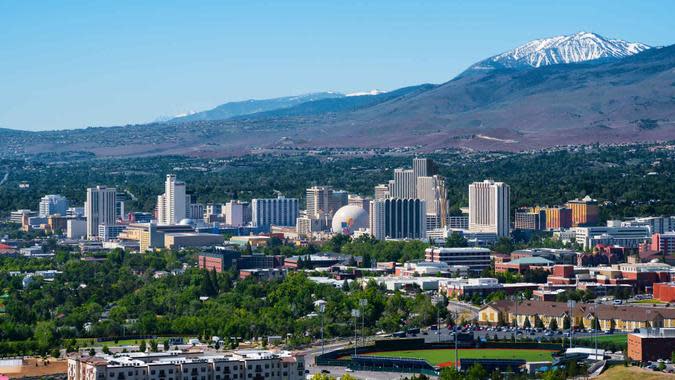
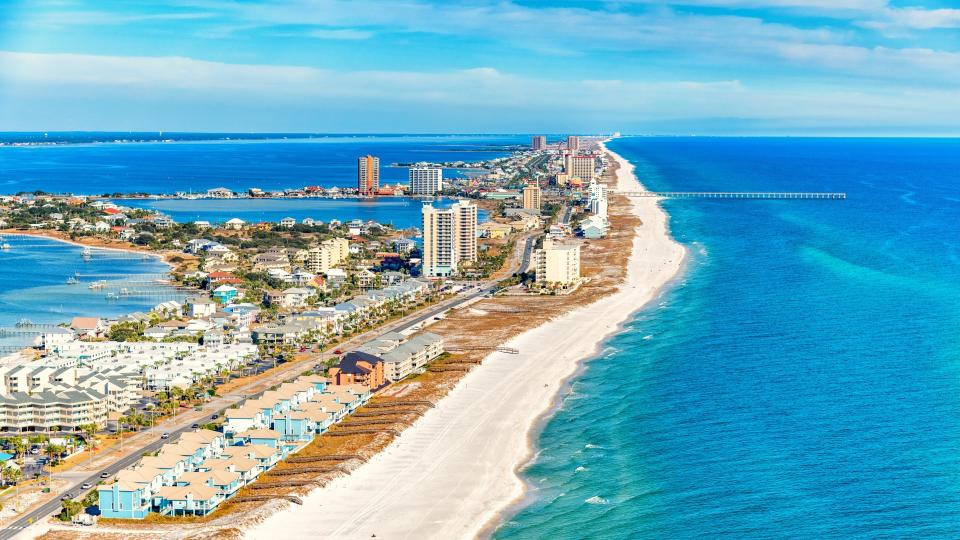
Nevada
5-Year Change (%) in Average Income of Top 5%: 40.41%
2022 Average Income of Top 5%: $449,872
2017 Average Income of Top 5%: $320,403
Discover More: 7 Appliances Frugal Homeowners Steer Clear Of

Idaho
5-Year Change (%) in Average Income of Top 5%: 40.34%
2022 Average Income of Top 5%: $402,743
2017 Average Income of Top 5%: $286,974

South Carolina
5-Year Change (%) in Average Income of Top 5%: 37.65%
2022 Average Income of Top 5%: $408,138
2017 Average Income of Top 5%: $296,503
California
5-Year Change (%) in Average Income of Top 5%: 37.21%
2022 Average Income of Top 5%: $613,602
2017 Average Income of Top 5%: $447,207

Utah
5-Year Change (%) in Average Income of Top 5%: 36.96%
2022 Average Income of Top 5%: $463,437
2017 Average Income of Top 5%: $338,384
Read More: Nearly Half of Americans Struggle To Pay Their Utility Bills: 5 Ways To Save

Oregon
5-Year Change (%) in Average Income of Top 5%: 36.15%
2022 Average Income of Top 5%: $448,649
2017 Average Income of Top 5%: $329,517
Arkansas
5-Year Change (%) in Average Income of Top 5%: 36.02%
2022 Average Income of Top 5%: $377,043
2017 Average Income of Top 5%: $277,187

Montana
5-Year Change (%) in Average Income of Top 5%: 35.89%
2022 Average Income of Top 5%: $411,205
2017 Average Income of Top 5%: $302,605

Nebraska
5-Year Change (%) in Average Income of Top 5%: 35.77%
2022 Average Income of Top 5%: $420,169
2017 Average Income of Top 5%: $309,480
For You: I’m a Frugal Shopper: 4 Items I Always Buy Secondhand To Save Money
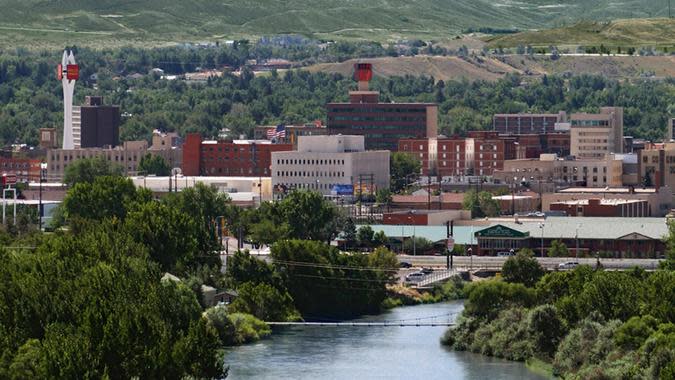
Wyoming
5-Year Change (%) in Average Income of Top 5%: 34.89%
2022 Average Income of Top 5%: $407,646
2017 Average Income of Top 5%: $302,217

Massachusetts
5-Year Change (%) in Average Income of Top 5%: 34.10%
2022 Average Income of Top 5%: $617,199
2017 Average Income of Top 5%: $460,251
Florida
5-Year Change (%) in Average Income of Top 5%: 34.01%
2022 Average Income of Top 5%: $476,546
2017 Average Income of Top 5%: $355,610
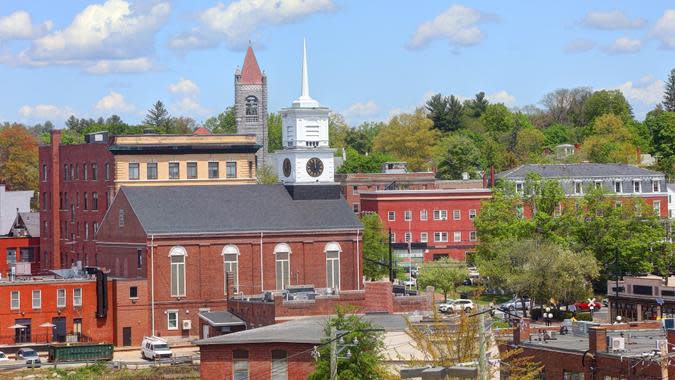
New Hampshire
5-Year Change (%) in Average Income of Top 5%: 33.26%
2022 Average Income of Top 5%: $485,660
2017 Average Income of Top 5%: $364,454
Find Out: 5 Frugal Habits of Mark Cuban

Maine
5-Year Change (%) in Average Income of Top 5%: 32.56%
2022 Average Income of Top 5%: $396,205
2017 Average Income of Top 5%: $298,886

Arizona
5-Year Change (%) in Average Income of Top 5%: 32.43%
2022 Average Income of Top 5%: $435,414
2017 Average Income of Top 5%: $328,778

North Carolina
5-Year Change (%) in Average Income of Top 5%: 32.37%
2022 Average Income of Top 5%: $429,071
2017 Average Income of Top 5%: $324,148

West Virginia
5-Year Change (%) in Average Income of Top 5%: 32.27%
2022 Average Income of Top 5%: $329,620
2017 Average Income of Top 5%: $249,200
Read Next: 10 Things Frugal People Always Buy at Yard Sales To Save Money

Hawaii
5-Year Change (%) in Average Income of Top 5%: 32.03%
2022 Average Income of Top 5%: $500,183
2017 Average Income of Top 5%: $378,854

Georgia
5-Year Change (%) in Average Income of Top 5%: 31.81%
2022 Average Income of Top 5%: $455,439
2017 Average Income of Top 5%: $345,535

Virginia
5-Year Change (%) in Average Income of Top 5%: 31.71%
2022 Average Income of Top 5%: $531,035
2017 Average Income of Top 5%: $403,190

Colorado
5-Year Change (%) in Average Income of Top 5%: 31.49%
2022 Average Income of Top 5%: $507,181
2017 Average Income of Top 5%: $385,707
Learn More: Mark Cuban Reveals Why He Keeps a Strict Budget Everyday

Kentucky
5-Year Change (%) in Average Income of Top 5%: 31.47%
2022 Average Income of Top 5%: $380,726
2017 Average Income of Top 5%: $289,587

Missouri
5-Year Change (%) in Average Income of Top 5%: 30.65%
2022 Average Income of Top 5%: $404,080
2017 Average Income of Top 5%: $309,278

Mississippi
5-Year Change (%) in Average Income of Top 5%: 30.59%
2022 Average Income of Top 5%: $333,597
2017 Average Income of Top 5%: $255,454

Alabama
5-Year Change (%) in Average Income of Top 5%: 30.46%
2022 Average Income of Top 5%: $370,977
2017 Average Income of Top 5%: $284,361
Explore More: I’m a Bank Teller: 9 Reasons You Should Never Ask for $2 Bills From the Bank

Pennsylvania
5-Year Change (%) in Average Income of Top 5%: 30.37%
2022 Average Income of Top 5%: $454,639
2017 Average Income of Top 5%: $348,739

Ohio
5-Year Change (%) in Average Income of Top 5%: 30.23%
2022 Average Income of Top 5%: $403,750
2017 Average Income of Top 5%: $310,017
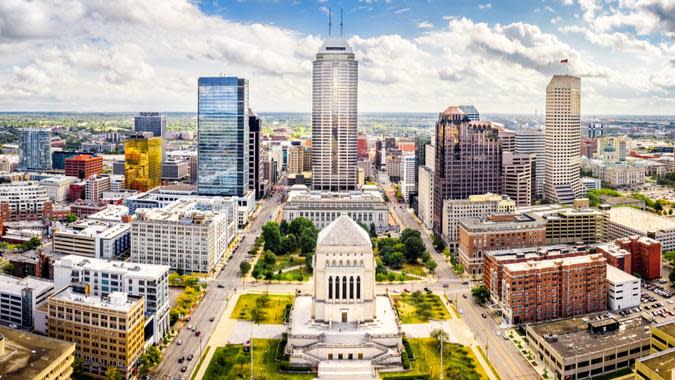
Indiana
5-Year Change (%) in Average Income of Top 5%: 29.66%
2022 Average Income of Top 5%: $381,422
2017 Average Income of Top 5%: $294,162

Tennessee
5-Year Change (%) in Average Income of Top 5%: 29.24%
2022 Average Income of Top 5%: $418,421
2017 Average Income of Top 5%: $323,763
Discover More: 8 Rare Coins Worth Millions That Are Highly Coveted by Coin Collectors
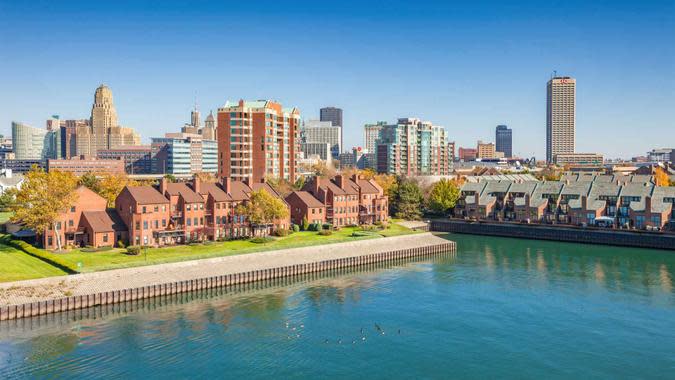
New York
5-Year Change (%) in Average Income of Top 5%: 29.23%
2022 Average Income of Top 5%: $621,301
2017 Average Income of Top 5%: $480,780

New Jersey
5-Year Change (%) in Average Income of Top 5%: 28.93%
2022 Average Income of Top 5%: $613,494
2017 Average Income of Top 5%: $475,827

Wisconsin
5-Year Change (%) in Average Income of Top 5%: 28.73%
2022 Average Income of Top 5%: $403,055
2017 Average Income of Top 5%: $313,091
Michigan
5-Year Change (%) in Average Income of Top 5%: 28.59%
2022 Average Income of Top 5%: $406,657
2017 Average Income of Top 5%: $316,232
Be Aware: How Much Does the Average Middle-Class Person Have in Savings?

Vermont
5-Year Change (%) in Average Income of Top 5%: 28.28%
2022 Average Income of Top 5%: $405,333
2017 Average Income of Top 5%: $315,972

Minnesota
5-Year Change (%) in Average Income of Top 5%: 27.91%
2022 Average Income of Top 5%: $476,290
2017 Average Income of Top 5%: $372,364
Illinois
5-Year Change (%) in Average Income of Top 5%: 27.88%
2022 Average Income of Top 5%: $503,970
2017 Average Income of Top 5%: $394,103
South Dakota
5-Year Change (%) in Average Income of Top 5%: 27.84%
2022 Average Income of Top 5%: $392,724
2017 Average Income of Top 5%: $307,194
For You: 6 Rare Coins That Will Spike in Value in 2024

Louisiana
5-Year Change (%) in Average Income of Top 5%: 27.58%
2022 Average Income of Top 5%: $384,432
2017 Average Income of Top 5%: $301,317
Kansas
5-Year Change (%) in Average Income of Top 5%: 27.31%
2022 Average Income of Top 5%: $415,875
2017 Average Income of Top 5%: $326,661

New Mexico
5-Year Change (%) in Average Income of Top 5%: 26.07%
2022 Average Income of Top 5%: $353,104
2017 Average Income of Top 5%: $280,094

Oklahoma
5-Year Change (%) in Average Income of Top 5%: 25.75%
2022 Average Income of Top 5%: $377,724
2017 Average Income of Top 5%: $300,382
Read More: How Can You Withdraw Money From a Bank Account? 3 Ways To Know

Iowa
5-Year Change (%) in Average Income of Top 5%: 25.38%
2022 Average Income of Top 5%: $386,152
2017 Average Income of Top 5%: $307,993
Maryland
5-Year Change (%) in Average Income of Top 5%: 25.36%
2022 Average Income of Top 5%: $540,934
2017 Average Income of Top 5%: $431,491

Rhode Island
5-Year Change (%) in Average Income of Top 5%: 25.22%
2022 Average Income of Top 5%: $453,192
2017 Average Income of Top 5%: $361,920

Texas
5-Year Change (%) in Average Income of Top 5%: 24.60%
2022 Average Income of Top 5%: $464,859
2017 Average Income of Top 5%: $373,094
Trending Now: I’m a Self-Made Millionaire: Here’s My Monthly Budget

Connecticut
5-Year Change (%) in Average Income of Top 5%: 24.00%
2022 Average Income of Top 5%: $656,438
2017 Average Income of Top 5%: $529,367

District of Columbia
5-Year Change (%) in Average Income of Top 5%: 23.57%
2022 Average Income of Top 5%: $719,253
2017 Average Income of Top 5%: $582,044

Delaware
5-Year Change (%) in Average Income of Top 5%: 22.36%
2022 Average Income of Top 5%: $442,860
2017 Average Income of Top 5%: $361,946

Alaska
5-Year Change (%) in Average Income of Top 5%: 20.17%
2022 Average Income of Top 5%: $424,278
2017 Average Income of Top 5%: $284,361
Explore More: Bill Gates’ $10.95 Million Daily Income: How the Microsoft Legend Spends It
North Dakota
5-Year Change (%) in Average Income of Top 5%: 14.68%
2022 Average Income of Top 5%: $418,541
2017 Average Income of Top 5%: $364,954
Methodology: For this piece, GOBankingRates used the 2022, 2017, and 2012 American Community Surveys as conducted by the US Census Bureau to find every state’s: (1) 2022, 2017, and 2012 median incomes; (2) 2022, 2017, and 2012 average income of the top 20% earners; and (3) 2022, 2017, and 2012 average income of the top 5% earners. GOBankingRates then found the (4) 5-year ($) change in average income of the top 20% of earners; (5) 5-year (%) change in average income of the top 20% of earners; (6) 10-year ($) change in average income of the top 5% of earners; and (7) 10-year (%) change in average income of the top 5% of earners. All data was collected and is up to date as of May 21, 2024.
More From GOBankingRates
Barbara Corcoran: 3 Cities To Invest in Real Estate Now Before Prices Skyrocket
This is The Single Most Overlooked Tool for Becoming Debt-Free
This article originally appeared on GOBankingRates.com: Here’s How Much the Definition of Rich Has Changed in Every State
