Crime and Safety in Gainsborough
Last updated: 01 May 2024
Gainsborough is the most dangerous small town in Lincolnshire, and is the third most dangerous overall out of Lincolnshire's 563 towns, villages, and cities. The overall crime rate in Gainsborough in 2023 was 183 crimes per 1,000 people. This compares poorly to Lincolnshire's overall crime rate, coming in 119% higher than the Lincolnshire rate of 84 per 1,000 daytime population. For England, Wales, and Northern Ireland as a whole, Gainsborough is among the top 20 most dangerous small towns, and the 128th most dangerous location out of all towns, cities, and villages.
In April 2022, Gainsborough had the worst crime rate in Lincolnshire for theft from the person, with 1 crime reported and a crime rate of 0.05 per 1,000 daytime population. March 2021 was also a bad month for Gainsborough residents, when it was Lincolnshire's most dangerous area for theft from the person, recording 2 crimes at a rate of 0.10 per 1,000 daytime population.
The most common crimes in Gainsborough are violence and sexual offences, with 1,311 offences during 2023, giving a crime rate of 68. This is 7% lower than 2022's figure of 1,416 offences and a difference of 5.42 from 2022's crime rate of 73. Gainsborough's least common crime is theft from the person, with 9 offences recorded in 2023, an increase of 50% from 2022's figure of 6 crimes.
Gainsborough 2024 Crime Scorecard
Most Dangerous
Small Towns, Lincolnshire
97% higher, regional crime rate
East Midlands
110% higher, national crime rate
England, Wales & NI
Local Crime in Context
As of 2024, the crime rate in Gainsborough is 97% higher than the East Midlands and 110% higher than the England, Wales & Northern Ireland overall figure.
Looking for more detail? Get city and postcode crime dashboards with CrimeRate Pro →
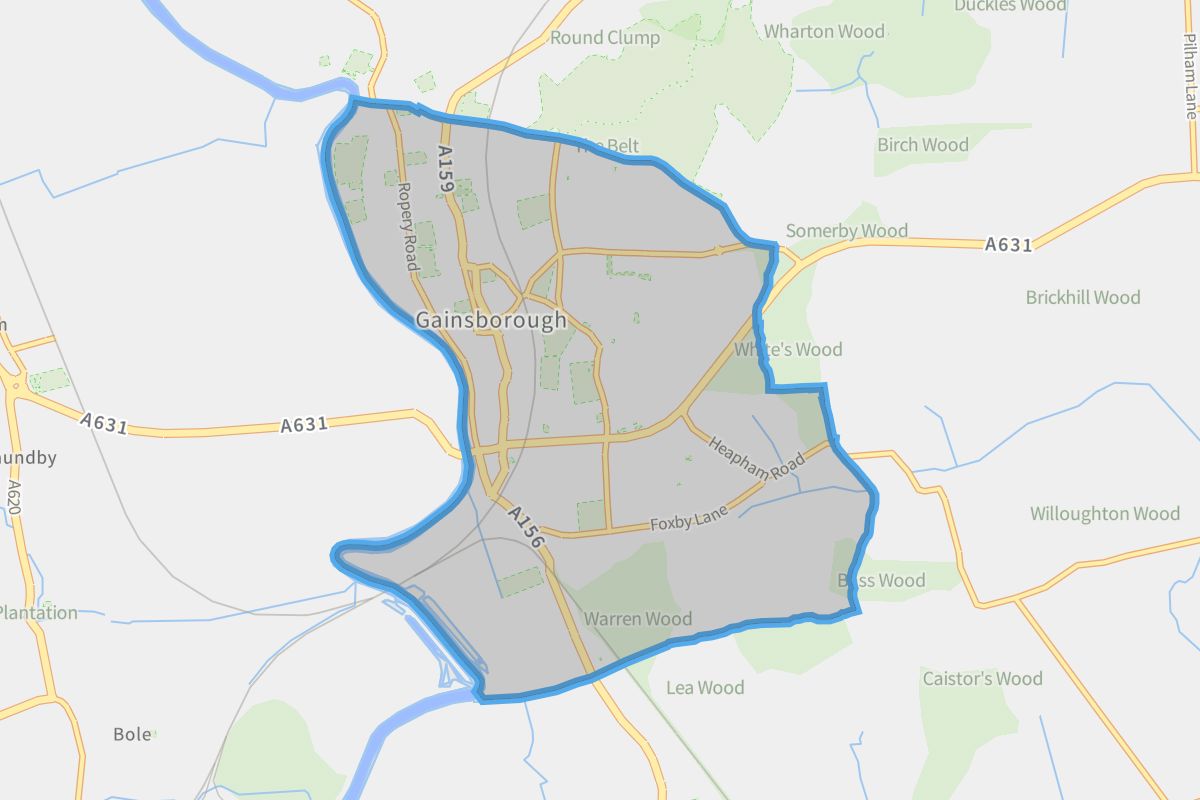
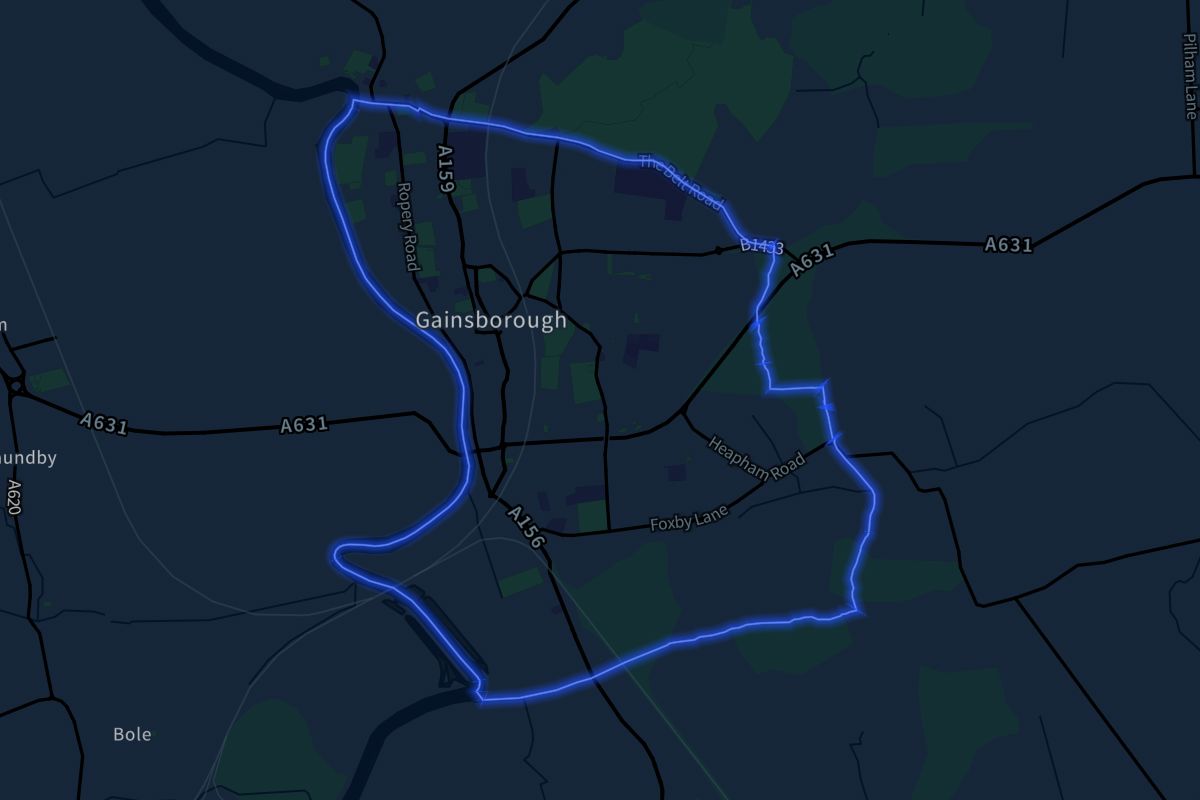
Gainsborough Crime Map
Incidents mapped in Gainsborough represent the time frame between December 2023 and March 2024. Each point on the map represents an area where crimes have been recorded locally.
Use Crime Map
Hover over a point to see a breakdown of crime types recorded at that location. You can also filter by individual crime types, or use a combinations of offences to visualise the data you need.

See How Gainsborough Compares
You can compare Gainsborough's crime statistics against any other town, village, or city from across the country. Search for a location's name below to see how they stack up.

CrimeRate Pro
Crime Dashboard
Gainsborough
The CrimeRate Index shows how crime levels compare to the national average.
1.0 equals the average
2.0 is double
3.0 triple
0.5 is half and
0.25 a quarter.
CrimeRate Indexes
Smart Areas of 1,000, 5,000, and 25,000 people
Hotspot Heatmaps
Crime Type Breakdowns
Crime Trends & Seasons
Full Crime Rates, Counts, and Figures
Find out crime indexes, counts, rates, trends, history, charts and breakdowns for every town, city, and postcode across the country with CrimeRate Pro
Gainsborough Compared to Nearby Small Towns
Gainsborough is more dangerous than Immingham (56% safer), Mablethorpe and Sutton (55% safer), Sleaford (45% safer), Barton-upon-Humber (35% safer), and Skegness (1.1% safer).
Comparing Gainsborough to the UK's Major Cities
Looking at the top cities around the UK, Gainsborough's overall crime rate is higher than Birmingham (25% safer), City of London (84% safer), Camden (40% safer), Belfast City (73% safer), Tower Hamlets (46% safer), Leeds (18% safer), Liverpool (26% safer), Bristol (35% safer), Westminster (27% safer), and Sheffield (42% safer).
Recent Crimes in Gainsborough
These are the top 19 most recent crime reports in Gainsborough.
| Date | Crime Type | Location | Outcome |
|---|---|---|---|
| March 2024 | Shoplifting | On or near Parnell Street | Under investigation |
| March 2024 | Violence and sexual offences | On or near Tooley Street | Under investigation |
| March 2024 | Criminal damage and arson | On or near Sandsfield Lane | Investigation complete; no suspect identified |
| March 2024 | Criminal damage and arson | On or near Washington Street | Under investigation |
| March 2024 | Violence and sexual offences | On or near Beaufort Street | Under investigation |
| March 2024 | Shoplifting | On or near Torr Street | Under investigation |
| March 2024 | Shoplifting | On or near Spital Terrace | Under investigation |
| March 2024 | Criminal damage and arson | On or near Washington Street | Under investigation |
| March 2024 | Shoplifting | On or near Market Place | Under investigation |
| March 2024 | Shoplifting | On or near Market Place | Under investigation |
| March 2024 | Violence and sexual offences | On or near Market Place | Investigation complete; no suspect identified |
| March 2024 | Drugs | On or near Darwin Street | Under investigation |
| March 2024 | Violence and sexual offences | On or near Gordon Street | Under investigation |
| March 2024 | Shoplifting | On or near Torr Street | Under investigation |
| March 2024 | Shoplifting | On or near Torr Street | Under investigation |
| March 2024 | Violence and sexual offences | On or near Torr Street | Under investigation |
| March 2024 | Shoplifting | On or near Torr Street | Under investigation |
| March 2024 | Violence and sexual offences | On or near Lincoln Street | Under investigation |
| March 2024 | Violence and sexual offences | On or near Rachel Close | Under investigation |
Crime in and around Gainsborough's Wards
Gainsborough South-West has the highest crime rate out of Gainsborough's local and nearby wards, with 291 crimes reported per 1,000 daytime population.
| Ward | Crime Count | Crime Rate | Top Crime | 2nd Crime | 3rd Crime |
|---|---|---|---|---|---|
| E05009640 Gainsborough East | 970 | 136 | V/S Offences | Criminal D&A | Other Theft |
| E05009641 Gainsborough North | 712 | 128 | V/S Offences | Criminal D&A | Other Theft |
| E05009642 Gainsborough South-West | 1,826 | 291 | V/S Offences | Shoplifting | Criminal D&A |
Gainsborough Ward Crime Breakdown
| Crime Type | Safest Ward | Most Dangerous Ward |
|---|---|---|
| Anti-Social Behaviour | E05009641 Gainsborough North (148) | E05009642 Gainsborough South-West (280) |
| Bicycle Theft | E05009641 Gainsborough North (6) | E05009642 Gainsborough South-West (24) |
| Burglary | E05009641 Gainsborough North (30) | E05009642 Gainsborough South-West (136) |
| Criminal Damage and Arson | E05009641 Gainsborough North (108) | E05009642 Gainsborough South-West (228) |
| Drugs | E05009641 Gainsborough North (13) | E05009642 Gainsborough South-West (55) |
| Other Crime | E05009641 Gainsborough North (24) | E05009642 Gainsborough South-West (37) |
| Other Theft | E05009641 Gainsborough North (50) | E05009642 Gainsborough South-West (95) |
| Possession of Weapons | E05009641 Gainsborough North (8) | E05009642 Gainsborough South-West (31) |
| Public Order | E05009641 Gainsborough North (35) | E05009642 Gainsborough South-West (138) |
| Robbery (inc. mugging) | E05009641 Gainsborough North (6) | E05009642 Gainsborough South-West (20) |
| Shoplifting | E05009641 Gainsborough North (8) | E05009642 Gainsborough South-West (438) |
| Theft From the Person (inc. pickpocketing) | E05009640 Gainsborough East (0) | E05009642 Gainsborough South-West (8) |
| Vehicle Crime | E05009640 Gainsborough East (34) | E05009642 Gainsborough South-West (53) |
| Violence and Sexual Offences | E05009641 Gainsborough North (374) | E05009642 Gainsborough South-West (563) |
Gainsborough's Community Safety Partnerships
| Community Safety Partnership | Crime Count | Crime Rate | Top Crime | 2nd Crime | 3rd Crime |
|---|---|---|---|---|---|
| E22000179 West Lindsey | 6,596 | 84 | V/S Offences | Criminal D&A | Shoplifting |
CrimeRate Insights
Crime Reports for Postcodes and Addresses
Get the crime information you need to make an informed decision. Each report includes separate details for crimes within 0.25 km, 0.5 km, and 1 km of your address.
Reports also identify local crime hotspots, and with the included heatmaps, you can see at a glance where the areas to avoid are, broken down by crime type.
All reports include instant online delivery 24 hours a day, 7 days a week.
