What is the M2 Measure?
M2 measure is an extended and more useful version of the Sharpe ratio which gives us the risk-adjusted return of the portfolio by multiplying the Sharpe ratio with the standard deviation of any benchmark market index and adding risk-free return thereafter to it.
Table of contents
Key Takeaways
- M2 measure is a risk-adjusted performance metric derived from the Sharpe ratio, used to assess the performance of a portfolio relative to a benchmark and the risk-free rate of return.
- It is calculated by multiplying the Sharpe ratio by the standard deviation of the benchmark and adding the risk-free rate of return.
- The M2 measure is advantageous because it provides an easy-to-interpret percentage return unit, facilitating portfolio comparison.
- However, it has limitations as it relies solely on historical risk data and can be manipulated by portfolio managers to enhance their risk-adjusted returns.
Formula & Steps to Calculate M2 measure
For the calculation of the M2, firstly, the Sharpe ratio (annual) will be calculated. The calculated Sharpe ratio will then be used for deriving the M squared by multiplying the Sharpe ratio by the standard deviation of the benchmark. Here the benchmark will be chosen by the person calculating the M2 measure.
Examples of standard benchmark could be the MSCI World index, S&P 500 index, or any other broad index. After multiplying the Sharpe ratio by the standard deviation of the benchmark, the risk-free rate of return will be added.
The following are the steps or formulas for the calculation of the M2 measure.
Step 1: Calculation of Sharpe ratio (annualized)
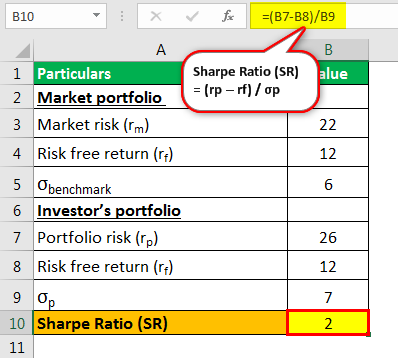
Sharpe Ratio Formula (SR) = (rp – rf) / σp
Where,
- rp = return of the portfolio
- rf = risk-free rate of return
- σp = standard deviation of the excess return of the portfolio
Step 2: Multiplying Sharpe ratio as calculated in step 1 with the standard deviation of the benchmark
= SR * σbenchmark
Where,
- σbenchmark = standard deviation of benchmark
Step 3: Adding the risk-free rate of return to the outcome derived in step 2
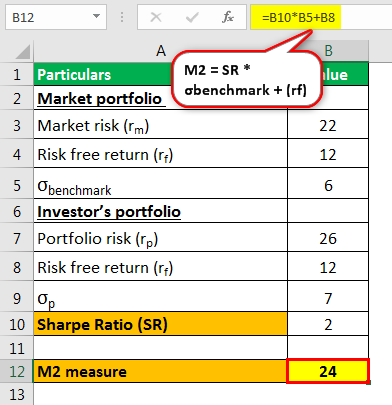
M squared measure = SR * σbenchmark + (rf)

You are free to use this image on your website, templates, etc, Please provide us with an attribution linkHow to Provide Attribution?Article Link to be Hyperlinked
For eg:
Source: M2 Measure (wallstreetmojo.com)
With the equation as derived above for the calculation of Modigliani–Modigliani measure, it can be seen that the M2 measure is the excess return, which is weighted over the standard deviation of benchmark and portfolio increasing with the risk-free rate of return.
Financial Modeling & Valuation Courses Bundle (25+ Hours Video Series)
–>> If you want to learn Financial Modeling & Valuation professionally , then do check this Financial Modeling & Valuation Course Bundle (25+ hours of video tutorials with step by step McDonald’s Financial Model). Unlock the art of financial modeling and valuation with a comprehensive course covering McDonald’s forecast methodologies, advanced valuation techniques, and financial statements.
Example to Calculate M squared measure
Use Market Portfolio with Investors portfolio to calculate Modigliani–Modigliani measure.
Given:
Market Portfolio:
- Market Risk (rm): 22
- Risk free return (rf): 12
- σbenchark: 6
Investor’s Portfolio:
- Portfolio risk (rp) : 26%
- Ris free return (rf): 12%
- σp: 7
Calculation of Modigliani risk-adjusted performance(RAP)
- Calculation of Sharpe ratio

Sharpe Ratio (SR) = (26 – 12) / 7
Sharpe Ratio (SR) = 14 / 7
Sharpe Ratio (SR) = 2 - Calculation of M2 measure

M2 = SR * σbenchmark + (rf)
M2 = 12 + (12)
M2 = 24 %
Advantages
- It is a risk-adjusted performance metric that is easy to interpret.
- M2 measure is more useful when compared with the Sharpe ratio from which it is derived because it is awkward to interpret Sharpe ratio when the same is negative.
- Also, one might find it difficult to compare Sharpe ratios directly from different investments. Like if one wants to compare two different portfolios, one having a Sharpe ratio of 0.60 and another having −0.60, then it would be difficult to conclude how worse the second portfolio is.
- The same is in case of another measure like Treynor ratio, Sortino ratio, and other ratios, which are calculated in terms of ratio. This problem is overcome in Modigliani risk-adjusted performance as it is in percentage return unit, which can be interpreted instantly and easily by all the investors.
- So, it is easy to know the difference between the two or more investment portfolios. Like M2 values of portfolio 1 are 5.4% and of the second portfolio is 5.9%, then it shows that there is a difference of 0.5 percentage risk-adjusted return with riskiness adjusted with the benchmark portfolio.
- Thus it helps in comparing the two different portfolios.
Disadvantages
- The data used for the calculation of M2 measures incorporate only historical risk.
- The portfolio manager can manipulate the measures that seek to boost their history of risk-adjusted returns.
Important points of the M2 measure
- The calculated return of the portfolio will be equal to the M2 measure when the portfolio’s standard deviation is equal to the standard deviation of the benchmark. This generally happens when the portfolio is tracking an index.
- The M squared measure also has an alternative where a systematic risk component will be used in place of the full volatility component. The same, however, will be a good indicator only if the portfolio under consideration is a well-diversified portfolio because under diversification may lead to underestimation of the portfolio’s riskiness as some idiosyncratic risk will be left in that case.
- The M2 measure is derived directly from the Sharpe ratio so, any portfolio orderings using the M2 measure will exactly be the same as the portfolio ordering using the Sharpe ratio.
- M2 measure helps in measuring the returns of portfolios after adjusting the risk associated, i.e., it measures the risk-adjusted return of the different investment portfolios relative to a benchmark.
- M2 measure is also sometimes known as M squared, Modigliani–Modigliani measure, RAP, or Modigliani risk-adjusted-performance.
- One can interpret the M2 measure as the difference between the portfolio’s scaled excess return with that of the market, where the scaled portfolio has volatility being the same as that of the market.
- The M squared measure is calculated from the famous and widely used ‘Sharpe ratio’ with the added advantage that it is in units of the percent return, which makes it more intuitive for the interpretation by the user.
Frequently Asked Questions (FAQs)
Yes, the M2 measure can be applied to various investments or asset classes as long as a benchmark is available. The M2 measure allows for a standardized evaluation of risk-adjusted performance across different investment options, whether stocks, bonds, mutual funds, or other investment vehicles.
The M2 measure helps identify superior portfolio performance by considering both the excess return and the risk associated with a benchmark. A higher M2 measure indicates that the portfolio has achieved a greater risk-adjusted return than the benchmark and the risk-free rate. It allows investors to assess whether the additional risk taken in the portfolio has been adequately rewarded.
While the M2 measure provides valuable insights into risk-adjusted performance, it does have limitations. One limitation is that it relies on historical risk data, which may not accurately reflect future market conditions. Additionally, the M2 measure assumes a linear relationship between risk and return, which may not always hold true. Considering other factors and conducting thorough analysis is essential when making investment decisions.
Conclusion
M2 measure is helpful in knowing that with the specified amount of risk taken, how well the portfolio is rewarding the investor, in relation to the benchmark portfolio and the risk-free rate of return. So, if an investment is considered which has more risk than the benchmark portfolio, with small performance advantage, then it might have less risk-adjusted performance when compared with another portfolio where there is less risk in relation to some benchmark portfolio, but having a similar amount of return. It is easy to interpret and helpful in comparison to two or more portfolios by the user.
Recommended Articles
This has been a guide to what is M2 Measure. Here we discuss the formula to calculate M squared measure along with examples, advantages & disadvantages. You can learn more about Investment Banking from the following articles –

Leave a Reply