Judge for yourself
It’s called Exponential Decay — and it describes Bitcoin
I hate being the bearer of bad news, but data are data.
The fact is that the bull market cycles in Bitcoin have lost a tremendous amount of thrust over the years. You may like the story of this data or not — but you will have to deal with it (or at least account for it, adjust for it or just plain ignore it). In fact, I don’t like the Exponential Decay occurring in Bitcoin — Bitcoin is one of my personal largest investment positions.
There have been four major bull cycles in Bitcoin, with the current advance the fifth major bull cycle [the advance from cycle low to cycle high shown in brackets].
- Dec 21, 2009 to Jun 6, 2011 [3,191X advance]
- Nov 14, 2011 to Nov 25, 2013 [572X advance]
- Aug 17, 2015 to Dec 18, 2017 [ 122X advance]
- Dec 10, 2018 to Nov 8, 2021 [ 22X advance]
- Nov 21, 2022 to xxx x,, yyyy [high so far is $73,835 registered on Mar 14, 2024]
Now, here is where Exponential Decay is showing its ugly head.
- The magnitude of the 2011-2013 was approx. 20% of the 2009-2011 cycle
- The magnitude of the 2015-2017 was approx. 20% of the 2011-2013 cycle
- The magnitude of the 2018-2021 was approx. 20% of the 2015-2017 cycle
Worded another way, 80% of the exponential energy of each successful bull market cycle has been lost.
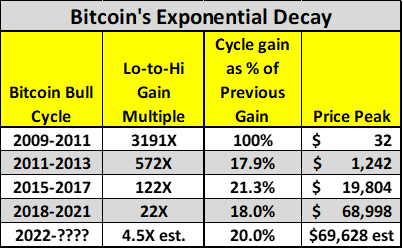
Applied forward, this would indicate that the current bull cycle will experience an an exponential advance of approximately 4.5X or so (80% of the 22X of the 2018-2021 cycle).
Taking a low for the current cycle of $15,473 projects a high for this cycle of $72,723 — guess what — a price that has already been reached.
Well, you will ask, what about the halving? Prices have exploded upwards after every previous halving. And that may happen again.
But for now we need to deal with the fact of Exponential Decay. It has happened. It is real. You may not want to believe it, but I place a 25% chance that Bitcoin has already topped for this cycle.
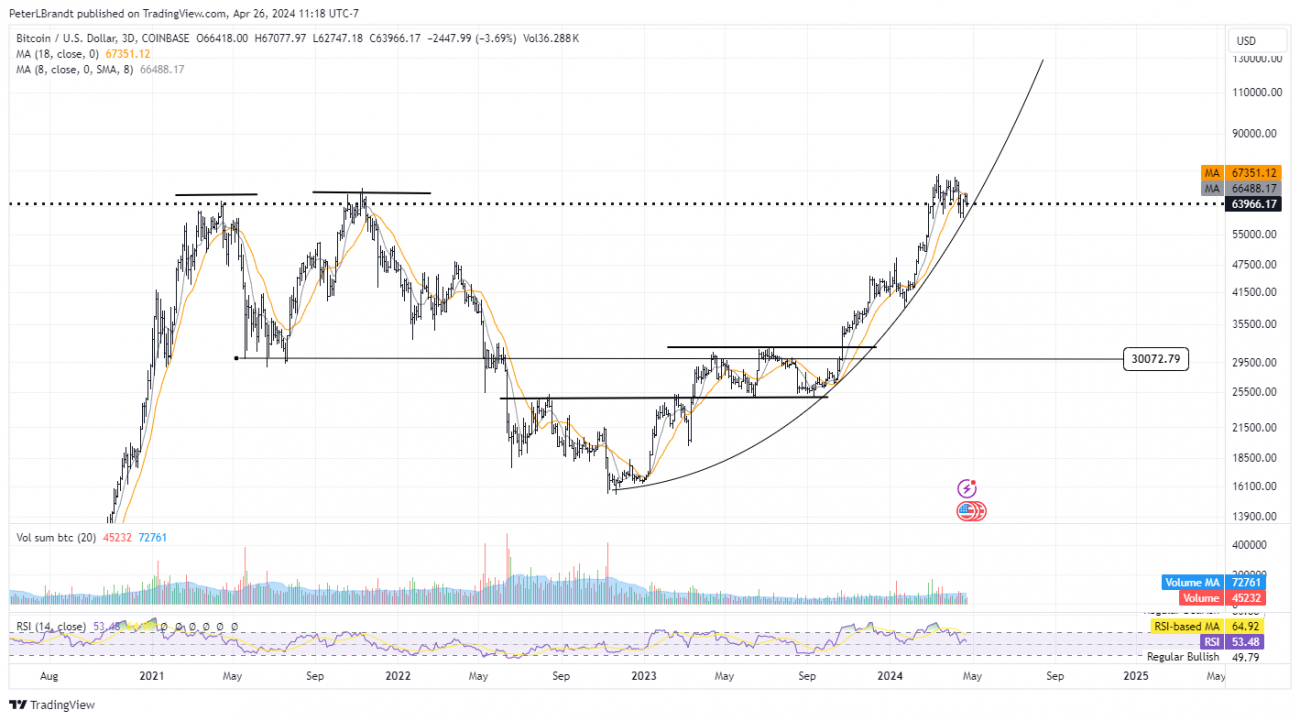
If Bitcoin has topped, what’s next you might ask. Of course I have no clue. But, if Bitcoin has topped I would expect a decline back to the mid-$30s, or the 2021 lows. From a classical charting point of view, such a decline is the most bullish thing that could happen from a long-term view. If you want to see an example of such a chart structure, look at the Gold chart from Aug 2020 to Mar 2024.
Do I believe the analysis just presented? I don’t want to, but the data speak for itself.
End

Webinar – Factor Trading
/by Peter BrandtYou don’t have access to view this content
Factor Market Update Video – May 18, 2024
/by Peter BrandtYou don’t have access to view this content
Factor Update May 18 2024
/by Peter BrandtYou don’t have access to view this content
Factor Update May 11 2024
/by Peter BrandtYou don’t have access to view this content
Factor Update May 4 2024
/by Peter BrandtYou don’t have access to view this content
Bitcoin — a once in a lifetime trade, never to be equaled
/by Peter BrandtThere has never been and may never be another market like Bitcoin $BTC
2024 is my 50th year anniversary of the first futures market trade of my life — it was for contracts of bags of pre-1964 Silver quarters and dimes. https://www.nytimes.com/1971/04/02/archives/futures-in-silver-coins-traded.html
I have traded a best-guess 35,000-plus futures contracts in my life covering everything from Corn to Gold, treasuries to Copper, Sugar to Palm Oil, Lumber to Cattle, stock indexes to shelled eggs, Iron Ore to Idaho Potatoes.
I can say with no pause that there has never been a market like Bitcoin. Sure, some of you ask, but what Alt-coins and memes? Well, these proliferations owe their existence to Bitcoin.
What makes Bitcoin so unique? There are two things I point to:
This blog post focuses on the second point above — the price discovery history of Bitcoin. Here are the unique features not attributable to any other asset I can identify.
Repeated multiple X price advances. Just to name them:
Even though Bitcoin’s advances have been subject to exponential decay, the advance still put Bitcoin in a class by itself.
The other price behavior feature is the magnitude of the bear market crashes between the multiple X advances. There have been at least seven declines in Bitcoin larger than 50% and six grater than 75%. Thus, Bitcoin has a unique feature of making some people a huge bundle and wiping out another cohort.
The chart below is a graphic representation of the above. Not only have the major advances in BTC been according of parabolic nature, but of parabolic on log scale. I can find no other stock, commodity or publicly traded asset that can make the same claim.
What’s next for Bitcoin? Who knows. I am in my late 70s and of poor health, so I am unlikely to witness the end of the Bitcoin story. But I have no doubt but that excitement and surprises are to come. I remember that the stock market of the 1980s was the era of hostile takeovers of corporations. Bitcoin represents an attempted hostile takeover of the world’s currency system. What an exciting story to follow and take part in. I feel privledged that I’ve been able in some small part to have taken part in this grand experiment.
End
Something really interesting and self-explanatory
/by Peter BrandtYou don’t have access to view this content
History of Bitcoin bull market corrections since 2015
/by Peter BrandtHere is an update upon numerous requests
Factor Update April 27 2024
/by Peter BrandtYou don’t have access to view this content
Does history make a case that Bitcoin has topped?
/by Peter BrandtJudge for yourself
It’s called Exponential Decay — and it describes Bitcoin
I hate being the bearer of bad news, but data are data.
The fact is that the bull market cycles in Bitcoin have lost a tremendous amount of thrust over the years. You may like the story of this data or not — but you will have to deal with it (or at least account for it, adjust for it or just plain ignore it). In fact, I don’t like the Exponential Decay occurring in Bitcoin — Bitcoin is one of my personal largest investment positions.
There have been four major bull cycles in Bitcoin, with the current advance the fifth major bull cycle [the advance from cycle low to cycle high shown in brackets].
Now, here is where Exponential Decay is showing its ugly head.
Worded another way, 80% of the exponential energy of each successful bull market cycle has been lost.
Applied forward, this would indicate that the current bull cycle will experience an an exponential advance of approximately 4.5X or so (80% of the 22X of the 2018-2021 cycle).
Taking a low for the current cycle of $15,473 projects a high for this cycle of $72,723 — guess what — a price that has already been reached.
Well, you will ask, what about the halving? Prices have exploded upwards after every previous halving. And that may happen again.
But for now we need to deal with the fact of Exponential Decay. It has happened. It is real. You may not want to believe it, but I place a 25% chance that Bitcoin has already topped for this cycle.
If Bitcoin has topped, what’s next you might ask. Of course I have no clue. But, if Bitcoin has topped I would expect a decline back to the mid-$30s, or the 2021 lows. From a classical charting point of view, such a decline is the most bullish thing that could happen from a long-term view. If you want to see an example of such a chart structure, look at the Gold chart from Aug 2020 to Mar 2024.
Do I believe the analysis just presented? I don’t want to, but the data speak for itself.
End
Factor Update, April 13, 2024 (released April 12)
/by Peter BrandtYou don’t have access to view this content