By Justin Hsieh, Staff Writer
Fountain Valley High School (FVHS) came out on top in the 2019 U.S. News & World Report Best High Schools rankings released last week, leading the schools of the Huntington Beach Union High School District (HBUHSD) in overall national rankings and most of the individual ranking categories.
The rankings are developed annually by U.S. News & World Report, an online American media company best known for ranking publications such as Best Colleges and Best Hospitals. This year, the company collaborated with nonprofit research organization RTI International to review over 23,000 public schools in all 50 states and the District of Columbia. U.S. News ranked the 17,245 schools that had sufficient enrollment to be considered and published the rankings on their site.
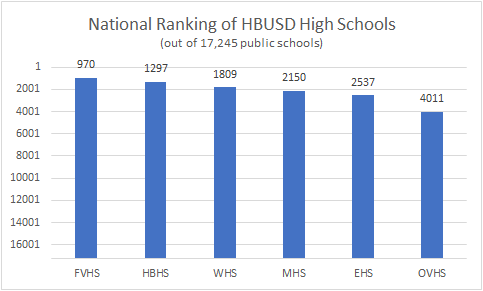
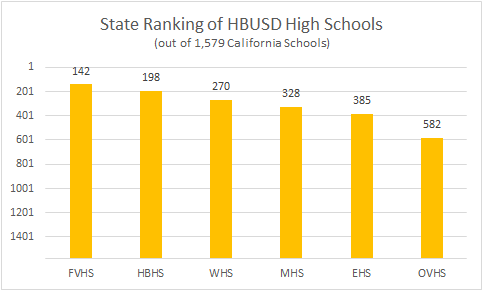
FVHS was ranked highest out of the six comprehensive high schools in the HBUHSD, and was the only HBUHSD school to make it into the top 1,000 schools in the national rankings, at rank 970. FVHS was followed by Huntington Beach High School (HBHS, 1297), Westminster High School (WHS, 1809), Marina High School (MHS, 2150), Edison High School (EHS, 2537) and Ocean View High School (OVHS, 4011). The rankings were also sorted by state, where FVHS and HBHS were the only HBUHSD schools in the top 200 out of 1,579 California schools.
This year, the U.S. News high school rankings were developed based on an evaluation of six weighted indicators of school quality for the 2016-2017 school year. The first two categories were College Readiness (weighted at 30%) and College Curriculum Breadth (10%), which measured participation and passing rates on Advanced Placement (AP) and International Baccalaureate (IB) exams, as well as the proportion of students who took AP and IB exams in multiple content areas.
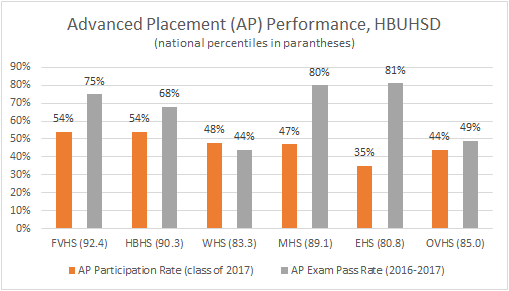
FVHS had the highest national AP performance percentile and tied with HBHS for the highest participation rate, with 54% of the class of 2017 having taken an AP exam at some point during their high school career. The proportion of exams passed at FVHS (75%) was third to EHS (81%) and MHS (80%). FVHS was also highest ranked in the district for College Curriculum Breadth, coming at 887 nationally.
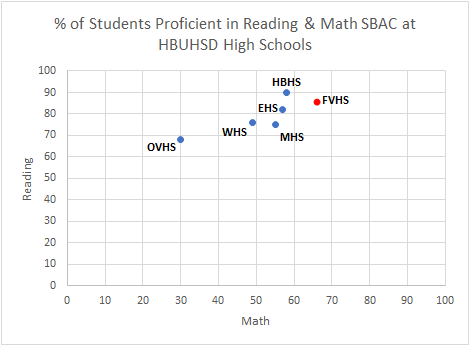
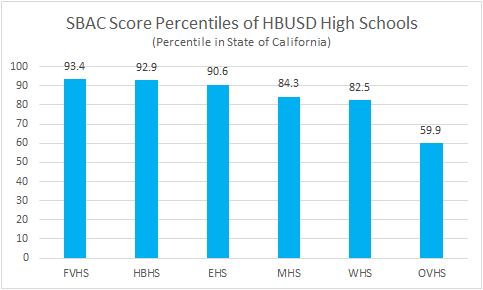
The third ranking category was Math and Reading Proficiency (weighted at 20%), which measured schools’ performance on their state’s standardized testing. FVHS had the highest percent of students who scored Proficient or above on the Mathematics portion of the Smarter Balanced Assessment Consortium (SBAC), at 66% of students. FVHS was second to HBHS in percent proficiency on the SBAC Reading test, with 86% and 90% of students proficient, respectively.
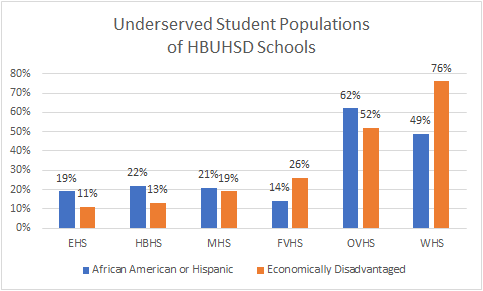
The fourth and fifth categories of school performance involved schools’ populations of “underserved students,” a group consisting of African American, Hispanic and low-income students. Low-income (also referred to as “economically disadvantaged”) students were defined as students eligible for Free or Reduced Lunch programs.
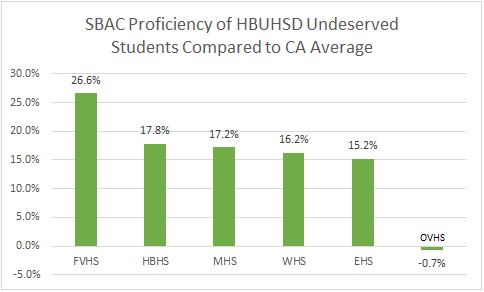
The Math and Reading Performance category (20% weight) evaluated how schools performed on state testing compared to statistical expectations for their performance based on their underserved student populations. FVHS and WHS performed the best of the HBUHSD schools in this category, both being deemed “Well Above Expectations.”
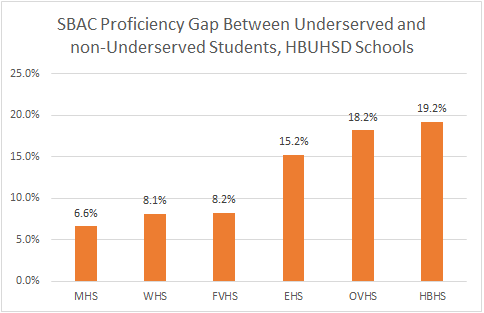
The Underserved Student Performance category (10% weight) measured the performance of schools’ underserved populations in comparison to the performance of non-underserved students.
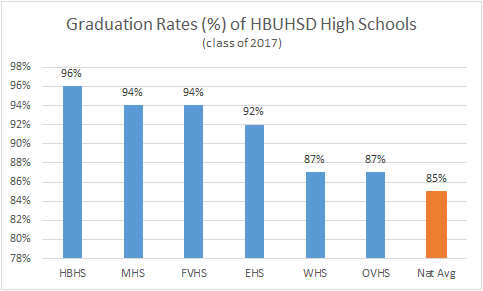
The final category was Graduation Rate (10% weight), which measured the proportion of ninth grade students entering a school in 2012-2013 who graduated in 2016-2017 (adjusted for transfers, emigration and deaths). FVHS (94%) was second in the district to HBHS (96%). All HBUHSD schools were above the national average graduation rate for 2016-2017, which was 84.6%.
The state of California also performed well in the 2019 rankings, with the greatest number of schools (13) in the top 100 ranks. Florida and New York tied for second with 12 schools each in the top 100. In the top 25% of the rankings, however, California was third to Massachusetts and Maryland, which respectively had 48.8% and 43.7% of their eligible schools in the top quartile compared to 40.0% of California’s eligible schools.
This year was the first time that U.S. News used its new ranking methodology, which involves a more inclusive study size (17,245 schools ranked in 2019 compared to 2,700 in 2018) and considers more factors in evaluating schools (six indicators of quality used in 2019, compared to only the use of the College Readiness Index in 2018).
“Scoring schools on all their data versus just some of their data is a more thorough way to assess them,” said U.S. News Chief Data Strategist Robert Morse and U.S. News Senior Data Analyst Eric Brooks. “The revamped methodology will produce more historically comparable results going forward. Specifically, changes in schools’ rankings will increasingly reflect their data because the universes of ranked schools each year will be less fluid.”