Markets
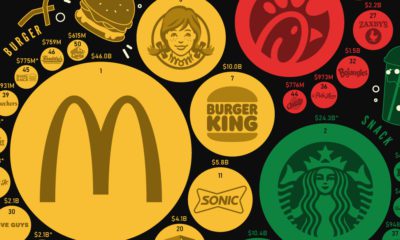
Visualizing America’s Most Popular Fast Food Chains
Article/Editing:
Visualizing America’s Most Popular Fast Food Chains
Fast food is big business in America. From national chains to regional specialties, the industry was worth $331.4 billion as of June 2022.
Which fast food brands are currently dominating this space? This graphic by Truman Du uses data from Quick Service Restaurant (QSR) Magazine to show the most popular fast food chains across America.
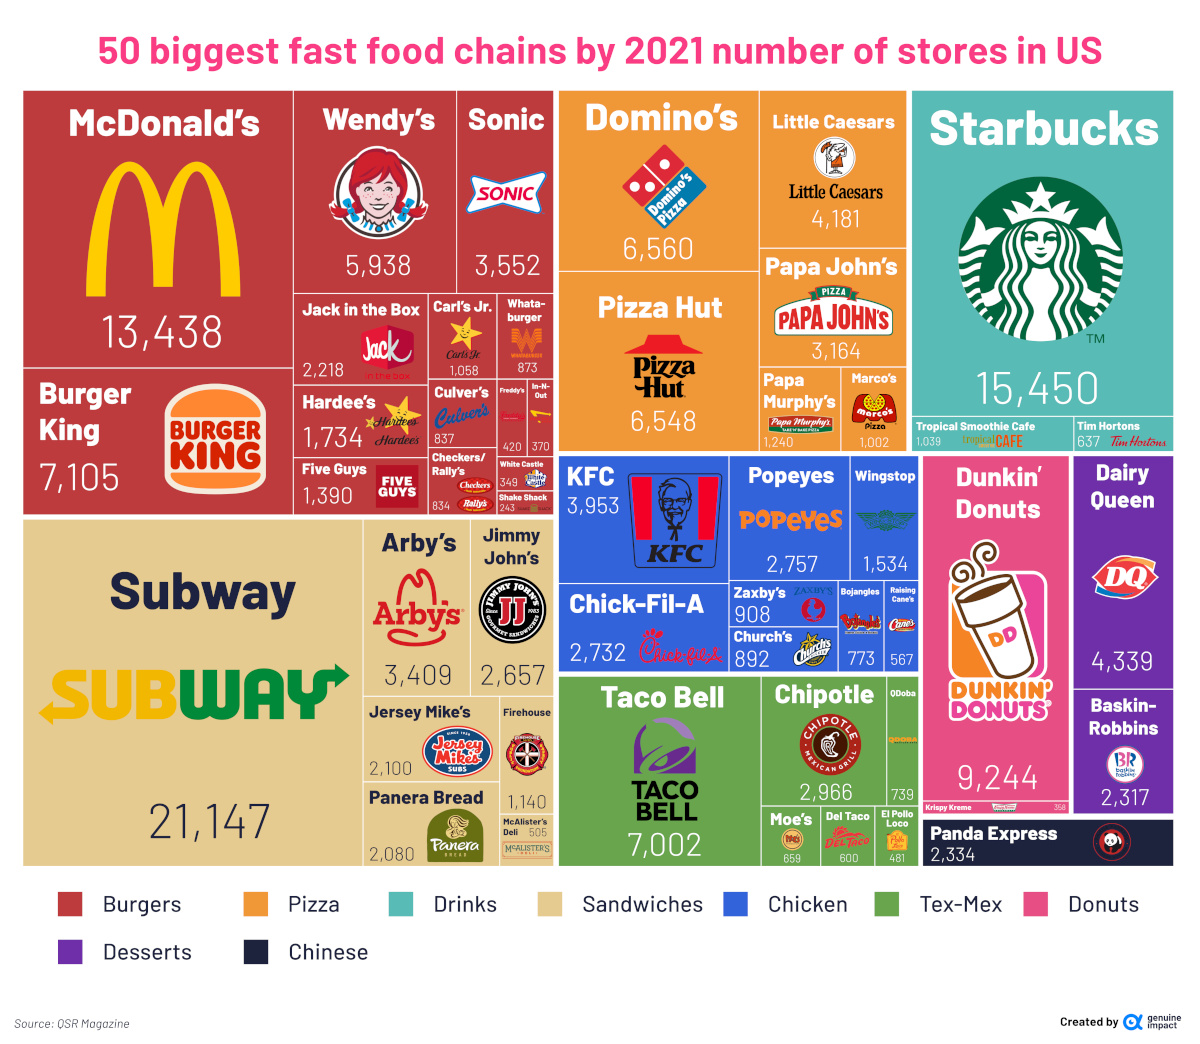
The Most Prevalent Fast Food Chains, by Store Count
Each year, QSR Magazine puts together a report that ranks America’s top 50 fast food chains. It uses a number of metrics to determine this, including total sales (which we’ve covered in a previous article), average-unit volume (AUVs), and growth figures.
For this graphic, Du zoomed in on a specific metric from the report—the number of stores that each fast food chain has across the country. Here are the top 50 chains, and the number of restaurants they each have across America:
| Rank | Brand | Total U.S. Stores (2021) |
|---|---|---|
| 1 | Subway | 21,147 |
| 2 | Starbucks | 15,450 |
| 3 | McDonald's | 13,438 |
| 4 | Dunkin' | 9,244 |
| 5 | Burger King | 7,105 |
| 6 | Taco Bell | 7,002 |
| 7 | Domino's | 6,560 |
| 8 | Pizza Hut | 6,548 |
| 9 | Wendy's | 5,938 |
| 10 | Dairy Queen | 4,339 |
| 11 | Little Caesars | 4,181 |
| 12 | KFC | 3,953 |
| 13 | Sonic Drive-in | 3,552 |
| 14 | Arby's | 3,409 |
| 15 | Papa Johns | 3,164 |
| 16 | Chipotle | 2,966 |
| 17 | Popeyes Louisiana Kitchen | 2,757 |
| 18 | Chick-Fil-A | 2,732 |
| 19 | Jimmy John's | 2,657 |
| 20 | Panda Express | 2,334 |
| 21 | Baskin-Robbins | 2,317 |
| 22 | Jack in the Box | 2,218 |
| 23 | Jersey Mike's | 2,100 |
| 24 | Panera Bread | 2,080 |
| 25 | Hardee's | 1,734 |
| 26 | Wingstop | 1,534 |
| 27 | Five Guys | 1,390 |
| 28 | Papa Murphy's | 1,240 |
| 29 | Firehouse Subs | 1,140 |
| 30 | Carl's Jr. | 1,058 |
| 31 | Tropical Smoothie Café | 1,039 |
| 32 | Marco's Pizza | 1,002 |
| 33 | Zaxby's | 908 |
| 34 | Church's Chicken | 892 |
| 35 | Whataburger | 873 |
| 36 | Culver's | 837 |
| 37 | Checkers / Rally's | 834 |
| 38 | Bojangles | 773 |
| 39 | Qdoba | 739 |
| 40 | Moe's | 659 |
| 41 | Tim Hortons | 637 |
| 42 | Del Taco | 600 |
| 43 | Raising Cane's | 567 |
| 44 | McAlister's Deli | 505 |
| 45 | El Pollo Loco | 481 |
| 46 | Freddy's Frozen Custard & Steakburgers | 420 |
| 47 | In-N-Out Burger | 370 |
| 48 | Krispy Kreme | 358 |
| 49 | White Castle | 349 |
| 50 | Shake Shack | 243 |
Subway takes first place with over 20,000 restaurants across the country—that’s more stores than all the other sandwich chains on the list put together.
Subway’s popularity is reflected in its sales figures, as well—in 2021, Subway generated about $9.4 billion in sales, about double its closest rival Arby’s.
Second on the list is Starbucks, with more than 15,000 stores across America. Despite a rough 2020, the coffee chain managed to turn things around in 2021, making more than $24 billion in sales that year.
The iconic burger joint McDonald’s comes in third, with more than 13,000 restaurants across the country. While the restaurant has fewer stores than Starbucks and Subway, it generated $46 billion in 2021 sales, which is more than Subway and Starbucks combined.
The “Stay in Your Lane” Curse
As the report shows, quick service restaurants are a popular dining option across America, and the successful ones have the potential to generate billions of dollars each year.
However, QSRs are not without their struggles. One difficulty facing fast food chains is the fact they’re often siloed into specific verticals—once a QSR establishes its niche, it can be difficult for that chain to branch out and successfully launch different menu items.
Take McDonald’s McPizza for example, which was launched in the mid 1980s and tested for a decade or so before being widely discontinued by 2000. Various factors contributed to its demise, but one major issue was the pizza’s relatively long cook-time of sixteen minutes.
Innovation in the Fast Food Industry
While fast food restaurants may have difficulty diversifying their menus, there’s still tons of innovation happening in the industry, especially when it comes to optimizing service and cutting wait times for customers.
For example, Starbucks’ mobile order and pay service, which allows customers to order from their phone, has grown 400% over the last five years. And in 2021, the McDonald’s app was downloaded 24 million times.
It’ll be interesting to see what changes in the next decade, as fast food companies continue to invest in their digital offers and tech support.

This article was published as a part of Visual Capitalist's Creator Program, which features data-driven visuals from some of our favorite Creators around the world.


United States
The World’s Largest Economies: Comparing the U.S. and China
How do the world’s two largest economies compare? We look at the economies of U.S. and China across GDP, stock markets, and FDI.
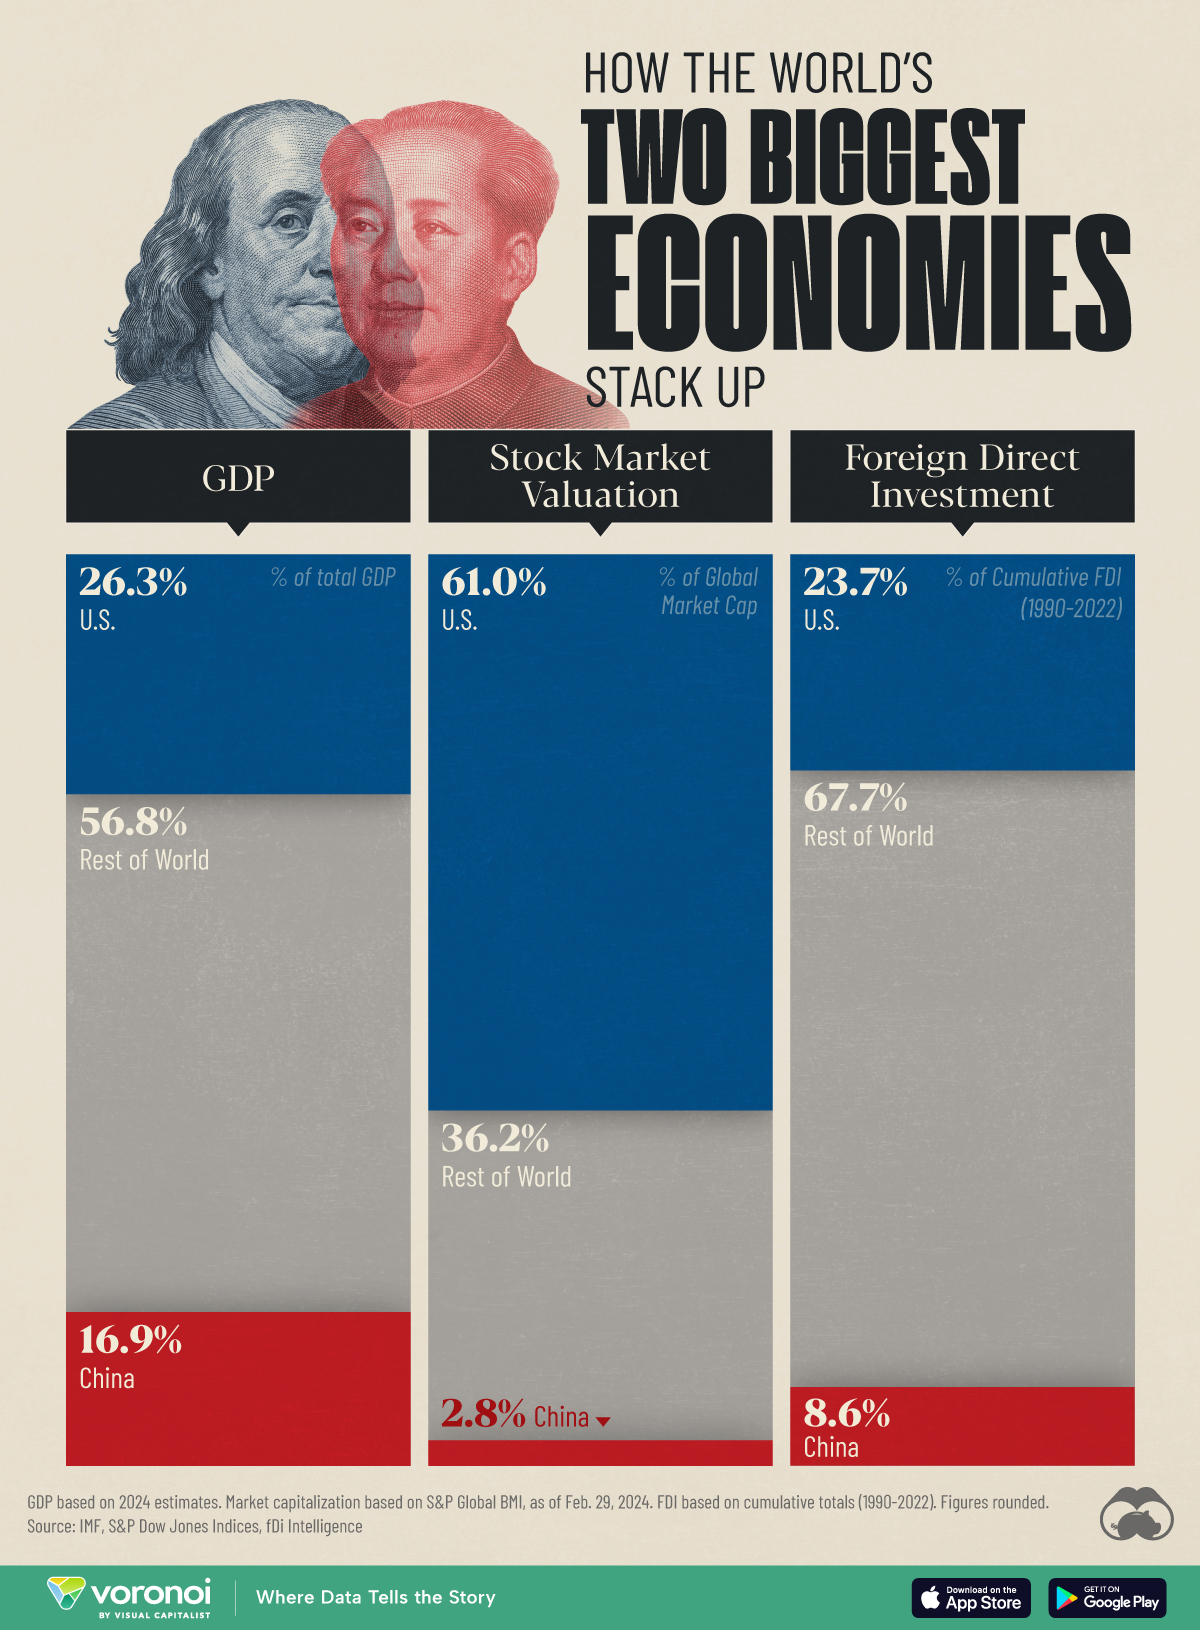

Comparing the Economies of U.S. and China in 3 Key Metrics
This was originally posted on our Voronoi app. Download the app for free on iOS or Android and discover incredible data-driven charts from a variety of trusted sources.
In this graphic, we provide insight into the world’s two biggest economies by comparing them across three key metrics: GDP, equity market valuation, and foreign direct investment (FDI).
Starting with GDP, we used 2024 estimates from the latest edition of the IMF’s World Economic Outlook (April 2024):
| Country | GDP (% of total) | GDP (USD billions) |
|---|---|---|
| 🇺🇸 U.S. | 26.3 | $28,780 |
| 🇨🇳 China | 16.9 | $18,530 |
| 🌍 Rest of World | 56.8 | $62,220 |
Based on these figures, the United States and China combine for a massive 43.2% share of the global economy.
It’s also interesting to note that America’s share of global GDP has actually been increasing in recent years, from a low of 21.1% in 2011. This is partly due to its relatively strong recovery from the COVID-19 pandemic.
Equity Market Valuation
The U.S. dominates when it comes to stock market valuation, accounting for 61% of the global total as of Feb. 29, 2024. These figures are based on each country’s share of the S&P Global BMI, which is a broad coverage index, including large, mid, and small-cap stocks from developed and emerging markets.
| Country | % of Global Market Cap |
|---|---|
| 🇺🇸 U.S. | 61.0 |
| 🇨🇳 China | 2.8 |
| 🌍 Rest of World | 36.2 |
The massive disparity in equity market valuations between the U.S. and China is a result of differences in many factors, including market maturity, corporate governance, and international participation.
In terms of country rankings within the S&P Global BMI, China is the fourth largest (behind Japan and the UK).
Foreign Direct Investment
FDI is an investment made by a firm or individual in one country into business interests located in another country. This type of investment can be very beneficial because it can create jobs and enhance economic growth. The FDI figures in this graphic were sourced from fDi Intelligence, and represent cumulative FDI stock from 1990 to 2022.
| Country | % of Global FDI | FDI (current USD) |
|---|---|---|
| 🇺🇸 U.S. | 23.7 | $10.5T |
| 🇨🇳 China | 8.6 | $3.8T |
| 🌍 Rest of World | 67.7 | $30.0T |
The U.S. and China are first and second in terms of cumulative FDI stock. Attracting FDI is one area where China has performed very strongly in recent years.
For example, in 2012, China had attracted $950 billion in FDI, good enough for sixth place. As of 2022, China’s total had grown to $3.8 trillion, a testament to its attractiveness to global businesses, even in the face of regulatory challenges and geopolitical tensions.
Learn More About the Global Economy From Visual Capitalist
If you enjoyed this graphic, check out this graphic ranking the world’s biggest stock markets by country.

-

 Best of6 days ago
Best Visualizations of May on the Voronoi App
-

 Maps2 weeks ago
Mapped: Indian States with Cities Over 1 Million People
-
 Technology2 weeks ago
Ranked: The Top Startup Cities Around the World
-
 Markets2 weeks ago
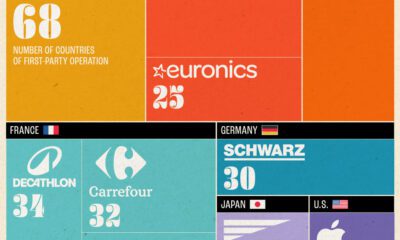
Which Retailers Operate in the Most Countries?
-
 Personal Finance2 weeks ago
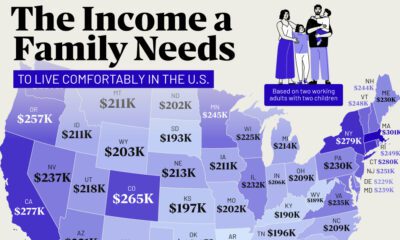
Mapped: The Income a Family Needs to Live Comfortably in Every U.S. State
-

 Energy2 weeks ago
Ranked: The World’s Largest Lithium Producers in 2023
-
 Maps2 weeks ago
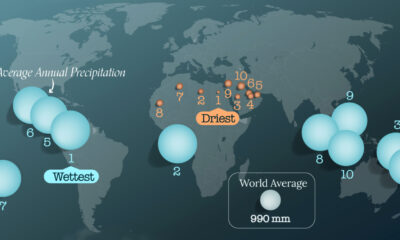
Mapped: The World’s Wettest and Driest Countries
-
 Healthcare2 weeks ago
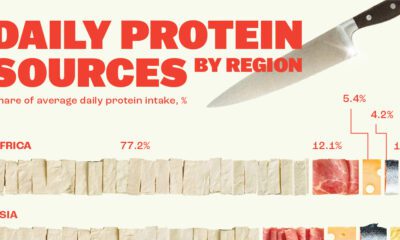
Visualizing Daily Protein Sources by Region