What Is The Santa Claus Rally?
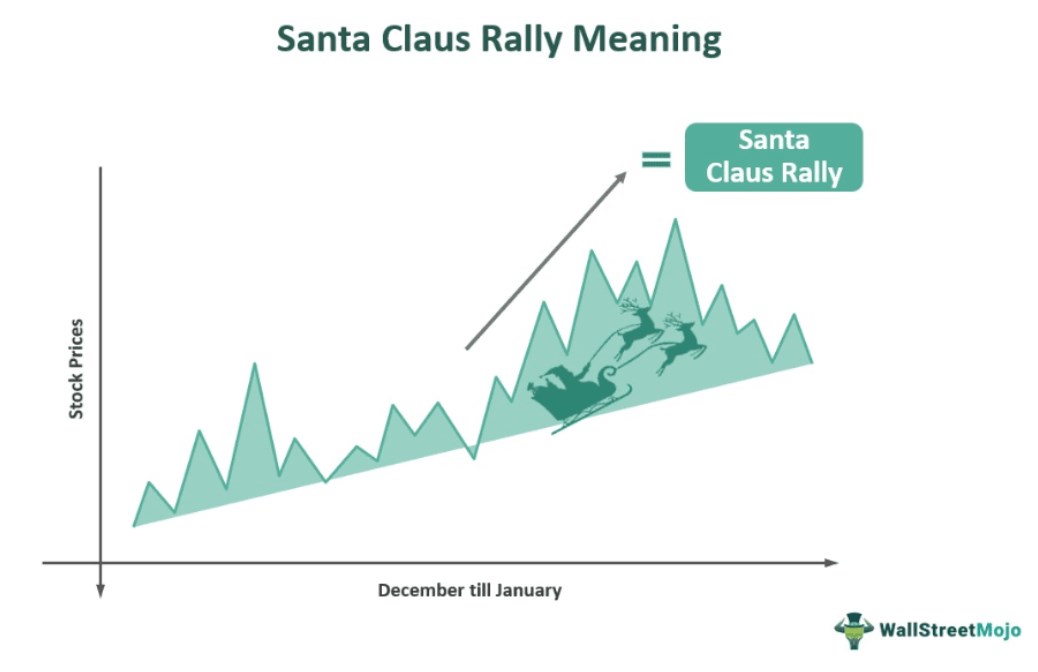
Santa Claus Rally is a common phrase used to determine the rise in stock market prices from the end of December until the New Year. The prime intention of this rally is to pump the equity prices during the Christmas season.
You are free to use this image on your website, templates, etc, Please provide us with an attribution linkHow to Provide Attribution?Article Link to be Hyperlinked
For eg:
Source: Santa Claus Rally (wallstreetmojo.com)
Retail investors benefit a lot from this rally. They avail the chance of book profits in these sessions. In addition, it also boosts the market sentiments to deliver a positive trend. However, no analyst or investor can predict whether a Santa Claus stock market rally will occur in a particular year. Moreover, institutional investors, such as mutual funds and pension funds, may make portfolio adjustments toward the end of the year.
Table of contents
Key Takeaways
- Santa Claus Rally is a phenomenon in the stock markets that witnesses a sudden rise in stock prices from the last week of December to the first two days of January.
- The origins of this rally are visible in the paper “The Journal of the Business of the University of Chicago “by author Sidney B. Wachtel in 1942.
- However, in 1972, Yale Hirsch was the first to coin this word in the book “The Stock Trader’s Almanac.” It included Dow Jones, S&P 500, and NASDAQ indices.
Santa Claus Rally Explained
Santa Claus rally refers to an event that enables the market to rise from the last week of December to the first two business days of January. Therefore, the Santa Claus rally dates for approximately a week or more. However, there is no guarantee for the number of days this rally might last.
The first mention of the Santa Claus rally dates back to the 1970s by author Yale Hirsch. In the book “The Stock Trader’s Almanac,” Hirsch described the word in 1972. Like Santa Claus arrives during Christmas and delivers gifts, similar events occur in the equity market. Hence, the equity traders witness a sudden surge in stock prices, creating a bullish position. Thus, investors tend to invest more during this session. Plus, public firms receive additional capital and positive sentiments for their stocks.
On the contrary, there can be various reasons for the Santa Claus rally to occur. Let us look at them:
- All institutional investors tend to relax and avoid trading during this period. As a result, the retail investors grab this opportunity to create a bullish pattern. Also, there is relatively less volume to create an upward trend.
- Investors try to purchase stocks as a preparation for the January Effect. Typically, traders in this effect assume prices rise higher than the rest of the year. Thus, they tend to hoard shares to sell at a higher price in the New Year.
- As traders adopt the tax-loss harvesting strategy, the prices drop at the start of December. They will sell the loss-making investments for tax benefit. So, once the deadline (December 31) passes, the investors will regain confidence and invest.
- A sense of positivity and optimism was created within the market for a rising graph.
Financial Modeling & Valuation Courses Bundle (25+ Hours Video Series)
–>> If you want to learn Financial Modeling & Valuation professionally , then do check this Financial Modeling & Valuation Course Bundle (25+ hours of video tutorials with step by step McDonald’s Financial Model). Unlock the art of financial modeling and valuation with a comprehensive course covering McDonald’s forecast methodologies, advanced valuation techniques, and financial statements.
History
Let us look at the history of the Santa Claus rally that has evolved from the 20th century:
The Early 1900s
Although the term’s usage was visible in 1972, the history of the Santa Claus rally dates back to the early 1900s. In 1942, author Sidney B. Wachtel presented the analysis in “The Journal of the Business of the University of Chicago.” This journal studied the analysis of fluctuations in stock prices between December to January. Wachtel used the Dow Jones Industrial Average (DJIA) to study the effect from 1927 to 1942.
1940s To 1970s
Later 1972, Yale Hirsch coined this word for a similar effect in the book “The Stock Trader’s Almanac.” Since Yale Hirsch published the first edition in 1968, a different trend has been noticed. Earlier, the market used to rise before the holidays and witness a sell-off situation. At that time, an average Santa Claus yearly rally lasted eight days. However, the trend has changed since then.
The major indices were the DJIA, S&P 500, and the Zweig Unweighted Price Index. Since 1969, the monthly average Santa Claus rally gain on the S&P 500 has been 1.7%. Likewise, in 1950, the Dow Jones saw a rise of 1.8%. In contrast, the Nasdaq realized the highest gain of 2.1% in 1971. Hence, the stock market gains follow the same rally to the present.
Examples
Let us look at the examples of the Santa Claus rally to understand the concept better:
Example #1
Suppose December approached and the holiday season unfolded, the stock market began to take on the familiar hue of a Santa Claus Rally. Investors, filled with holiday cheer, seemed more willing to take on risk. Hence, favorable economic indicators bolstered confidence, such as solid consumer spending and upbeat employment data. Institutional investors, eager to put their portfolios in the best possible light for year-end reports, engaged in window dressing, accumulating shares of high-performing companies.
With many traders away on vacation, trading volumes dwindled, creating an environment where even modest buying activity had an outsized impact on stock prices. The rally commenced around mid-December, and as Christmas drew near, major indices like the S&P 500 and the Nasdaq showed a steady upward trajectory. Moreover, the optimism extended into the first trading days of January, with investors ringing in the New Year with broad smiles as market indices reached new highs.
Example #2
According to the article dated during Christmas, no Santa Claus rally was visible in December 2022. It occurred due to the recession phase causing excessive selling within the U.S. (United States) stock market. As equities close out a gloomy 2022, no Santa Claus surge is in sight. Because most businesses will be closed until the following year, the earnings and economic calendars need to be stronger.
Traders will receive readings on wholesale and retail inventories, weekly unemployment claims, and the most recent S&P CoreLogic Case-Shiller home price index while working during the holiday season.
There may be little upside for equities investors, given that monetary officials worldwide have stated that they would keep tightening financial conditions in the upcoming year until price stability is firmly restored.
Chart
Let us look at the chart that represents the Santa Claus rally by year change:

You are free to use this image on your website, templates, etc, Please provide us with an attribution linkHow to Provide Attribution?Article Link to be Hyperlinked
For eg:
Source: Santa Claus Rally (wallstreetmojo.com)
The chart above depicts the Santa Claus rally between the last week of December and the New Year. December 23, 2022, marked the first day of the time that is generally highlighted by the so-called Santa Claus bounce, and stocks were clinging onto marginal gains in turbulent, lackluster activity.
Since 1950, the S&P 500 has traded up 78% of the time during the Santa rally period, on average gaining 1.32%, according to Dow Jones Market Data (see chart above).
The Dow Jones Industrial Average has increased by 1.38% on average over the holiday season and has done so 79% of the time since 1950.
Frequently Asked Questions (FAQs)
There can be various influences of this rally on the equity market. However, some effects have been visible since its origin. Let us look at them:
– The trend might be bullish for more days if the market sentiments are positive.
– On the contrary, the market might make a correction or trend reversal.
– There might be either a consolidation or a meltdown in the stock market.
Since the 1950s, these rallies have occurred in the stock market. Before the Christmas holidays, it starts and ends by the New Year. On average, it occurs for approximately 78%. But, there are instances where there was no rally noticed.
Over the past few decades, the return for this rally has fluctuated. However, it always stays within a specific range to avoid extreme volatility. For example, in 2021-2022, the S&P 500 return was 0.7% more than in 2020-2021.
Recommended Articles
This article has been a guide to what is Santa Claus Rally. Here, we explain the topic in detail, including its history, chart, and examples. You may also find some useful articles here –

Leave a Reply