Markets
All of the World’s Wealth in One Visualization
All of the World’s Wealth in One Visualization
The financial concept of wealth is broad, and it can take many forms.
While your wealth is most likely driven by the dollars in your bank account and the value of your stock portfolio and house, wealth also includes a number of smaller things as well, such as the old furniture in your garage or a painting on the wall.
From the macro perspective of a country, wealth is even more all-encompassing — it’s not just about the assets held by private households or businesses, but also those owned by the public. What is the value of a new toll bridge, or an aging nuclear power plant?
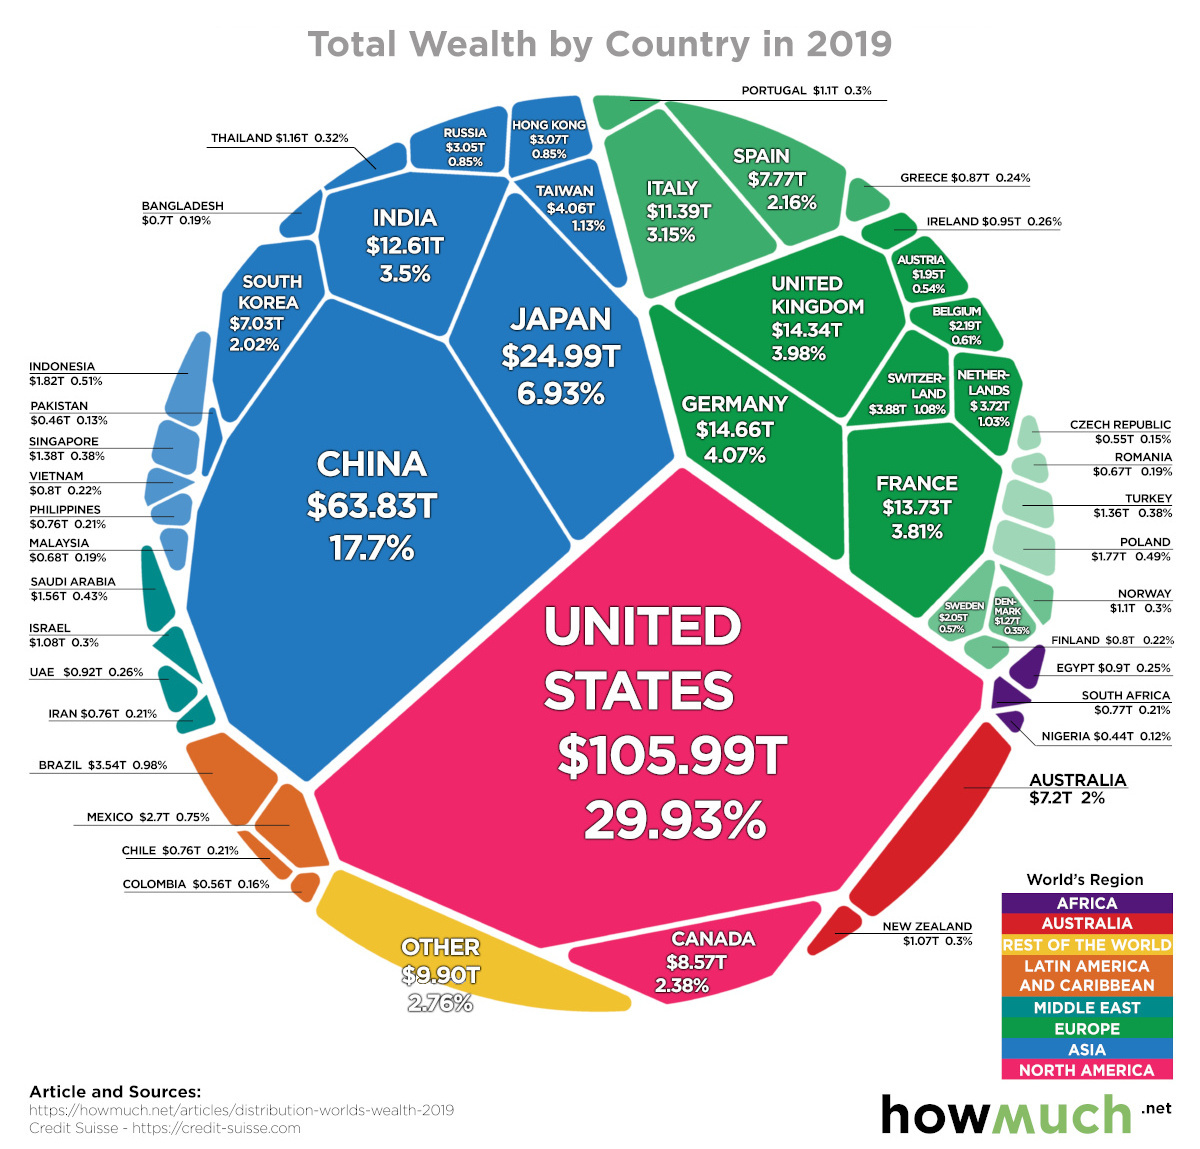
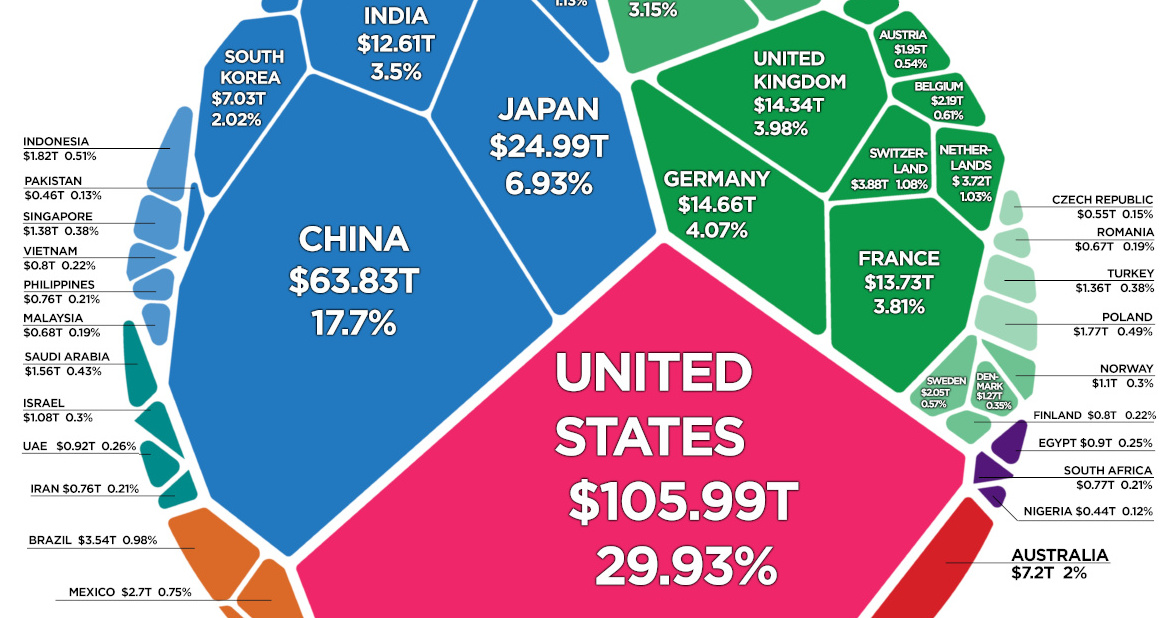
Today’s visualization comes to us from HowMuch.net, and it shows all of the world’s wealth in one place, sorted by country.
Total Wealth by Region
In 2019, total world wealth grew by $9.1 trillion to $360.6 trillion, which amounts to a 2.6% increase over the previous year.
Here’s how that divvies up between major global regions:
| Region | Total Wealth ($B, 2019) | % Global Share |
|---|---|---|
| North America | $114,607 | 31.8% |
| Europe | $90,752 | 25.2% |
| Asia-Pacific | $64,778 | 18.0% |
| China | $63,827 | 17.7% |
| India | $12,614 | 3.5% |
| Latin America | $9,906 | 2.7% |
| Africa | $4,119 | 1.1% |
| World | $360,603 | 100.0% |
Last year, growth in global wealth exceeded that of the population, incrementally increasing wealth per adult to $70,850, a 1.2% bump and an all-time high.
That said, it’s worth mentioning that Credit Suisse, the authors of the Global Wealth Report 2019 and the source of all this data, notes that the 1.2% increase has not been adjusted for inflation.
Ranking Countries by Total Wealth
Which countries are the richest?
Let’s take a look at the 15 countries that hold the most wealth, according to Credit Suisse:
| Rank | Country | Region | Total Wealth ($B, 2019) | % Global Share |
|---|---|---|---|---|
| #1 | 🇺🇸 United States | North America | $105,990 | 29.4% |
| #2 | 🇨🇳 China | China | $63,827 | 17.7% |
| #3 | 🇯🇵 Japan | Asia-Pacific | $24,992 | 6.9% |
| #4 | 🇩🇪 Germany | Europe | $14,660 | 4.1% |
| #5 | 🇬🇧 United Kingdom | Europe | $14,341 | 4.0% |
| #6 | 🇫🇷 France | Europe | $13,729 | 3.8% |
| #7 | 🇮🇳 India | India | $12,614 | 3.5% |
| #8 | 🇮🇹 Italy | Europe | $11,358 | 3.1% |
| #9 | 🇨🇦 Canada | North America | $8,573 | 2.4% |
| #10 | 🇪🇸 Spain | Europe | $7,772 | 2.2% |
| #11 | 🇰🇷 South Korea | Asia-Pacific | $7,302 | 2.0% |
| #12 | 🇦🇺 Australia | Asia-Pacific | $7,202 | 2.0% |
| #13 | 🇹🇼 Taiwan | Asia-Pacific | $4,062 | 1.1% |
| #14 | 🇨🇭 Switzerland | Europe | $3,877 | 1.1% |
| #15 | 🇳🇱 Netherlands | Europe | $3,719 | 1.0% |
| All Other Countries | $56,585 | 15.7% | ||
| Global Total | $360,603 | 100.0% |
The 15 wealthiest nations combine for 84.3% of global wealth.
Leading the pack is the United States, which holds $106.0 trillion of the world’s wealth — equal to a 29.4% share of the global total. Interestingly, the United States economy makes up 23.9% of the size of the world economy in comparison.
Behind the U.S. is China, the only other country with a double-digit share of global wealth, equal to 17.7% of wealth or $63.8 trillion. As the country continues to build out its middle class, one estimate sees Chinese private wealth increasing by 119.5% over the next decade.
Impressively, the combined wealth of the U.S. and China is more than the next 13 countries in aggregate — and almost equal to half of the global wealth total.


Markets
What History Reveals About Interest Rate Cuts
How have previous cycles of interest rate cuts in the U.S. impacted the economy and financial markets?
What History Reveals About Interest Rate Cuts
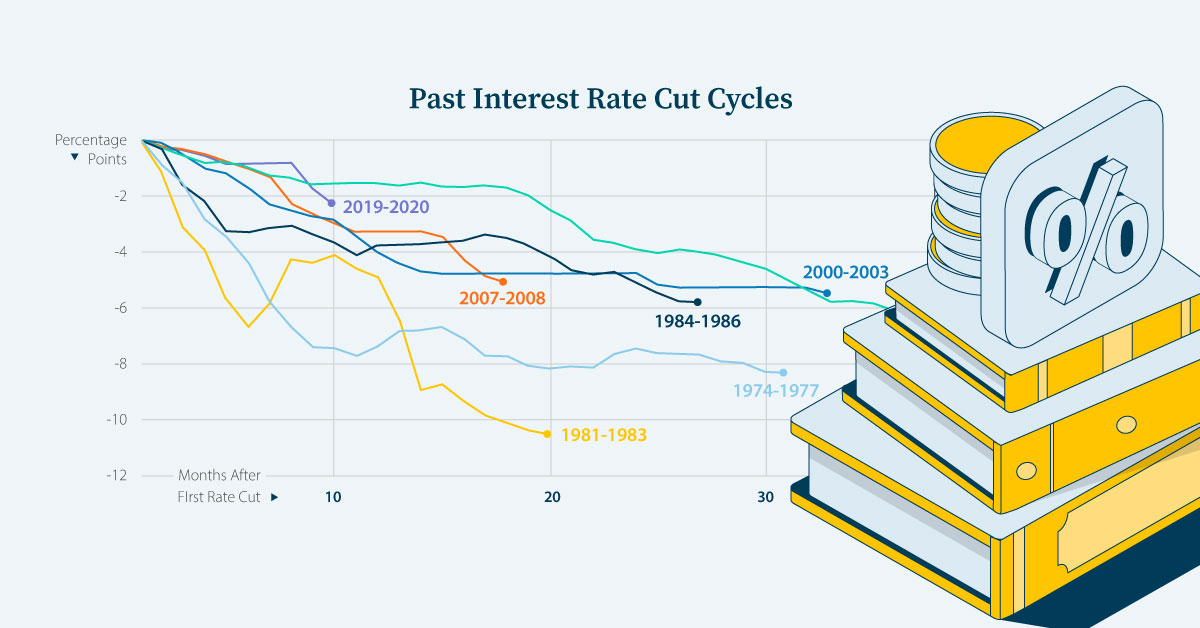
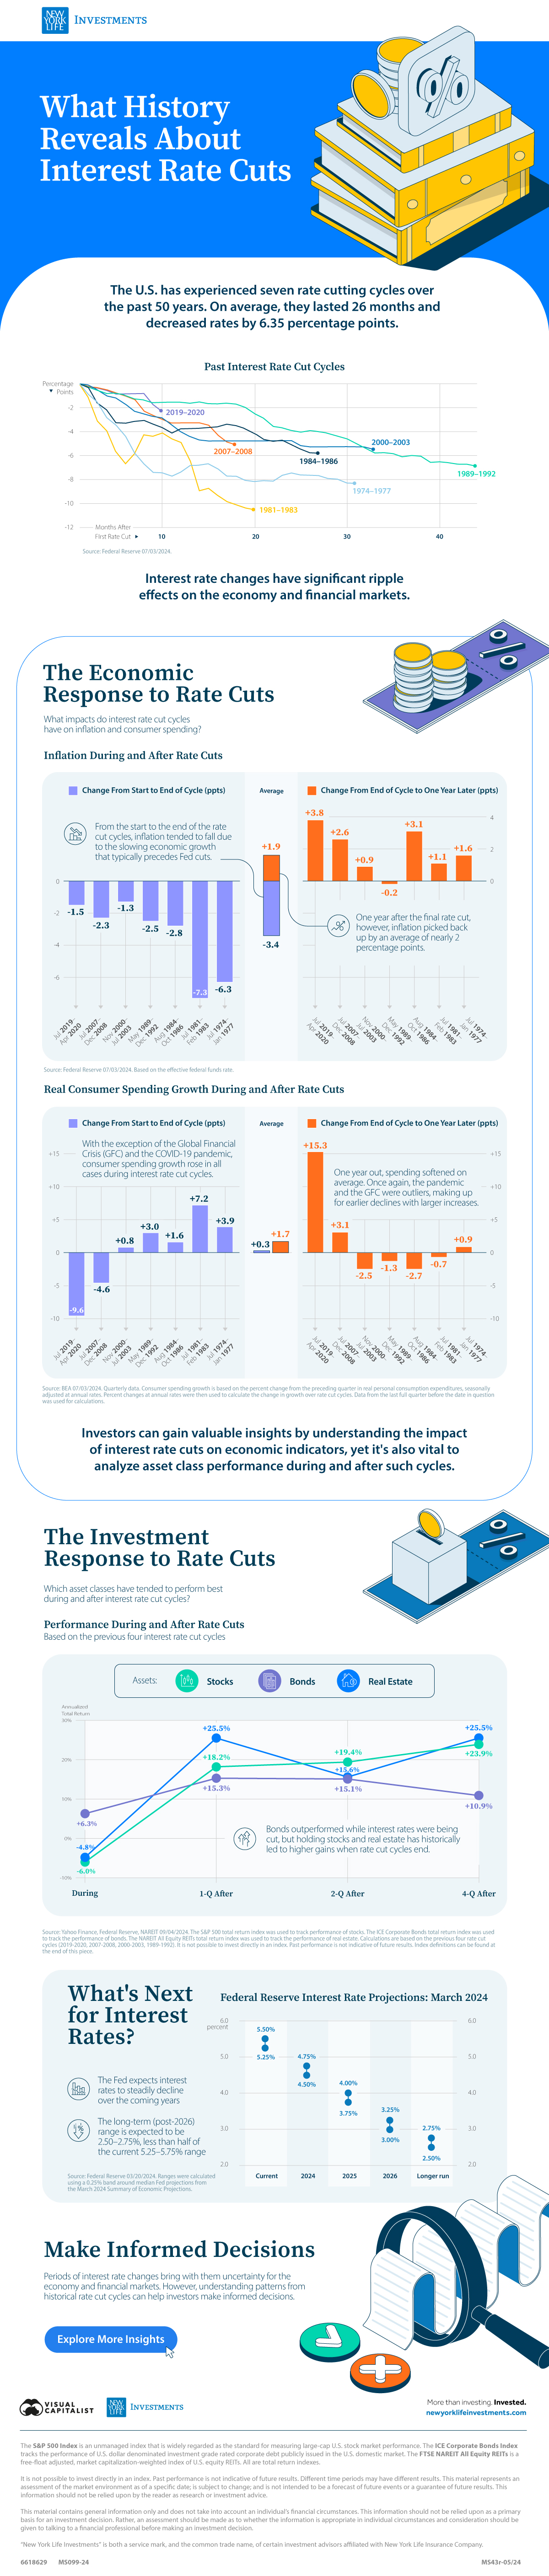
The Federal Reserve has overseen seven cycles of interest rate cuts, averaging 26 months and 6.35 percentage points (ppts) each.
We’ve partnered with New York Life Investments to examine the impact of interest rate cut cycles on the economy and on the performance of financial assets in the U.S. to help keep investors informed.
A Brief History of Interest Rate Cuts
Interest rates are a powerful tool that the central bank can use to spur economic activity.
Typically, when the economy experiences a slowdown or a recession, the Federal Reserve will respond by cutting interest rates. As a result, each of the previous seven rate cut cycles—shown in the table below—occurred during or around U.S. recessions, according to data from the Federal Reserve.
| Interest Rate Cut Cycle | Magnitude (ppts) |
|---|---|
| July 2019–April 2020 | -2.4 |
| July 2007–December 2008 | -5.1 |
| November 2000–July 2003 | -5.5 |
| May 1989–December 1992 | -6.9 |
| August 1984–October 1986 | -5.8 |
| July 1981–February 1983 | -10.5 |
| July 1974–January 1977 | -8.3 |
| Average | -6.4 |
Source: Federal Reserve 07/03/2024
Understanding past economic and financial impacts of interest rate cuts can help investors prepare for future monetary policy changes.
The Economic Response: Inflation
During past cycles, data from the Federal Reserve, shows that, on average, the inflation rate continued to decline throughout (-3.4 percentage points), largely due to the lagged effects of a slower economy that normally precedes interest rate declines.
| Cycle | Start to end change (ppts) | End to one year later (ppts) |
|---|---|---|
| July 2019–April 2020 | -1.5 | +3.8 |
| July 2007–December 2008 | -2.3 | +2.6 |
| November 2000–July 2003 | -1.3 | +0.9 |
| May 1989–December 1992 | -2.5 | -0.2 |
| August 1984–October 1986 | -2.8 | +3.1 |
| July 1981–February 1983 | -7.3 | +1.1 |
| July 1974–January 1977 | -6.3 | +1.6 |
| Average | -3.4 | +1.9 |
Source: Federal Reserve 07/03/2024. Based on the effective federal funds rate. Calculations are based on the previous four rate cut cycles (2019-2020, 2007-2008, 2000-2003, 1989-1992, 1984-1986, 1981-1983, 1974-1977).
However, inflation played catch-up and rose by +1.9 percentage points one year after the final rate cut. With lower interest rates, consumers were incentivized to spend more and save less, which led to an uptick in the price of goods and services in six of the past seven cycles.
The Economic Response: Real Consumer Spending Growth
Real consumer spending growth, as measured by the Bureau of Economic Analysis, typically reacted to rate cuts more quickly.
On average, consumption growth rose slightly during the rate cut periods (+0.3 percentage points) and that increase accelerated one year later (+1.7 percentage points).
| Cycle | Start to end (ppts) | End to one year later (ppts) |
|---|---|---|
| July 2019–April 2020 | -9.6 | +15.3 |
| July 2007–December 2008 | -4.6 | +3.1 |
| November 2000–July 2003 | +0.8 | -2.5 |
| May 1989–December 1992 | +3.0 | -1.3 |
| August 1984–October 1986 | +1.6 | -2.7 |
| July 1981–February 1983 | +7.2 | -0.7 |
| July 1974–January 1977 | +3.9 | +0.9 |
| Average | +0.3 | +1.7 |
Source: BEA 07/03/2024. Quarterly data. Consumer spending growth is based on the percent change from the preceding quarter in real personal consumption expenditures, seasonally adjusted at annual rates. Percent changes at annual rates were then used to calculate the change in growth over rate cut cycles. Data from the last full quarter before the date in question was used for calculations. Calculations are based on the previous four rate cut cycles (2019-2020, 2007-2008, 2000-2003, 1989-1992, 1984-1986, 1981-1983, 1974-1977).
The COVID-19 pandemic and the Global Financial Crisis were outliers. Spending continued to fall during the rate cut cycles but picked up one year later.
The Investment Response: Stocks, Bonds, and Real Estate
Historically, the trend in financial asset performance differed between stocks, bonds, and real estate both during and after interest rate declines.
Stocks and real estate posted negative returns during the cutting phases, with stocks taking the bigger hit. Conversely, bonds, a traditional safe haven, gained ground.
| Asset | During (%) | 1 Quarter After (%) | 2 Quarters After (%) | 4 Quarters After (%) |
|---|---|---|---|---|
| Stocks | -6.0 | +18.2 | +19.4 | +23.9 |
| Bonds | +6.3 | +15.3 | +15.1 | +10.9 |
| Real Estate | -4.8 | +25.5 | +15.6 | +25.5 |
Source: Yahoo Finance, Federal Reserve, NAREIT 09/04/2024. The S&P 500 total return index was used to track performance of stocks. The ICE Corporate Bonds total return index was used to track the performance of bonds. The NAREIT All Equity REITs total return index was used to track the performance of real estate. Calculations are based on the previous four rate cut cycles (2019-2020, 2007-2008, 2000-2003, 1989-1992). It is not possible to invest directly in an index. Past performance is not indicative of future results. Index definitions can be found at the end of this piece.
However, in the quarters preceding the last rate cut, all three assets increased in value. One year later, real estate had the highest average performance, followed closely by stocks, with bonds coming in third.
What’s Next for Interest Rates
In March 2024, the Federal Reserve released its Summary of Economic Projections outlining its expectation that U.S. interest rates will fall steadily in 2024 and beyond.
| Year | Range (%) | Median (%) |
|---|---|---|
| Current | 5.25-5.50 | 5.375 |
| 2024 | 4.50-4.75 | 4.625 |
| 2025 | 3.75-4.0 | 3.875 |
| 2026 | 3.00-3.25 | 3.125 |
| Longer run | 2.50-2.75 | 2.625 |
Source: Federal Reserve 20/03/2024
Though the timing of interest rate cuts is uncertain, being armed with the knowledge of their impact on the economy and financial markets can provide valuable insight to investors.
Explore more insights from New York Life Investments.

-

 Markets2 days ago
Which Retailers Operate in the Most Countries?
From fast-fashion giant H&M to Apple, we show the top retailers globally with the largest international presence.
-

 Maps1 week ago
Mapped: The 10 U.S. States With the Lowest Real GDP Growth
In this graphic, we show where real GDP lagged the most across America in 2023 as high interest rates weighed on state economies.
-

 Venture Capital1 week ago
Ranked: The World’s 50 Largest Private Equity Firms
In this graphic, we show the largest private equity firms in the world—from titan Blackstone to China’s leading alternative funds.
-

 Debt1 week ago
Top 10 Countries Most in Debt to the IMF
Argentina tops the ranking, with a debt equivalent to 5.3% of the country’s GDP.
-

 Markets1 week ago
Ranked: The Top 6 Economies by Share of Global GDP (1980-2024)
Gain a unique perspective on the world’s economic order from this graphic showing % share of global GDP over time.
-

 Economy2 weeks ago
Mapped: Europe’s GDP Per Capita, by Country
Which European economies are richest on a GDP per capita basis? This map shows the results for 44 countries across the continent.

-
 Money1 week ago
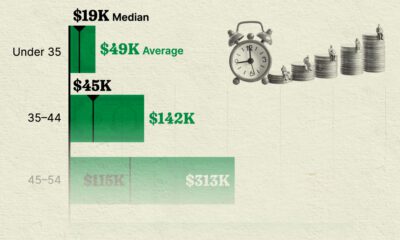
Visualizing America’s Average Retirement Savings, by Age
-

 Economy2 weeks ago
Visualizing the Tax Burden of Every U.S. State
-

 Automotive2 weeks ago
How People Get Around in America, Europe, and Asia
-

 Economy2 weeks ago
Mapped: Southeast Asia’s GDP Per Capita, by Country
-

 Demographics2 weeks ago
Mapped: U.S. Immigrants by Region
-

 Healthcare2 weeks ago
Which Countries Have the Highest Infant Mortality Rates?
-

 Misc2 weeks ago
Charted: How Americans Feel About Federal Government Agencies
-

 Mining2 weeks ago
Visualizing Copper Production by Country in 2023