


Like most websites, we use own and third party cookies for analytical purposes and to show you personalised advertising or based on your browsing habits.
Generally, the information does not directly identify you, but can provide you with a more personalised web experience. Because we respect your right to privacy, you may choose not to allow us to use certain cookies. However, blocking some types of cookies may affect your experience on the site and the services we can offer.
For more information, you can read our cookie policy.
Metricool, A Free Facebook Analytics Software Tool
Facebook is one of the largest social networks with the most recurring active users. Therefore, it’s essential in any social media strategy for a business or brand. If you have decided to launch and follow a content strategy on this social platform, it is crucial to monitor your actions through the stats. However, trying to organize all the Facebook analytics and metrics can seem daunting.
But, with Metricool, you can now analyze all your Facebook page analytics, for free. Yes, you heard that right! So start analyzing your account and all the content you publish from now on, for FREE with Metricool. Read below on how you can integrate this into your social strategy.
If you haven’t yet started your strategy and want to start designing one from scratch, this is your article:
Metricool’s Free Facebook Analytics Tool
Welcome to Metricool, an all-in-one social media management tool that allows you to schedule and auto-publish content, view how your content is performing, manage your social media messages, run campaigns, and create link-in-bio pages all in one.
If you haven’t done so already, we encourage you to create your Metricool account. It’s completely free, with no trial period, so you can use your free account for life.
Once you have your account, you can connect your social media profiles. To do this, you must have, and be the admin of a Facebook business page.
Then if you head to the Analytics section of Metricool, you will see each social network has its analytics section. At the very top, you will see a Summary page with analytics of each of your connected social profiles with information on your followers, impressions, interactions, campaigns, and top-performing posts across all your profiles.
To view Facebook analytics independently, click on the Facebook analytics section!
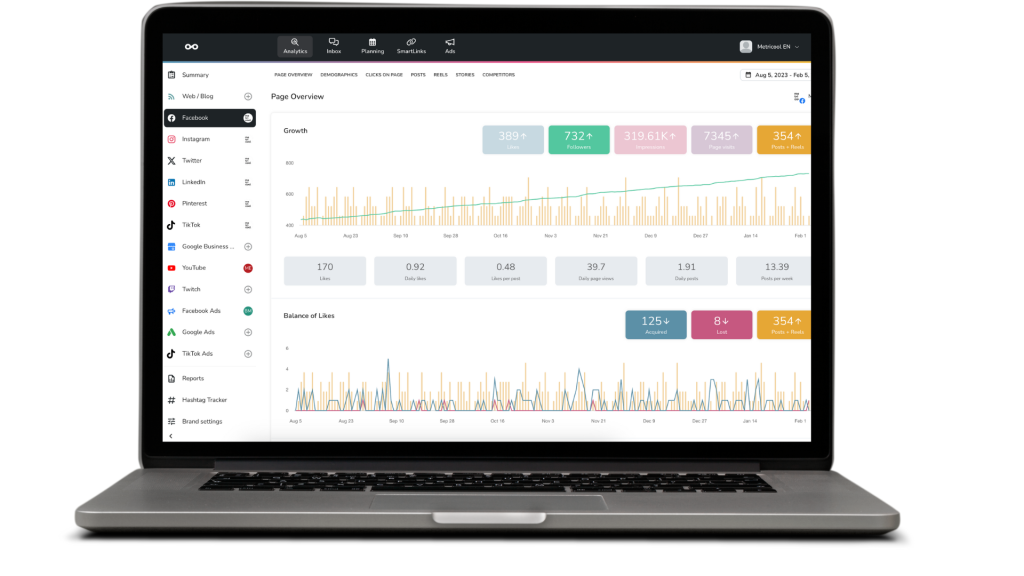
Facebook page overview
When first clicking into the Facebook analytics section, you will see an overview of your page’s evolution and growth. Let’s break it down.
Growth
This includes the evolution of likes, impressions, page visits, and the amount of posts you have published in that period. You can simply choose a time that you’d like to analyze and this platform will show you a graph with the evolution of your Facebook fan page.
Balance of likes
Here you can check how many likes you have acquired and lost in the period. You will also see how many posts and Reels your page has published in the time.
Posts viewed in period
With this data, you can see your overall page impressions, reactions, and page clicks.
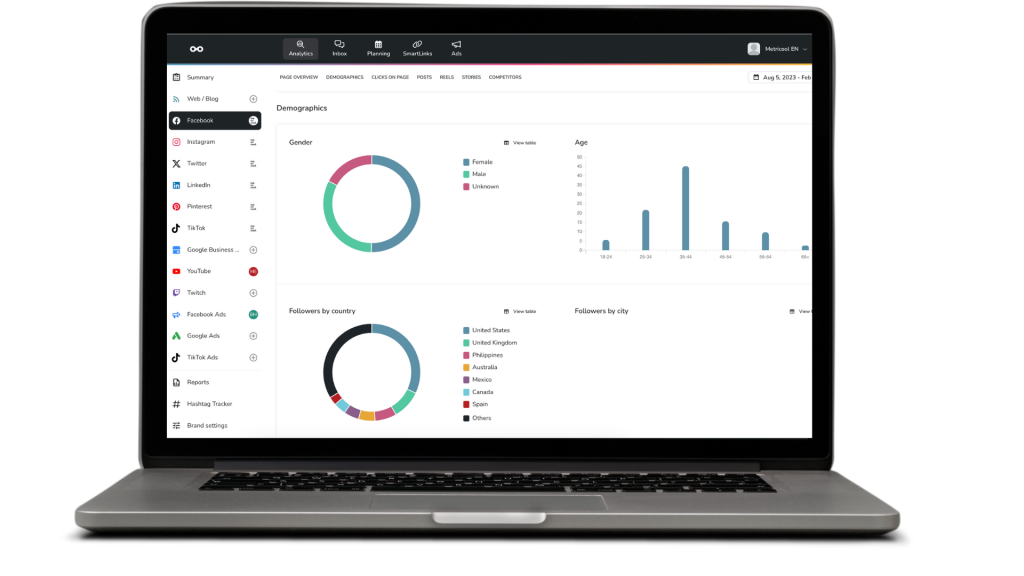
Demographics
The next section will break down your audience demographics with information on audience gender, ages, and followers by country and city.
Clicks on the page
In analyzing the general data from your page, you can see the results obtained in terms of clicks on your Facebook page. This includes data on your call-to-action buttons, website buttons, page visits, and the posts and Reels published.
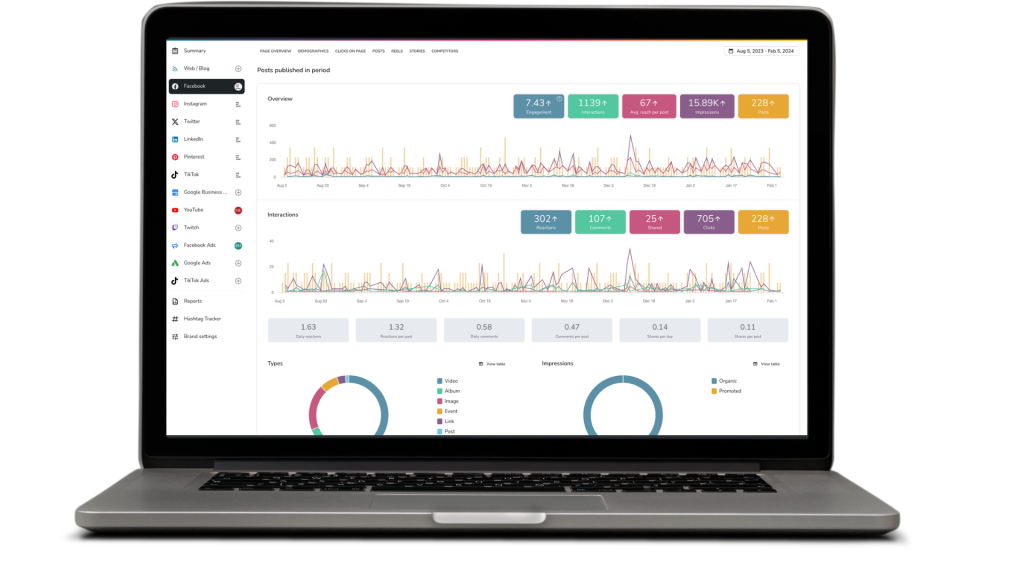
Posts published in the period
Overview
In this section, you will see an overview of all your publications within a certain period.
- Engagement: This shows the overall engagement rate of your posts, taking into account the sum of interactions gained on these posts, divided by the reach, multiplied by 100.
- Interactions: The sum of reactions, comments, shares, and clicks.
- Reach: The total number of people that have seen your posts.
Interactions
This section further breaks down how users are interacting with your content including the number of reactions, comments, shares, clicks, and posts. Underneath the graph, you can see more specific data, which includes the averages of the following metrics:
- Daily reactions
- Reactions per post
- Daily comments
- Comments per post
- Shares per day
- Shares per post
Types
Here you can see a pie chart breakdown with the type of content you are posting to your Facebook page. This includes videos, albums, images, events, links, and posts. The right pie chart will show the spread of your impressions, both organic and promoted.
List of posts
Here you can find a list of your top-performing posts on Facebook in that time frame. This will include individual metrics of the post including the number of reactions, comments, shares, clicks, link clicks, impressions, reach, engagement, video views, and video time watched.
Underneath the post, you will see three icons titled: More, View, and Boost. What do these mean?
- More: By clicking on “More” you can see the full caption or text, with the option to copy this text to your clipboard in case you want to repurpose it.
- View: When you click on “View”, this will take you directly to the Facebook post on the network.
- Boost: From Metricool you can boost Facebook posts in one click. Simply add the amount of money you want to spend, add the name of the payer, and the name of the beneficiary to boost your post.
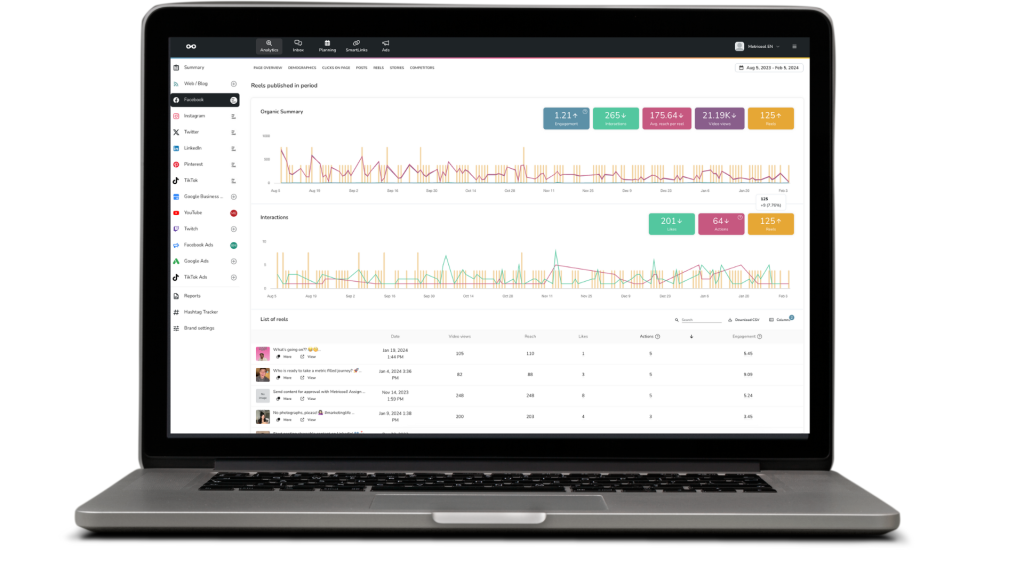
Reels published in period
Similar to the previous posts section, this includes metrics specifically about your Facebook Reels data.
Organic summary
The first section is an organic summary of your Reels’ engagement rate, interactions, average reach per reel, video views, and the number of Reels posted.
Interactions
Next, you can analyze your Reels interactions with information on the number of likes, actions, and Reels published in that period.
List of Reels
Lastly, in the Reels section, you have a list of your top-performing Reels with data on your video views, reach, likes, actions, and engagement. You have the same “More” and “View” options as you do in the list of posts, however, you cannot boost Reels.
Stories published in period
View how your Facebook Stories have performed with Metricool. This feature has been newly added and is still in development, so it may take a few weeks for your Facebook Stories data to populate.
List of stories
Here you can see your top-performing Facebook Stories in that period, with a link to view the story directly on Facebook. To see your archived Facebook stories, you will need to enable this within your account settings on the Facebook app.
See how to enable your Facebook Stories archives here.
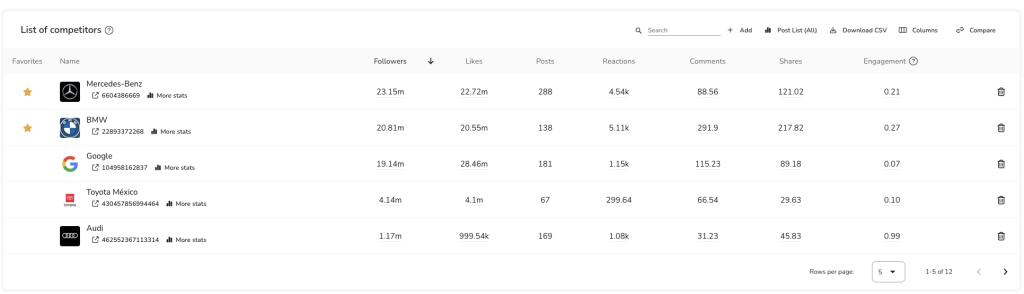
Competitors
Analyze the pages of your main competitors on Facebook. Metricool offers you a table with the following metrics:
- Followers
- Page likes
- Posts
- Reactions
- Comments
- Shares
- Engagement
You can sort your competitors by your preferred metric, in this example, they are ordered by the likes that each page has received in the time range selected. You can also compare multiple competitors, to see how each competitor measures to each other.
With a free account, you can add up to 5 competitors at a time.
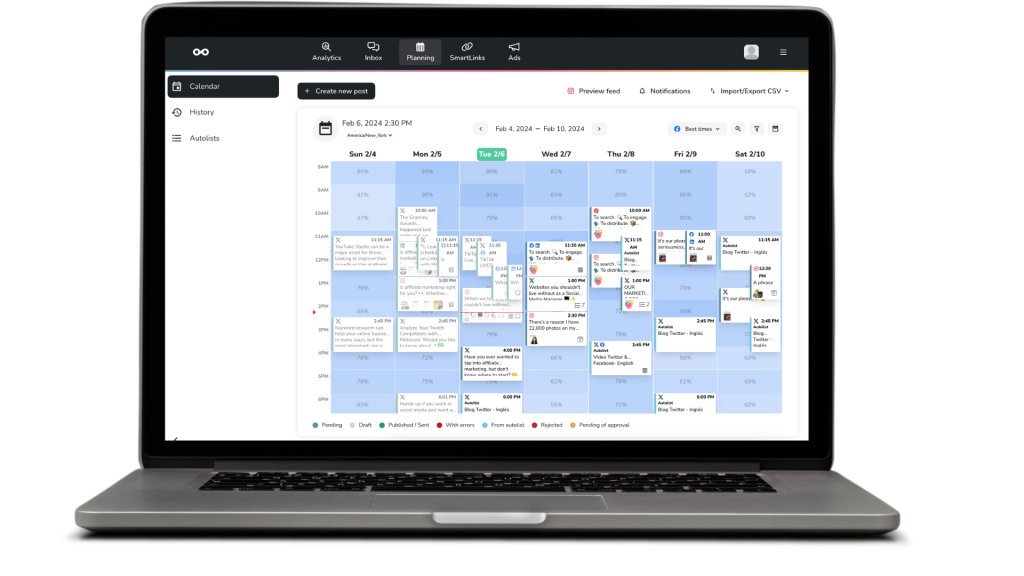
Schedule Facebook Content for Free with Metricool
Within the Planning tab, you will find three sections: Calendar, History, and Autolists. Let’s take a closer look at each one to find out how they can help you with your Facebook analytics, statistics, and metrics.
Calendar
Organize all your posts in a simple and fast way, to save time and be more agile when publishing content. Metricool allows you to organize all of your posts with a calendar, to which you can add a link, gif, video, or up to ten images or videos.
Another advantage of Metricool is that it allows you to arrange a group of images (up to 10 as mentioned) that you can set to publish in a specific album.
This planning feature is very easy to use once you know what you want to publish and the best time to do so. On Metricool, there are two ways to create and schedule content. The first is by using the calendar view to add content:
- Select in the calendar which day and time you’d like to publish.
- Click on that section and add your content, a caption, any links, images, gifs, or videos.
- Once scheduled, Metricool will publish it automatically.
The second way to schedule content is by clicking on “Create new post” which will open up the same scheduler:
- Highlight the Facebook icon, and select the type of post you will be publishing (Post, Reel, or Story).
- To upload images, click on the image/video icon and upload via your computer or by URL. You can also utilize Metricool’s video and image banks if you are lacking content.
- Add your caption, any hashtags, emojis, and links. You can also utilize our AI text generator for more captions and content ideas.
- See how your post will appear in the feed by viewing the feed preview on the right side of the screen.
- Select the time and day you want this post to go out, and select from the following options: Save as draft, send to review, schedule, or publish now.
- Then your post is ready to go and will be automatically published, or sent to a reviewer.
Find your best times to post on Facebook
In addition to planning your posts, this tool lets you know the best times to publish on Facebook. In short, the busiest moments of activity have the best results. You will know when there are more followers connected and therefore you will gain visibility, engagement, traffic, and followers.
When you choose to see the best times on Facebook (you also have this tool for X (Twitter) and Instagram) stripes of colors from light blue to dark blue will appear on the calendar. This gradient indicates your best and worst hours to publish, with the darkest colors being optimal for better results regarding interactions.
Personalized Facebook Analytics Reports
This is one of the most important advantages of Metricool. Automatically generate attractive and professional social media reports in a PDF or PPT (PowerPoint) presentation with detailed metrics of your Facebook page and content. *
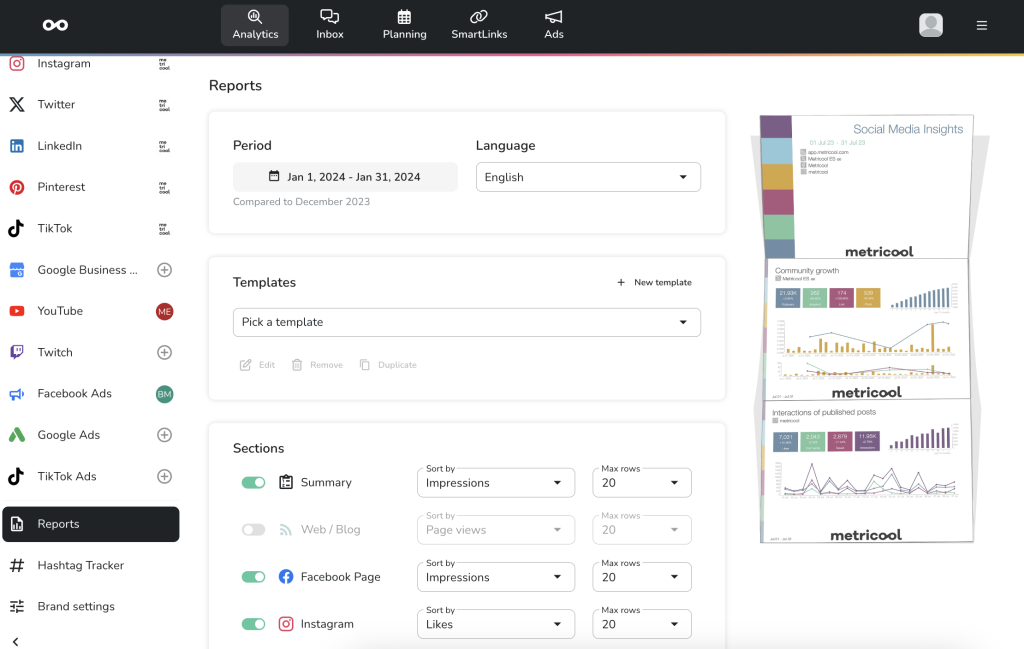
These reports can be presented to clients or superiors, or simply to show data from your networks to future sponsors or advertisers. This data is also useful for you to keep track of your Facebook analytics and check if your strategy is effective.
An important feature is that these reports can be personalized with the data of your company by selecting the following aspects:
- Create report templates and select how you want the data organized, add your brand colors, background, and title to further personalize this report.
- The range of dates that you want to include in the report.
- The sections and metrics that you’d like to appear.
- Your company or agency logo (which will appear at the bottom of each page).
Monitor, analyze, and create reports with your Facebook analytics. Indispensable metrics that allow you to attain more reach and influence on Facebook or any other social network.
*Downloading these social media reports is a Premium feature and is not included in the free plan.
Access Facebook Analytics via the Metricool App
With the Metricool application for smartphones or tablets, you can analyze your Facebook page analytics and plan your content at any time and from any place.