Table of Contents
UNITED STATES
SECURITIES AND EXCHANGE COMMISSION
Washington, D.C. 20549
FORM 10-K
☑ ANNUAL REPORT PURSUANT TO SECTION 13 OR 15(d) OF THE SECURITIES EXCHANGE ACT OF 1934
For the fiscal year ended December 31, 2018
OR
☐ TRANSITION REPORT PURSUANT TO SECTION 13 OR 15(d) OF THE SECURITIES EXCHANGE ACT OF 1934
For the transition period from to
Commission file number 001-14905
BERKSHIRE HATHAWAY INC.
(Exact name of Registrant as specified in its charter)
| Delaware | 47-0813844 | |
| State or other jurisdiction of incorporation or organization |
(I.R.S. Employer Identification Number) | |
| 3555 Farnam Street, Omaha, Nebraska | 68131 | |
| (Address of principal executive office) | (Zip Code) |
Registrant’s telephone number, including area code (402) 346-1400
Securities registered pursuant to Section 12(b) of the Act:
| Title of each class |
Name of each exchange on which registered | |
| Class A common stock, $5.00 Par Value | New York Stock Exchange | |
| Class B common stock, $0.0033 Par Value | New York Stock Exchange |
Securities registered pursuant to Section 12(g) of the Act: NONE
Indicate by check mark if the Registrant is a well-known seasoned issuer, as defined in Rule 405 of the Securities Act. Yes ☑ No ☐
Indicate by check mark if the Registrant is not required to file reports pursuant to Section 13 or Section 15(d) of the Act. Yes ☐ No ☑
Indicate by check mark whether the Registrant (1) has filed all reports required to be filed by Section 13 or 15(d) of the Securities Exchange Act of 1934 during the preceding 12 months (or for such shorter period that the registrant was required to file such reports), and (2) has been subject to such filing requirements for the past 90 days. Yes ☑ No ☐
Indicate by check mark whether the Registrant has submitted electronically every Interactive Data File required to be submitted pursuant to Rule 405 of Regulation S-T (§232.405 of this chapter) during the preceding 12 months (or for such shorter period that the registrant was required to submit such files). Yes ☑ No ☐
Indicate by check mark if disclosure of delinquent filers pursuant to Item 405 of Regulation S-K (§229.405 of this chapter) is not contained herein, and will not be contained, to the best of Registrant’s knowledge, in definitive proxy or information statements incorporated by reference in Part III of this Form 10-K or any amendment to this Form 10-K. ☐
Indicate by check mark whether the Registrant is a large accelerated filer, an accelerated filer, a non-accelerated filer, a smaller reporting company, or an emerging growth company. See the definitions of “large accelerated filer,” “accelerated filer,” “smaller reporting company,” and “emerging growth company” in Rule 12b-2 of the Exchange Act. Large accelerated filer ☑ Accelerated filer ☐ Non-accelerated filer ☐ Smaller reporting company ☐ Emerging growth company ☐
If an emerging growth company, indicate by check mark if the registrant has elected not to use the extended transition period for complying with any new or revised financial accounting standards provided pursuant to Section 13(a) of the Exchange Act. ☐
Indicate by check mark whether the Registrant is a shell company (as defined in Rule 12b-2 of the Act). Yes ☐ No ☑
State the aggregate market value of the voting stock held by non-affiliates of the Registrant as of June 30, 2018: $367,009,000,000*
Indicate the number of shares outstanding of each of the Registrant’s classes of common stock:
| February 14, 2019—Class A common stock, $5 par value |
725,807 shares | |
| February 14, 2019—Class B common stock, $0.0033 par value |
1,372,751,831 shares |
DOCUMENTS INCORPORATED BY REFERENCE
Portions of the Proxy Statement for the Registrant’s Annual Meeting to be held May 4, 2019 are incorporated in Part III.
| * | This aggregate value is computed at the last sale price of the common stock as reported on the New York Stock Exchange on June 30, 2018. It does not include the value of Class A common stock (294,660 shares) and Class B common stock (57,946,850 shares) held by Directors and Executive Officers of the Registrant and members of their immediate families, some of whom may not constitute “affiliates” for purpose of the Securities Exchange Act of 1934. |
Table of Contents
Table of Contents
| Page No. | ||||||
|
|
| |||||
| Item 1. |
Business Description | K-1 | ||||
| Item 1A. |
Risk Factors | K-22 | ||||
| Item 1B. |
Unresolved Staff Comments | K-25 | ||||
| Item 2. |
Description of Properties | K-25 | ||||
| Item 3. |
Legal Proceedings | K-28 | ||||
| Item 4. |
Mine Safety Disclosures | K-28 | ||||
|
|
||||||
| Item 5. |
Market for Registrant’s Common Equity, Related Security Holder Matters and Issuer Purchases of Equity Securities |
K-29 | ||||
| Item 6. |
Selected Financial Data | K-31 | ||||
| Item 7. |
Management’s Discussion and Analysis of Financial Condition and Results of Operations | K-32 | ||||
| Item 7A. |
Quantitative and Qualitative Disclosures About Market Risk | K-61 | ||||
| Item 8. |
Financial Statements and Supplementary Data | K-62 | ||||
| Consolidated Balance Sheets— December 31, 2018 and December 31, 2017 |
K-64 | |||||
| Consolidated Statements of Earnings— Years Ended December 31, 2018, December 31, 2017, and December 31, 2016 |
K-66 | |||||
| Consolidated Statements of Comprehensive Income— Years Ended December 31, 2018, December 31, 2017, and December 31, 2016 |
K-67 | |||||
| Consolidated Statements of Changes in Shareholders’ Equity— Years Ended December 31, 2018, December 31, 2017, and December 31, 2016 |
K-67 | |||||
| Consolidated Statements of Cash Flows— Years Ended December 31, 2018, December 31, 2017, and December 31, 2016 |
K-68 | |||||
| Notes to Consolidated Financial Statements | K-69 | |||||
| Item 9. |
Changes in and Disagreements with Accountants on Accounting and Financial Disclosure | K-109 | ||||
| Item 9A. |
Controls and Procedures | K-109 | ||||
| Item 9B. |
Other Information | K-109 | ||||
|
|
||||||
| Item 10. |
Directors, Executive Officers and Corporate Governance | K-109 | ||||
| Item 11. |
Executive Compensation | K-109 | ||||
| Item 12. |
Security Ownership of Certain Beneficial Owners and Management and Related Stockholder Matters | K-109 | ||||
| Item 13. |
Certain Relationships and Related Transactions and Director Independence | K-109 | ||||
| Item 14. |
Principal Accountant Fees and Services | K-109 | ||||
|
|
||||||
| Item 15. |
Exhibits and Financial Statement Schedules | K-110 | ||||
| Exhibit Index |
K-113 | |||||
| Signatures |
K-114 | |||||
Table of Contents
Part I
| Item 1. | Business Description |
Berkshire Hathaway Inc. (“Berkshire,” “Company” or “Registrant”) is a holding company owning subsidiaries engaged in a number of diverse business activities. The most important of these are insurance businesses conducted on both a primary basis and a reinsurance basis, a freight rail transportation business and a group of utility and energy generation and distribution businesses. Berkshire also owns and operates a large number of other businesses engaged in a variety of activities, as identified herein. Berkshire is domiciled in the state of Delaware, and its corporate headquarters are located in Omaha, Nebraska.
Berkshire’s operating businesses are managed on an unusually decentralized basis. There are essentially no centralized or integrated business functions (such as sales, marketing, purchasing, legal or human resources) and there is minimal involvement by Berkshire’s corporate headquarters in the day-to-day business activities of the operating businesses. Berkshire’s corporate senior management team participates in and is ultimately responsible for significant capital allocation decisions, investment activities and the selection of the Chief Executive to head each of the operating businesses. It also is responsible for establishing and monitoring Berkshire’s corporate governance practices, including, but not limited to, communicating the appropriate “tone at the top” messages to its employees and associates, monitoring governance efforts, including those at the operating businesses, and participating in the resolution of governance-related issues as needed.
Berkshire and its consolidated subsidiaries employ approximately 389,000 people worldwide.
Insurance and Reinsurance Businesses
Berkshire’s insurance and reinsurance business activities are conducted through numerous domestic and foreign-based insurance entities. Berkshire’s insurance businesses provide insurance and reinsurance of property and casualty and life, accident and health risks worldwide.
In direct or primary insurance activities, the insurer assumes the risk of loss from persons or organizations that are directly subject to the risks. Such risks may relate to property, casualty (or liability), life, accident, health, financial or other perils that may arise from an insurable event. In reinsurance activities, the reinsurer assumes defined portions of risks that other direct insurers or reinsurers assumed in their own insuring activities.
Reinsurance contracts are normally classified as treaty or facultative contracts. Treaty reinsurance refers to reinsurance coverage for all or a portion of a specified group or class of risks ceded by the direct insurer, while facultative reinsurance involves coverage of specific individual underlying risks. Reinsurance contracts are further classified as quota-share or excess. Under quota-share (proportional or pro-rata) reinsurance, the reinsurer shares proportionally in the original premiums and losses of the direct insurer or reinsurer. Excess (or non-proportional) reinsurance provides for the indemnification of the direct insurer or reinsurer for all or a portion of the loss in excess of an agreed upon amount or “retention.” Both quota-share and excess reinsurance contracts may provide for aggregate limits of indemnification.
Insurance and reinsurance are generally subject to regulatory oversight throughout the world. Except for regulatory considerations, there are virtually no barriers to entry into the insurance and reinsurance industry. Competitors may be domestic or foreign, as well as licensed or unlicensed. The number of competitors within the industry is not known. Insurers and reinsurers compete on the basis of reliability, financial strength and stability, financial ratings, underwriting consistency, service, business ethics, price, performance, capacity, policy terms and coverage conditions.
Insurers based in the United States (“U.S.”) are subject to regulation by their states of domicile and by those states in which they are licensed to write policies on an admitted basis. The primary focus of regulation is to assure that insurers are financially solvent and that policyholder interests are otherwise protected. States establish minimum capital levels for insurance companies and establish guidelines for permissible business and investment activities. States have the authority to suspend or revoke a company’s authority to do business as conditions warrant. States regulate the payment of dividends by insurance companies to their shareholders and other transactions with affiliates. Dividends, capital distributions and other transactions of extraordinary amounts are subject to prior regulatory approval.
Insurers may market, sell and service insurance policies in the states where they are licensed. These insurers are referred to as admitted insurers. Admitted insurers are generally required to obtain regulatory approval of their policy forms and premium rates. Non-admitted insurance markets have developed to provide insurance that is otherwise unavailable through admitted insurers. Non-admitted insurance, often referred to as “excess and surplus” lines, is procured by either state-licensed surplus lines brokers who place risks with insurers not licensed in that state or by the insured party’s direct procurement from non-admitted insurers. Non-admitted insurance is subject to considerably less regulation with respect to policy rates and forms. Reinsurers are normally not required to obtain regulatory approval of premium rates or reinsurance contracts.
K-1
Table of Contents
The insurance regulators of every state participate in the National Association of Insurance Commissioners (“NAIC”). The NAIC adopts forms, instructions and accounting procedures for use by U.S. insurers and reinsurers in preparing and filing annual statutory financial statements. However, an insurer’s state of domicile has ultimate authority over these matters. In addition to its activities relating to the annual statement, the NAIC develops or adopts statutory accounting principles, model laws, regulations and programs for use by its members. Such matters deal with regulatory oversight of solvency, risk management, compliance with financial regulation standards and risk-based capital reporting requirements.
Berkshire’s insurance companies maintain capital strength at exceptionally high levels, which differentiates them from their competitors. Collectively, the combined statutory surplus of Berkshire’s U.S. based insurers was approximately $162 billion at December 31, 2018. Berkshire’s major insurance subsidiaries are rated AA+ by Standard & Poor’s and A++ (superior) by A.M. Best with respect to their financial condition and claims paying ability.
The Terrorism Risk Insurance Act of 2002 established within the Department of the Treasury a Terrorism Insurance Program (“Program”) for commercial property and casualty insurers by providing federal reinsurance of insured terrorism losses. The Program currently extends to December 31, 2020 through other Acts, most recently the Terrorism Risk Insurance Program Reauthorization Act of 2015 (the “2015 TRIA Reauthorization”). Hereinafter these Acts are collectively referred to as TRIA. Under TRIA, the Department of the Treasury is charged with certifying “acts of terrorism.” Coverage under TRIA occurs if the industry insured loss for certified events occurring during the calendar year exceeds $180 million in 2019 and $200 million in 2020, or any calendar year thereafter.
To be eligible for federal reinsurance, insurers must make available insurance coverage for acts of terrorism, by providing policyholders with clear and conspicuous notice of the amount of premium that will be charged for this coverage and of the federal share of any insured losses resulting from any act of terrorism. Assumed reinsurance is specifically excluded from TRIA participation. TRIA currently also excludes certain forms of direct insurance (such as personal and commercial auto, burglary, theft, surety and certain professional liability lines). Reinsurers are not required to offer terrorism coverage and are not eligible for federal reinsurance of terrorism losses.
During 2019, in the event of a certified act of terrorism, the federal government will reimburse insurers (conditioned on their satisfaction of policyholder notification requirements) for 81% of their insured losses in excess of an insurance group’s deductible. Under the 2015 TRIA Reauthorization, the federal government’s reimbursement obligation will be reduced to 80% in 2020 and thereafter. Under the Program, the deductible is 20% of the aggregate direct subject earned premium for relevant commercial lines of business in the immediately preceding calendar year. The aggregate deductible in 2019 for Berkshire’s insurance group is expected to approximate $1.3 billion. There is also an aggregate limit of $100 billion on the amount of the federal government coverage for each TRIA year.
Regulation of the insurance industry outside of the United States is subject to the laws and regulations of each country in which an insurer has operations or writes premiums. Some jurisdictions impose comprehensive regulatory requirements on insurance businesses, such as in the United Kingdom, where insurers are subject to regulation by the Prudential Regulation Authority and the Financial Conduct Authority in Germany where insurers are subject to regulation by the Federal Financial Supervisory Authority (BaFin) and in Australia where insurers are subject to regulation by the Australian Prudential Regulatory Authority. Other jurisdictions may impose fewer requirements. In certain foreign countries, reinsurers are also required to be licensed by governmental authorities. These licenses may be subject to modification, suspension or revocation dependent on such factors as amount and types of insurance liabilities and minimum capital and solvency tests. The violation of regulatory requirements may result in fines, censures and/or criminal sanctions in various jurisdictions.
Berkshire’s insurance underwriting operations include the following groups: (1) GEICO, (2) Berkshire Hathaway Reinsurance Group and (3) Berkshire Hathaway Primary Group. Except for retroactive reinsurance and periodic payment annuity products that generate significant amounts of up-front premiums along with estimated claims expected to be paid over very long periods of time (creating “float,” see Investments section below), Berkshire expects to achieve a net underwriting profit over time and to reject inadequately priced risks. Underwriting profit is defined as earned premiums less associated incurred losses, loss adjustment expenses and underwriting and policy acquisition expenses. Underwriting profit does not include investment income earned from investments. Berkshire’s insurance businesses employ approximately 49,000 people. Additional information related to each of Berkshire’s underwriting groups follows.
K-2
Table of Contents
GEICO—GEICO is headquartered in Chevy Chase, Maryland. GEICO’s insurance subsidiaries consist of Government Employees Insurance Company, GEICO General Insurance Company, GEICO Indemnity Company, GEICO Casualty Company, GEICO Advantage Insurance Company, GEICO Choice Insurance Company, GEICO Secure Insurance Company, GEICO County Mutual Insurance Company and GEICO Marine Insurance Company. GEICO companies primarily offer private passenger automobile insurance to individuals in all 50 states and the District of Columbia. GEICO also insures motorcycles, all-terrain vehicles, recreational vehicles, boats and small commercial fleets and acts as an agent for other insurers who offer homeowners, renters, boat, life and identity management insurance to individuals who desire insurance coverages other than those offered by GEICO. GEICO’s marketing is primarily through direct response methods in which applications for insurance are submitted directly to the companies via the Internet or by telephone. GEICO conducts business through regional service centers and claims adjustment and other facilities in 39 states.
The automobile insurance business is highly competitive in the areas of price and service. GEICO competes for private passenger automobile insurance customers in the preferred, standard and non-standard risk markets with other companies that sell directly to the customer as well as with companies that use agency sales forces, including State Farm, Allstate (including Esurance), Progressive and USAA. Significant advertising campaigns and competitive rates contributed to a cumulative increase in voluntary policies-in-force of approximately 35% over the past five years. According to most recently published A.M. Best data for 2017, the five largest automobile insurers had a combined market share in 2017 of approximately 56%, with GEICO’s market share being second largest at approximately 12.8%. Since the publication of that data, GEICO’s management estimates its current market share is approximately 13.3%. Seasonal variations in GEICO’s insurance business are not significant. However, extraordinary weather conditions or other factors may have a significant effect upon the frequency or severity of automobile claims.
State insurance departments stringently regulate private passenger auto insurance. As a result, it is difficult for insurance companies to differentiate their products. Competition for private passenger automobile insurance, which is substantial, tends to focus on price and level of customer service provided. GEICO’s cost-efficient direct response marketing methods and emphasis on customer satisfaction enable it to offer competitive rates and value to its customers. GEICO primarily uses its own claims staff to manage and settle claims. The name and reputation of GEICO is a material asset and management protects it and other service marks through appropriate registrations.
Berkshire Hathaway Reinsurance Group—Berkshire’s combined global reinsurance business, referred to as the Berkshire Hathaway Reinsurance Group (“BHRG”), offers a wide range of coverages on property, casualty, life and health risks to insurers and reinsurers worldwide. Reinsurance business is written through National Indemnity Company (“NICO”), domiciled in Nebraska, its subsidiaries and various other insurance subsidiaries wholly owned by Berkshire (collectively, the “NICO Group”) and General Re Corporation, domiciled in Delaware, and its subsidiaries (collectively the “General Re Group”). BHRG’s underwriting operations in the U.S. are based in Stamford, Connecticut. BHRG also conducts business activities globally in 23 countries.
The type and volume of business written is dependent on market conditions, including prevailing premium rates and coverage terms. The level of underwriting activities often fluctuates significantly from year to year depending on the perceived level of price adequacy in specific insurance and reinsurance markets as well as from the timing of particularly large reinsurance transactions.
Property/casualty
The NICO Group offers traditional property/casualty reinsurance on both an excess-of-loss and a quota-share basis, catastrophe excess-of-loss treaty and facultative reinsurance, and primary insurance on an excess-of-loss basis for large or unusual risks for clients worldwide. The NICO Group periodically participates in underwriting placements with major brokers in the London Market through Berkshire Hathaway Insurance International, Ltd., based in Great Britain. Business is written through intermediary brokers or directly with the insured or reinsured. NICO also occasionally writes retroactive reinsurance contracts, which cover past loss events arising from property and casualty contracts written by ceding insurers and reinsurers.
The type and volume of business written by the NICO Group may vary significantly from period to period resulting from changes in perceived premium rate adequacy and from unique or large transactions. A significant portion of NICO Group’s annual reinsurance premium volume currently derives from a 10-year, 20% quota-share agreement with Insurance Australia Group Limited (“IAG”) that became effective July 1, 2015. IAG is a multi-line insurer in Australia, New Zealand and other Asia Pacific countries.
The General Re Group conducts a global property and casualty reinsurance business. Reinsurance contracts are written on both a quota-share and excess basis for multiple lines of business. Contracts are primarily in the form of treaties, and to a lesser degree, on a facultative basis.
General Re Group conducts business in North America primarily through General Reinsurance Corporation (“GRC”), which is licensed in the District of Columbia and all states, except Hawaii, where it is an accredited reinsurer. GRC conducts operations in North America from its headquarters in Stamford, Connecticut and through 13 branch offices in the U.S. and Canada.
K-3
Table of Contents
In North America, the General Re Group includes General Star National Insurance Company, General Star Indemnity Company and Genesis Insurance Company, which offer a broad array of specialty and surplus lines and property, casualty and professional liability coverages. Such business is marketed through a select group of wholesale brokers, managing general underwriters and program administrators, and offer solutions for the unique needs of public entity, commercial and captive customers.
General Re Group’s international reinsurance business is conducted on a direct basis through General Reinsurance AG (“GRAG”), based in Cologne Germany, and through several other subsidiaries and branches in 23 countries. International business is also written through brokers, including Faraday, a wholly-owned subsidiary. Faraday owns the managing agent of Syndicate 435 at Lloyd’s of London, and provides capacity and participates in 100% of the results of Syndicate 435.
Retroactive reinsurance
Retroactive reinsurance contracts indemnify ceding companies against the adverse development of claims arising from loss events that have already occurred under property and casualty policies issued in prior years. Coverages under such contracts are provided on an excess basis (above a stated retention) or for losses payable immediately after the inception of the contract. Contracts are normally subject to aggregate limits of indemnification and are occasionally exceptionally large in amount. Significant amounts of asbestos, environmental and latent injury claims may arise under these contracts.
For instance, in January 2017, NICO entered into a retroactive reinsurance agreement with various subsidiaries of American International Group, Inc. (collectively, “AIG”). Under the agreement, NICO agreed to indemnify AIG for 80% of up to $25 billion in excess of $25 billion retained by AIG, of losses and allocated loss adjustment expenses with respect to certain commercial insurance loss events occurring in years prior to 2016.
The concept of time-value-of-money is an important element in establishing retroactive reinsurance contract prices and terms, since loss payments may occur over decades. Normally, expected ultimate losses payable under these policies are expected to exceed premiums, thus producing underwriting losses. Nevertheless, this business is written, in part, because of the large amounts of policyholder funds generated for investment, the economic benefit of which will be reflected through investment results in future periods.
Life/health
The General Re Group also conducts a global life and health reinsurance business. In the U.S. and internationally, the General Re Group writes life, disability, supplemental health, critical illness and long-term care coverages. The life/health business is marketed on a direct basis. In 2018, the General Re Group wrote approximately 29% of life/health net premiums in the United States, 20% in Western Europe and the remaining 51% throughout the rest of the world.
Additionally, Berkshire Hathaway Life Insurance Company of Nebraska (“BHLN”), a subsidiary of NICO, writes reinsurance covering various forms of traditional life insurance exposures. BHLN and its affiliates have also periodically reinsured certain guaranteed minimum death, income, and similar benefit coverages on closed-blocks of variable annuity reinsurance contracts.
Periodic payment annuity
BHLN writes periodic payment annuity insurance policies and reinsures existing annuity-like obligations. Under these policies, BHLN receives upfront premiums and agrees in the future to make periodic payments that often extend for decades. These policies, generally relate to the settlement of underlying personal injury or workers’ compensation cases of other insurers, known as structured settlements. Similar to retroactive reinsurance contracts, time-value-of-money concepts are an important factor in establishing such premiums and underwriting losses are expected from the periodic accretion of time-value discounted liabilities.
Berkshire Hathaway Primary Group—The Berkshire Hathaway Primary Group (“BH Primary”) is a collection of independently managed primary insurers that provide a wide variety of insurance coverages to policyholders located principally in the United States. These various operations are discussed below.
NICO and certain affiliates (“NICO Primary”) underwrite commercial motor vehicle and general liability insurance on an admitted basis and on an excess and surplus basis. Insurance coverages are offered nationwide primarily through insurance agents and brokers.
The “Berkshire Hathaway Homestate Companies” (“BHHC”) is a group of insurers offering workers’ compensation, commercial auto and commercial property coverages to a diverse client base. BHHC has developed a national reach, with the ability to provide first-dollar and small to large deductible workers’ compensation coverage to employers in all states, except those where coverage is available only through state-operated workers’ compensation funds. NICO Primary and BHHC are each based in Omaha, Nebraska.
K-4
Table of Contents
Berkshire Hathaway Specialty Insurance (“BH Specialty”) provides commercial property, casualty, healthcare professional liability, executive and professional lines, surety, travel, medical stop loss and homeowners insurance. BH Specialty writes business on both an excess and surplus lines basis and an admitted basis in the U.S., and on a locally admitted basis outside the U.S. BH Specialty is based in Boston, Massachusetts, with regional offices currently in several cities in the U.S. and international offices located in Australia, New Zealand, Canada and several countries in Asia and Europe. BH Specialty currently intends to further expand its operations. BH Specialty writes business through wholesale and retail insurance brokers, as well as managing general agents.
MedPro Group (“MedPro”) is a leading provider of customized healthcare liability insurance, claims, patient safety and risk solutions to physicians, surgeons, dentists and other healthcare professionals, as well as hospitals, senior care and other healthcare facilities in the United States. MedPro has provided insurance coverage to protect healthcare providers against losses since 1899. MedPro distributes policies primarily through a nationwide network of appointed agents and brokers. MedPro currently offers coverage options to healthcare providers in the other countries as well as student health insurance, through its subsidiaries and other Berkshire affiliates. MedPro is based in Fort Wayne, Indiana.
U.S. Investment Corporation (“USIC”) and its subsidiaries are specialty insurers that underwrite commercial, professional and personal lines insurance on an admitted basis, as well as an excess and surplus basis. USIC markets policies in all 50 states and the District of Columbia through wholesale and retail insurance agents. USIC companies also underwrite and market a wide variety of specialty insurance products. USIC is based in Wayne, Pennsylvania.
Applied Underwriters, Inc. (“Applied”) is a provider of payroll and insurance services to small and mid-sized employers. Applied, through its subsidiaries principally markets a product that bundles workers’ compensation and other employment related insurance coverages and business services into a seamless package that is designed to remove the burden of administrative and regulatory requirements faced by small to mid-sized employers. Applied is based in Omaha, Nebraska.
The Berkshire Hathaway GUARD Insurance Companies (“Guard”) provide workers’ compensation business owner’s policy and commercial umbrella coverage to over 250,000 small and mid-sized businesses. Guard also provides complementary commercial auto and professional liability in an expanding number of states. Policies are offered through independent agents and brokers. Guard is based in Wilkes-Barre, Pennsylvania. Central States Indemnity Company of Omaha, based in Omaha, Nebraska, primarily writes Medicare Supplement insurance and credit insurance.
On October 1, 2018, NICO acquired MLMIC Insurance Company (“MLMIC”). MLMIC has been the leading writer of medical professional liability insurance in New York State for over 40 years. MLMIC distributes its policies on a direct basis to medical and dental professionals, health care providers and hospitals.
Investments of insurance businesses—Berkshire’s insurance subsidiaries hold significant levels of invested assets. Investment portfolios are managed by Berkshire’s Chief Executive Officer and other in-house investment managers. Investments include a very large portfolio of publicly traded equity securities, which are concentrated in relatively few issuers, as well as fixed maturity securities and cash and short-term investments. Generally, there are no targeted allocations by investment type or attempts to match investment asset and insurance liability durations. However, investment portfolios have historically included a much greater proportion of equity securities than is customary in the insurance industry.
Invested assets derive from shareholder capital as well as funds provided from policyholders through insurance and reinsurance business (“float”). Float is the approximate amount of net policyholder funds generated through underwriting activities that is available for investment. The major components of float are unpaid losses and loss adjustment expenses, life, annuity and health benefit liabilities, unearned premiums and other policyholder liabilities less premium and reinsurance receivables, deferred policy acquisition costs and deferred charges on reinsurance contracts. On a consolidated basis, float has grown from approximately $73 billion at the end of 2012 to approximately $123 billion at the end of 2018, primarily through internal growth. The cost of float can be measured as the net pre-tax underwriting loss as a percentage of average float. Over the past five years, with the exception of 2017, Berkshire’s cost of float was negative, as its insurance businesses produced net underwriting gains. The cost of average float in 2017 was approximately 3%, primarily attributable to sizable catastrophe losses and foreign currency exchange rate losses relating to non-U.S. Dollar denominated reinsurance liabilities.
Railroad Business—Burlington Northern Santa Fe
Burlington Northern Santa Fe, LLC (“BNSF”) is based in Fort Worth, Texas, and through BNSF Railway Company operates one of the largest railroad systems in North America. BNSF had approximately 45,000 employees at the end of 2018.
In serving the Midwest, Pacific Northwest, Western, Southwestern and Southeastern regions and ports of the United States, BNSF transports a range of products and commodities derived from manufacturing, agricultural and natural resource industries. Freight revenues of BNSF are covered by contractual agreements of varying durations or common carrier published prices or quotations offered by BNSF. BNSF’s financial performance is influenced by, among other things, general and industry economic conditions at the international, national and regional levels.
K-5
Table of Contents
BNSF’s primary routes, including trackage rights, allow it to access major cities and ports in the western and southern United States as well as parts of Canada and Mexico. In addition to major cities and ports, BNSF efficiently serves many smaller markets by working closely with approximately 200 shortline railroads. BNSF has also entered into marketing agreements with other rail carriers, expanding the marketing reach for each railroad and their customers. For the year ending December 31, 2018, approximately 35% of freight revenues were derived from consumer products, 26% from industrial products, 21% from agricultural products and 18% from coal.
Regulatory Matters
BNSF is subject to federal, state and local laws and regulations generally applicable to all of its businesses. Rail operations are subject to the regulatory jurisdiction of the Surface Transportation Board (“STB”) of the United States Department of Transportation (“DOT”), the Federal Railroad Administration of the DOT, the Occupational Safety and Health Administration (“OSHA”), as well as other federal and state regulatory agencies and Canadian regulatory agencies for operations in Canada. The STB has jurisdiction over disputes and complaints involving certain rates, routes and services, the sale or abandonment of rail lines, applications for line extensions and construction, and the merger with or acquisition of control of rail common carriers. The outcome of STB proceedings can affect the profitability of BNSF’s business.
The DOT and OSHA have jurisdiction under several federal statutes over a number of safety and health aspects of rail operations, including the transportation of hazardous materials. BNSF Railway is required to transport these materials to the extent of its common carrier obligation. State agencies regulate some aspects of rail operations with respect to health and safety in areas not otherwise preempted by federal law.
Environmental Matters
BNSF’s rail operations, as well as those of its competitors, are also subject to extensive federal, state and local environmental regulation covering discharges to water, air emissions, toxic substances and the generation, handling, storage, transportation and disposal of waste and hazardous materials. Such regulations effectively increase the costs and liabilities associated with rail operations. Environmental risks are also inherent in rail operations, which frequently involve transporting chemicals and other hazardous materials.
Many of BNSF’s land holdings are or were used for industrial or transportation-related purposes or leased to commercial or industrial companies whose activities may have resulted in discharges onto the property. As a result, BNSF is subject to, and will from time to time continue to be subject to, environmental cleanup and enforcement actions. In particular, the federal Comprehensive Environmental Response, Compensation and Liability Act (“CERCLA”), also known as the Superfund law, generally imposes joint and several liabilities for the cleanup and enforcement costs on current and former owners and operators of a site, without regard to fault or the legality of the original conduct. Accordingly, BNSF may be responsible under CERCLA and other federal and state statutes for all or part of the costs to clean up sites at which certain substances may have been released by BNSF, its current lessees, former owners or lessees of properties, or other third parties. BNSF may also be subject to claims by third parties for investigation, cleanup, restoration or other environmental costs under environmental statutes or common law with respect to properties they own that have been impacted by BNSF operations.
Competition
The business environment in which BNSF operates is highly competitive. Depending on the specific market, deregulated motor carriers and other railroads, as well as river barges, ships and pipelines, may exert pressure on price and service levels. The presence of advanced, high service truck lines with expedited delivery, subsidized infrastructure and minimal empty mileage continues to affect the market for non-bulk, time-sensitive freight. The potential expansion of longer combination vehicles could further encroach upon markets traditionally served by railroads. In order to remain competitive, BNSF and other railroads seek to develop and implement operating efficiencies to improve productivity.
As railroads streamline, rationalize and otherwise enhance their franchises, competition among rail carriers intensifies. BNSF’s primary rail competitor in the Western region of the United States is the Union Pacific Railroad Company. Other Class I railroads and numerous regional railroads and motor carriers also operate in parts of the same territories served by BNSF.
Other
BNSF Logistics, LLC, a wholly-owned subsidiary of BNSF, provides non-asset based logistics services to third parties. BNSF Logistics’ services include transportation strategy and execution, managed transportation services, supply chain consulting, project management, engineering, reverse logistics, warehousing and cross-docking, and customs house brokerage services.
K-6
Table of Contents
Utilities and Energy Businesses—Berkshire Hathaway Energy
Berkshire currently owns 90.9% of the outstanding common stock of Berkshire Hathaway Energy Company (“BHE”). BHE is a global energy company with subsidiaries that generate, transmit, store, distribute and supply energy. BHE’s locally managed businesses are organized as separate operating units. BHE’s domestic regulated energy interests are comprised of four regulated utility companies serving approximately 4.9 million retail customers, two interstate natural gas pipeline companies with approximately 16,400 miles of pipeline and a design capacity of approximately 8.2 billion cubic feet of natural gas per day and ownership interests in electricity transmission businesses. BHE’s Great Britain electricity distribution subsidiaries serve about 3.9 million electricity end-users and its electricity transmission-only business in Alberta, Canada serves approximately 85% of Alberta, Canada’s population. BHE’s interests also include a diversified portfolio of independent power projects, the second-largest residential real estate brokerage firm in the United States, and one of the largest residential real estate brokerage franchise networks in the United States. BHE employs approximately 23,000 people in connection with its various operations.
General Matters
PacifiCorp is a regulated electric utility company headquartered in Oregon, serving electric customers in portions of Utah, Oregon, Wyoming, Washington, Idaho and California. The combined service territory’s diverse regional economy ranges from rural, agricultural and mining areas to urban, manufacturing and government service centers. No single segment of the economy dominates the combined service territory, which helps mitigate PacifiCorp’s exposure to economic fluctuations. In addition to retail sales, PacifiCorp sells electricity on a wholesale basis to other electricity retailers and wholesalers.
MidAmerican Energy Company (“MEC”) is a regulated electric and natural gas utility company headquartered in Iowa, serving electric and natural gas customers primarily in Iowa and also in portions of Illinois, South Dakota and Nebraska. MEC has a diverse retail customer base consisting of urban and rural residential customers and a variety of commercial and industrial customers. In addition to retail sales and natural gas transportation, MEC sells electricity principally to markets operated by regional transmission organizations and natural gas on a wholesale basis.
NV Energy, Inc. (“NV Energy”) is an energy holding company headquartered in Nevada, primarily consisting of two regulated utility subsidiaries, Nevada Power Company (“Nevada Power”) and Sierra Pacific Power Company (“Sierra Pacific”) (collectively, the “Nevada Utilities”). Nevada Power serves retail electric customers in southern Nevada and Sierra Pacific serves retail electric and natural gas customers in northern Nevada. The Nevada Utilities’ combined service territory’s economy includes gaming, mining, recreation, warehousing, manufacturing and governmental services. In addition to retail sales and natural gas transportation, the Nevada Utilities sell electricity and natural gas on a wholesale basis.
As vertically integrated utilities, BHE’s domestic utilities own approximately 29,000 net megawatts of generation capacity in operation and under construction. The domestic utilities business is subject to seasonal variations principally related to the use of electricity for air conditioning and natural gas for heating. Typically, regulated electric revenues are higher in the summer months, while regulated natural gas revenues are higher in the winter months.
The Great Britain distribution companies consist of Northern Powergrid (Northeast) Limited and Northern Powergrid (Yorkshire) plc, which own a substantial electricity distribution network that delivers electricity to end-users in northeast England in an area covering approximately 10,000 square miles. The distribution companies primarily charge supply companies regulated tariffs for the use of their distribution systems.
BHE acquired AltaLink L.P. (“AltaLink”) on December 1, 2014. AltaLink is a regulated electric transmission-only utility company headquartered in Calgary, Alberta. AltaLink connects generation plants to major load centers, cities and large industrial plants throughout its 87,000 square mile service territory.
The natural gas pipelines consist of Northern Natural Gas Company (“Northern Natural”) and Kern River Gas Transmission Company (“Kern River”). Northern Natural, based in Nebraska, owns the largest interstate natural gas pipeline system in the United States, as measured by pipeline miles, reaching from west Texas to Michigan’s Upper Peninsula. Northern Natural’s pipeline system consists of approximately 14,700 miles of natural gas pipelines. Northern Natural’s extensive pipeline system, which is interconnected with many interstate and intrastate pipelines in the national grid system, has access to supplies from multiple major supply basins and provides transportation services to utilities and numerous other customers. Northern Natural also operates three underground natural gas storage facilities and two liquefied natural gas storage peaking units. Northern Natural’s pipeline system experiences significant seasonal swings in demand and revenue, with the highest demand typically occurring during the months of November through March.
K-7
Table of Contents
Kern River, based in Utah, owns an interstate natural gas pipeline system that consists of approximately 1,700 miles and extends from supply areas in the Rocky Mountains to consuming markets in Utah, Nevada and California. Kern River transports natural gas for electric and natural gas distribution utilities, major oil and natural gas companies or affiliates of such companies, electric generating companies, energy marketing and trading companies, and financial institutions.
BHE Renewables is based in Iowa and owns interests in independent power projects having approximately 4,700 net megawatts of generation capacity that are in service in California, Texas, Illinois, Nebraska, New York, Arizona, Minnesota, Kansas, Hawaii and the Philippines. These independent power projects sell power generated primarily from wind, solar, geothermal and hydro sources under long-term contracts. Additionally, BHE Renewables has invested approximately $2 billion in eleven wind projects sponsored by third parties, commonly referred to as tax equity investments.
Regulatory Matters
PacifiCorp, MEC and the Nevada Utilities are subject to comprehensive regulation by various federal, state and local agencies. The Federal Energy Regulatory Commission (“FERC”) is an independent agency with broad authority to implement provisions of the Federal Power Act, the Natural Gas Act, the Energy Policy Act of 2005 and other federal statutes. The FERC regulates rates for wholesale sales of electricity; transmission of electricity, including pricing and regional planning for the expansion of transmission systems; electric system reliability; utility holding companies; accounting and records retention; securities issuances; construction and operation of hydroelectric facilities; and other matters. The FERC also has the enforcement authority to assess civil penalties of up to $1.2 million per day per violation of rules, regulations and orders issued under the Federal Power Act. MEC is also subject to regulation by the Nuclear Regulatory Commission pursuant to the Atomic Energy Act of 1954, as amended, with respect to its 25% ownership of the Quad Cities Nuclear Station.
With certain limited exceptions, BHE’s domestic utilities have an exclusive right to serve retail customers within their service territories and, in turn, have an obligation to provide service to those customers. In some jurisdictions, certain classes of customers may choose to purchase all or a portion of their energy from alternative energy suppliers, and in some jurisdictions retail customers can generate all or a portion of their own energy. Historically, state regulatory commissions have established retail electric and natural gas rates on a cost-of-service basis, designed to allow a utility an opportunity to recover what each state regulatory commission deems to be the utility’s reasonable costs of providing services, including a fair opportunity to earn a reasonable return on its investments based on its cost of debt and equity. The retail electric rates of PacifiCorp, MEC and the Nevada Utilities are generally based on the cost of providing traditional bundled services, including generation, transmission and distribution services; however, rates are available for transmission and distribution-only services.
Northern Powergrid (Northeast) and Northern Powergrid (Yorkshire) each charge fees for the use of their distribution systems that are controlled by a formula prescribed by the British electricity regulatory body, the Gas and Electricity Markets Authority. The current eight-year price control period runs from April 1, 2015 through March 31, 2023.
AltaLink is regulated by the Alberta Utilities Commission (“AUC”), pursuant to the Electric Utilities Act (Alberta), the Public Utilities Act (Alberta), the Alberta Utilities Commission Act (Alberta) and the Hydro and Electric Energy Act (Alberta). The AUC is an independent quasi-judicial agency with broad authority that may impact many of AltaLink’s activities, including its tariffs, rates, construction, operations and financing. Under the Electric Utilities Act, AltaLink prepares and files applications with the AUC for approval of tariffs to be paid by the Alberta Electric System Operator (“AESO”) for the use of its transmission facilities, and the terms and conditions governing the use of those facilities. The AESO is the independent system operator in Alberta, Canada that oversees Alberta’s integrated electrical system (“AIES”) and wholesale electricity market. The AESO is responsible for directing the safe, reliable and economic operation of the AIES, including long-term transmission system planning.
The natural gas pipelines are subject to regulation by various federal, state and local agencies. The natural gas pipeline and storage operations of Northern Natural and Kern River are regulated by the FERC pursuant to the Natural Gas Act and the Natural Gas Policy Act of 1978. Under this authority, the FERC regulates, among other items, (a) rates, charges, terms and conditions of service and (b) the construction and operation of interstate pipelines, storage and related facilities, including the extension, expansion or abandonment of such facilities. Interstate natural gas pipeline companies are also subject to regulations administered by the Office of Pipeline Safety within the Pipeline and Hazardous Materials Safety Administration, an agency within the DOT. Federal pipeline safety regulations are issued pursuant to the Natural Gas Pipeline Safety Act of 1968, as amended, which establishes safety requirements in the design, construction, operation and maintenance of interstate natural gas pipeline facilities.
K-8
Table of Contents
Environmental Matters
BHE and its energy businesses are subject to federal, state, local and foreign laws and regulations regarding air and water quality, renewable portfolio standards, emissions performance standards, climate change, coal combustion byproduct disposal, hazardous and solid waste disposal, protected species and other environmental matters that have the potential to impact current and future operations. In addition to imposing continuing compliance obligations, these laws and regulations, such as the Federal Clean Air Act, provide regulators with the authority to levy substantial penalties for noncompliance, including fines, injunctive relief and other sanctions.
The Federal Clean Air Act, as well as state laws and regulations impacting air emissions, provides a framework for protecting and improving the nation’s air quality and controlling sources of air emissions. These laws and regulations continue to be promulgated and implemented and will impact the operation of BHE’s generating facilities and require them to reduce emissions at those facilities to comply with the requirements.
Renewable portfolio standards have been established by certain state governments and generally require electricity providers to obtain a minimum percentage of their power from renewable energy resources by a certain date. Utah, Oregon, Washington, California, Iowa and Nevada have adopted renewable portfolio standards. In addition, the potential adoption of state or federal clean energy standards, which include low-carbon, non-carbon and renewable electricity generating resources, may also impact electricity generators and natural gas providers.
In December 2015, an international agreement was negotiated by 195 nations to create a universal framework for coordinated action on climate change in what is referred to as the Paris Agreement. The Paris Agreement reaffirms the goal of limiting global temperature increase well below 2 degrees Celsius, while urging efforts to limit the increase to 1.5 degrees Celsius; establishes commitments by all parties to make nationally determined contributions and pursue domestic measures aimed at achieving the commitments; commits all countries to submit emissions inventories and report regularly on their emissions and progress made in implementing and achieving their nationally determined commitments; and commits all countries to submit new commitments every five years, with the expectation that the commitments will get more aggressive. In the context of the Paris Agreement, the United States agreed to reduce greenhouse gas emissions 26% to 28% by 2025 from 2005 levels. The Paris Agreement formally entered into force November 4, 2016.
Supporting the United States’ commitment under the Paris Agreement was the Clean Power Plan, which was finalized by the U.S. Environmental Protection Agency (“EPA”) in August 2015. The Clean Power Plan established the Best System of Emission Reduction for fossil-fueled power plants to include: (a) heat rate improvements; (b) increased utilization of existing combined-cycle natural gas-fueled generating facilities; and (c) increased deployment of new and incremental non-carbon generation placed in service after 2012. The final Clean Power Plan compliance obligations were scheduled to begin in 2022, and extend through 2030. When fully implemented, the rule was intended to achieve an overall reduction in carbon dioxide emissions from existing fossil-fueled electric generating units of 32% below 2005 levels.
On June 1, 2017, President Trump announced that the United States would begin the process of withdrawing from the Paris Agreement. Under the terms of the Paris Agreement, withdrawal cannot occur until four years after entry into force, making the United States’ withdrawal effective in November 2020. The EPA issued a proposal to repeal the Clean Power Plan on October 10, 2017, which has not yet been finalized. On August 21, 2018, the EPA proposed the Affordable Clean Energy rule, which would replace the Clean Power Plan. The Affordable Clean Energy rule would determine that the best system of emissions reduction for existing coal fueled power plants is heat rate improvements and proposes a set of candidate technologies and measures that could improve heat rates. Measures taken to meet the standards of performance must be achieved at the source itself. The EPA received comments on the proposal through October 2018 and anticipates finishing the rule in spring 2019. The full impacts of the EPA’s recent efforts to repeal and replace the Clean Power Plan are not expected to have a material impact on BHE and its energy subsidiaries. Increasingly, states are adopting legislation and regulations to reduce greenhouse gas emissions, and local governments and consumers are seeking increasing amounts of clean and renewable energy.
BHE and its energy subsidiaries continue to focus on delivering reliable, affordable, safe and clean energy to its customers and on actions to mitigate greenhouse gas emissions. For example, through December 31, 2018, BHE’s cumulative investment in wind, solar, geothermal and biomass generation is approximately $25 billion.
Non-Energy Businesses
HomeServices of America, Inc. (“HomeServices”) is the second-largest residential real estate brokerage firm in the United States. In addition to providing traditional residential real estate brokerage services, HomeServices offers other integrated real estate services, including mortgage originations and mortgage banking, title and closing services, property and casualty insurance, home warranties, relocation services and other home-related services. It operates under 47 brand names with over 42,500 real estate agents in nearly 880 brokerage offices in 30 states and the District of Columbia.
K-9
Table of Contents
In October 2012, HomeServices acquired a 66.7% interest in one of the largest residential real estate brokerage franchise networks in the United States, which offers and sells independently owned and operated residential real estate brokerage franchises. In April 2018, HomeServices acquired the remaining 33.3% interest. HomeServices’ franchise network currently includes approximately 370 franchisees in nearly 1,600 brokerage offices throughout the United States and Europe with over 51,500 real estate agents under two brand names. In exchange for certain fees, HomeServices provides the right to use the Berkshire Hathaway HomeServices or Real Living brand names and other related service marks, as well as providing orientation programs, training and consultation services, advertising programs and other services.
HomeServices’ principal sources of revenue are dependent on residential real estate sales, which are generally higher in the second and third quarters of each year. This business is highly competitive and subject to the general real estate market conditions.
Manufacturing Businesses
Berkshire’s numerous and diverse manufacturing subsidiaries are grouped into three categories: (1) industrial products, (2) building products and (3) consumer products. Berkshire’s industrial products businesses manufacture specialty chemicals, metal cutting tools, components for aerospace and power generation applications, and a variety of other products primarily for industrial use. The building products group produces prefabricated and site built residential homes, flooring products, insulation, roofing and engineered products, building and engineered components, paint and coatings and bricks and masonry products, which are primarily used in building and construction applications. The consumer products group manufactures recreational vehicles, alkaline batteries, various apparel products, jewelry and custom picture framing products. Information concerning the major activities of these three groups follows.
Industrial products
Precision Castparts
Berkshire acquired Precision Castparts Corp. (“PCC”) on January 29, 2016. PCC manufactures complex metal components and products, provides high-quality investment castings, forgings, fasteners/fastener systems and aerostructures for critical aerospace and power and energy applications. PCC also manufactures seamless pipe for coal-fired, industrial gas turbine (“IGT”) and nuclear power plants; downhole casing and tubing, fittings and various mill forms in a variety of nickel and steel alloys for severe-service oil and gas environments; investment castings and forgings for general industrial, armament, medical and other applications; nickel and titanium alloys in all standard mill forms from large ingots and billets to plate, foil, sheet, strip, tubing, bar, rod, extruded shapes, rod-in-coil, wire and welding consumables, as well as cobalt alloys, for the aerospace, chemical processing, oil and gas, pollution control and other industries; revert management solutions; fasteners for automotive and general industrial markets; specialty alloys for the investment casting and forging industries; heat treating and destructive testing services for the investment cast products and forging industries; refiner plates and other products for the pulp and paper industry; grinder pumps and affiliated components for low-pressure sewer systems; critical auxiliary equipment and gas monitoring systems for the power generation industry; and metalworking tools for the fastener market and other applications.
Investment casting technology involves a multi-step process that uses ceramic molds in the manufacture of metal components with more complex shapes, closer tolerances and finer surface finishes than parts manufactured using other methods. PCC uses this process to manufacture products for aircraft engines, IGT’s and other aeroderivative engines, airframes, medical implants, armament, unmanned aerial vehicles and other industrial applications. PCC also manufactures high temperature carbon and ceramic composite components, including ceramic matrix composites, for use in next-generation aerospace engines.
PCC uses forging processes to manufacture components for the aerospace and power generation markets, including seamless pipe for coal-fired, industrial gas turbine and nuclear power plants, and downhole casings and tubing pipe for severe service oil and gas markets. PCC manufactures high-performance, nickel-based alloys used to produce forged components for aerospace and non-aerospace applications in such markets as oil and gas, chemical processing and pollution control. The titanium products are used to manufacture components for the commercial and military aerospace, power generation, energy, and industrial end markets.
PCC is also a leading developer and manufacturer of highly engineered fasteners, fastener systems, aerostructures and precision components, primarily for critical aerospace applications. These products are produced for the aerospace and power and energy markets, as well as for construction, automotive, heavy truck, farm machinery, mining and construction equipment, shipbuilding, machine tools, medical equipment, appliances and recreation markets.
The majority of PCC’s sales are from purchase orders or demand schedules pursuant to long-term agreements. Contractual terms may provide for termination by the customer, subject to payment for work performed. PCC typically does not experience significant order cancellations, although periodically it receives requests for delays in delivery schedules.
K-10
Table of Contents
PCC is subject to substantial competition in all of its markets. Components and similar products may be produced by competitors, who use either the same types of manufacturing processes as PCC or other processes. Although PCC believes its manufacturing processes, technology and experience provide advantages to its customers, such as high quality, competitive prices and physical properties that often meet more stringent demands, alternative forms of manufacturing can be used to produce many of the same components and products. Despite intense competition, PCC is a leading supplier in most of its principal markets. Several factors, including long-standing customer relationships, technical expertise, state-of-the-art facilities and dedicated employees, aid PCC in maintaining competitive advantages.
A number of raw materials in its products, including certain metals such as nickel, titanium, cobalt, tantalum and molybdenum, are found in only a few parts of the world. These metals are required for the alloys used in manufactured products. The availability and costs of these metals may be influenced by private or governmental cartels, changes in world politics, labor relations between the metal producers and their work forces, and/or unstable governments in exporting nations and inflation.
Lubrizol Corporation
The Lubrizol Corporation (“Lubrizol”) is a specialty chemical company that produces and supplies technologies for the global transportation, industrial and consumer markets. Lubrizol currently operates in two business sectors: (1) Lubrizol Additives, which includes engine additives, driveline additives and industrial specialties products; and (2) Lubrizol Advanced Materials, which includes personal and home care, engineered polymers, performance coatings, skin care and life science solutions.
Lubrizol Additives products are used in a broad range of applications including engine oils, transmission fluids, gear oils, specialty driveline lubricants, fuel additives, metalworking fluids, compressor lubricants and greases for transportation and industrial applications. Lubrizol’s Advanced Materials products are used in several different types of applications including over-the-counter pharmaceutical products, performance coatings, personal care products, sporting goods and plumbing and fire sprinkler systems. Lubrizol is an industry leader in many of the markets in which it competes. Lubrizol’s principal lubricant additives competitors are Infineum International Ltd., Chevron Oronite Company and Afton Chemical Corporation. The advanced materials industry is highly fragmented with a variety of competitors in each product line.
From a base of approximately 3,500 patents, Lubrizol uses its technological leadership position in product development and formulation expertise to improve the quality, value and performance of its products, as well as to help minimize the environmental impact of those products. Lubrizol uses many specialty and commodity chemical raw materials in its manufacturing processes and uses base oil in processing and blending additives. Raw materials are primarily feedstocks derived from petroleum and petrochemicals and, generally, are obtainable from several sources. The materials that Lubrizol chooses to purchase from a single source typically are subject to long-term supply contracts to ensure supply reliability. Lubrizol operates facilities in 27 countries (including production facilities in 17 countries and laboratories in 13 countries).
Lubrizol markets its products worldwide through a direct sales organization and sales agents and distributors. Lubrizol’s customers principally consist of major global and regional oil companies and industrial and consumer products companies that are located in more than 120 countries. Some of its largest customers also may be suppliers. In 2018, no single customer accounted for more than 10% of Lubrizol’s consolidated revenues. Lubrizol continues to implement a multi-year phased investment plan to upgrade operations, ensure compliance with health, safety and environmental requirements and increase global manufacturing capacity.
Lubrizol is subject to foreign, federal, state and local laws to protect the environment and limit manufacturing waste and emissions. The company believes that its policies, practices and procedures are designed to limit the risk of environmental damage and consequent financial liability. Nevertheless, the operation of manufacturing plants entails ongoing environmental risks, and significant costs or liabilities could be incurred in the future.
IMC International Metalworking Companies
IMC International Metalworking Companies (“IMC”) is one of the world’s three largest multinational manufacturers of consumable precision carbide metal cutting tools for applications in a broad range of industrial end markets. IMC’s principal brand names include ISCAR®, TaeguTec®, Ingersoll®, Tungaloy®, Unitac®, UOP®, It.te.di®, Qutiltec®, Tool—Flo® and PCT. IMC’s primary manufacturing facilities are located in Israel, United States, Germany, Italy, France, Switzerland, South Korea, China, India, Japan and Brazil.
K-11
Table of Contents
IMC has five primary product lines: milling tools, gripping tools, turning/thread tools, drilling tools and tooling. The main products are split within each product line between consumable cemented tungsten carbide inserts and steel tool holders. Inserts comprise the vast majority of sales and earnings. Metal cutting inserts are used by industrial manufacturers to cut metals and are consumed during their use in cutting applications. IMC manufactures hundreds of types of highly engineered inserts within each product line that are tailored to maximize productivity and meet the technical requirements of customers. IMC’s staff of scientists and engineers continuously develop and innovate products that address end user needs and requirements.
IMC’s global sales and marketing network operates in virtually every major manufacturing center around the world staffed with highly skilled engineers and technical personnel. IMC’s customer base is very diverse, with its primary customers being large, multinational businesses in the automotive, aerospace, engineering and machinery industries. IMC operates a regional central warehouse system with locations in Israel, United States, Belgium, Korea, Japan and Brazil. Additional small quantities of products are maintained at local IMC offices in order to provide on-time customer support and inventory management.
IMC competes in the metal cutting tools segment of the global metalworking tools market. The segment includes hundreds of participants who range from small, private manufacturers of specialized products for niche applications and markets to larger, global multinational businesses (such as Sandvik and Kennametal, Inc.) with a wide assortment of products and extensive distribution networks. Other manufacturing companies such as Kyocera, Mitsubishi, Sumitomo, Ceratizit and Korloy also play a significant role in the cutting tool market.
Marmon Holdings
Marmon Holdings, Inc. (“Marmon”) is a global industrial organization comprising 13 diverse business sectors and more than 100 autonomous manufacturing and service businesses. Marmon’s manufacturing and service operations employ over 20,000 employees at approximately 400 manufacturing, distribution, and service facilities located primarily in the United States, as well as 21 other countries worldwide. Marmon’s business sectors are described as follows.
Beverage Technologies manufactures beverage dispensing and cooling equipment, and related products for global brand owners and foodservice retailers. Operations are based in the U.S. with manufacturing in China, India, the U.K. and Germany. Products are sold primarily throughout the U.S., Europe, and Asia.
Foodservice Technologies manufactures hot and cold food preparation and holding equipment for restaurants, cafeterias, hotels, caterers, and other foodservice providers worldwide. Operations are based in the U.S., with manufacturing in China and Italy. Products are sold primarily throughout the U.S., Europe, and Asia.
Water Technologies manufactures water treatment equipment for residential, commercial, and industrial applications worldwide. Operations are based primarily in the U.S., Canada, China, Singapore, India, and Mexico with business centers located in Belgium, France, Poland, Germany, the U.K., Italy, Switzerland, and U.A.E.
Transportation Products serves the automotive, heavy-duty highway transportation, and aerospace industries with precision-molded plastic components; fastener thread solutions; metal tubing; auto aftermarket transmission and chassis products; platform trailers; and truck and trailer components. Operations and business are conducted primarily in the U.S., Mexico, Canada, Europe, and Asia.
Retail Solutions provides retail environment design services; in-store digital merchandising and display fixtures; shopping, material handling, and security carts; and consumer products, including air compressors and extension cords. Operations are based in the U.S. and conducted primarily in the U.S., U.K., Czech Republic, and China.
Metal Services provides specialty metal pipe, tubing, beams and related value-added services to customers across a broad range of industries. Operations are based in the U.S., Canada, and Mexico and conducted primarily in those countries.
Engineered Wire & Cable produces electrical and electronic wire and cable for use in energy, transit, aerospace, defense, communication, and other industrial applications. Operations are based in the U.S., Canada, India, and England. Business is conducted globally, primarily in the U.S., Canada, India, U.K., U.A.E., and China.
Electrical Products produces electrical wire and cable for use in utility applications and residential and commercial buildings; and portable lighting equipment for mining and safety markets. Operations are based in the U.S. and business is conducted primarily in the U.S. and Canada.
Plumbing & Refrigeration supplies copper, aluminum, and stainless steel tubing and fittings for the plumbing, HVAC, and refrigeration markets; and aluminum and brass forgings for many commercial and industrial applications. Business and operations are conducted primarily in the U.S.
K-12
Table of Contents
Industrial Products supplies construction fasteners; gloves and other protective wear; gear drives, gearboxes, fan drives, and pump drives for various markets; wind machines for agricultural use; and wheels, axles, and gears for rail, mining, and other applications. Operations are based in the U.S. and business is conducted primarily in the U.S., Canada, and China.
Rail Products and Services manufactures, leases, and maintains railcars; manufactures mobile railcar movers; provides in-plant rail switching and loading services; performs track construction and maintenance; and manufactures steel tank heads and cylinders. Union Tank Car Company (“UTLX”) is the largest component of Rail Products and Services and is a leading designer, builder, and full-service lessor of railroad tank cars and other specialized railcars. Together with its Canadian affiliate Procor, UTLX owns a fleet of approximately 130,000 railcars for lease to customers in chemical, petrochemical, energy, and agricultural/food industries. UTLX manufactures tank cars at two U.S. plants and performs railcar maintenance services at more than 100 locations across North America.
UTLX has a diversified customer base, both geographically and across industries. UTLX, while subject to cyclicality and significant competition in most of its markets, competes by offering a broad range of high-quality products and services targeted at its niche markets. Railcars are typically leased for multiple-year terms and most of the leases are renewed upon expiration. Due to selective ongoing capital investment, utilization rates (the number of railcars on lease to total available) of the railcar fleet are generally high. Following the downturn of oil and gas markets in recent years, renewal rental rates have declined for some railcar types and has resulted in a decline in utilization, which has had a meaningful impact on UTLX’s results. While tank car specifications are highly regulated in North America, regulatory changes are not expected to materially affect UTLX’s operating results, competitive position, or financial strength.
Intermodal Containers leases intermodal tank containers through EXSIF Worldwide. EXSIF is a leading international lessor of intermodal tank containers with a fleet of approximately 60,000 units, primarily serving chemical producers and logistics operators.
Crane Services is a provider of mobile cranes and operators. Sterling Crane (located in Canada and the U.S.), Freo Group, and WGC Cranes (both located in Australia), operate a combined fleet of approximately 1,000 cranes primarily serving the energy, mining, and petrochemical markets.
Other industrial products
CTB International Corp. (“CTB”), headquartered in Milford, Indiana, is a leading global designer, manufacturer and marketer of a wide range of agricultural systems and solutions for preserving grain, producing poultry, pigs and eggs, and for processing poultry, fish, vegetables and other foods. CTB operates from facilities located around the globe and supports customers through a worldwide network of independent distributors and dealers.
CTB competes with a variety of manufacturers and suppliers, many of which offer only a limited number of the products offered by CTB and two of which offer products across many of CTB’s product lines. Competition is based on the price, value, reputation, quality and design of the products offered and the customer service provided by distributors, dealers and manufacturers of the products. CTB’s leading brand names, distribution network, diversified product line, product support and high-quality products enable it to compete effectively. CTB manufactures its products primarily from galvanized steel, steel wire, stainless steel and polymer materials and supplies of these materials have been sufficient in recent years.
In 2014, Berkshire acquired a global supplier of pipeline flow improver products from Phillips 66. The business, headquartered in Houston, Texas, was named Phillips Specialty Products, Inc. at the time of the acquisition and is currently named LiquidPower Specialty Products Inc. (“LSPI”). LSPI specializes in maximizing the flow potential of pipelines, increasing operational flexibility and throughput capacity. The Scott Fetzer companies are a group of businesses that manufacture, distribute, service and finance a wide variety of products for residential, industrial and institutional use.
Berkshire’s industrial products manufacturers employ approximately 81,000 persons.
K-13
Table of Contents
Building Products
Clayton Homes
Clayton Homes, Inc. (“Clayton”), headquartered near Knoxville, Tennessee, is a vertically integrated housing company utilizing manufactured, modular and site built methods. Clayton’s homes are marketed in 48 states through a network of 2,149 retailers, including 366 company-owned home centers and 280 subdivisions. Home finance and insurance products are offered through its subsidiaries primarily to purchasers of manufactured and modular homes.
Clayton acquired its first site builder in 2015 and, thereafter, added seven additional site builders. Clayton delivered 51,569 homes in 2018 at various price points. Clayton competes based on price, service, delivery capabilities and product performance and considers the ability to make financing available to retail purchasers a factor affecting the market acceptance of its products.
Clayton’s financing programs support company-owned home centers and select independent retailers. Proprietary loan underwriting guidelines have been developed and include ability to repay calculations, including debt to income limits, consideration of residual income and credit score requirements, which are considered in evaluating loan applicants. Currently, approximately 61% of the loan originations are home-only loans and the remaining 39% have land as additional collateral. The average down payment is approximately 15%, which may be from cash, trade or land equity. Certain loan types require an independent third-party appraisal. Originated loans are at fixed rates and for fixed terms. Loans outstanding include non-government originations, bulk purchases of contracts and notes from banks and other lenders. Clayton also provides inventory financing to certain independent retailers and community operators and services housing contracts and notes that were not purchased or originated. The bulk contract purchases and servicing arrangements may relate to the portfolios of other lenders or finance companies, governmental agencies, or other entities that purchase and hold housing contracts and notes. Clayton also acts as an agent on physical damage insurance policies, homebuyer protection plan policies and other programs.
Shaw Industries
Shaw Industries Group, Inc. (“Shaw”), headquartered in Dalton, Georgia, is a leading carpet manufacturer based on both revenue and volume of production. Shaw designs and manufactures over 3,900 styles of tufted carpet, wood and resilient flooring for residential and commercial use under about 30 brand and trade names and under certain private labels. Shaw also provides project management and installation services. Shaw’s manufacturing operations are fully integrated from the processing of raw materials used to make fiber through the finishing of carpet. In 2018, Shaw acquired Sanquahar Tile Services in Scotland, which manufactures and distributes carpet tile throughout Europe. Shaw also manufactures or distributes a variety of hardwood, vinyl and laminate floor products (“hard surfaces”). In 2016, Shaw acquired USFloors, Inc., which is a leading innovator and marketer of wood-plastic composite luxury vinyl tile flooring, as well as cork, bamboo and hardwood products. Shaw’s carpet and hard surface products are sold in a broad range of patterns, colors and textures. Shaw operates Shaw Sports Turf and Southwest Greens International, LLC, which provide synthetic sports turf, golf greens and landscape turf products.
Shaw products are sold wholesale to over 39,000 retailers, distributors and commercial users throughout the United States, Canada and Mexico and are also exported to various overseas markets. Shaw’s wholesale products are marketed domestically by over 2,700 salaried and commissioned sales personnel directly to retailers and distributors and to large national accounts. Shaw’s seven carpet, seven hard surface and two sample full-service distribution facilities and 26 redistribution centers, along with centralized management information systems, enable it to provide prompt and efficient delivery of its products to both its retail customers and wholesale distributors.
Substantially all carpet manufactured by Shaw is tufted carpet made from nylon, polypropylene and polyester. In the tufting process, yarn is inserted by multiple needles into a synthetic backing, forming loops, which may be cut or left uncut, depending on the desired texture or construction. During 2018, Shaw processed approximately 95% of its requirements for carpet yarn in its own yarn processing facilities. The availability of raw materials continues to be good but costs are impacted by petro-chemical and natural gas price changes. Raw material cost changes are periodically factored into selling prices to customers.
The floor covering industry is highly competitive with more than 100 companies engaged in the manufacture and sale of carpet in the United States and numerous manufacturers engaged in hard surface floor covering production and sales. According to industry estimates, carpet accounts for approximately 50% of the total United States consumption of all flooring types. The principal competitive measures within the floor covering industry are quality, style, price and service.
K-14
Table of Contents
Johns Manville
Johns Manville (“JM”) is a leading manufacturer and marketer of premium-quality products for building, mechanical and industrial insulation, commercial roofing and roof insulation, as well as engineered fibers and nonwovens for commercial, industrial and residential applications. JM serves markets that include building, flooring, interiors, aerospace, automotive and transportation, air handling, appliance, HVAC, pipe insulation, filtration, waterproofing and wind energy. Fiberglass is the basic material in a majority of JM’s products, although JM also manufactures a significant portion of its products with other materials to satisfy the broader needs of its customers. Raw materials are readily available in sufficient quantities from various sources for JM to maintain and expand its current production levels. JM regards its patents and licenses as valuable, however it does not consider any of its businesses to be materially dependent on any single patent or license. JM is headquartered in Denver, Colorado, and operates 43 manufacturing facilities in North America, Europe and China and conducts research and development at its technical center in Littleton, Colorado and at other facilities in the U.S. and Europe.
Fiberglass is made from earthen raw materials and recycled glass, together with proprietary organic and acrylic-based formaldehyde-free agents to bind many of its glass fibers. JM’s products also contain materials other than fiberglass, including various chemical and petro-chemical-based materials used in roofing and other specialized products. JM uses recycled material when available and suitable to satisfy the broader needs of its customers. The raw materials used in these various products are readily available in sufficient quantities from various sources to maintain and expand its current production levels.
JM’s operations are subject to a variety of federal, state and local environmental laws and regulations, which regulate the discharge of materials into the air, land and water and govern the use and disposal of hazardous substances. The most relevant of the federal laws are the Federal Clean Air Act, the Clean Water Act, the Toxic Substances Control Act, the Resource Conservation and Recovery Act and the Comprehensive Environmental Response, Compensation and Liability Act of 1980, which are administered by the EPA. In 2015, the EPA revised the hazardous air pollutant rules for the wool fiberglass and mineral wool manufacturing industries, which were further revised in 2017. While the new rules implement new emission standards, they are not expected to require material expenditures to meet the compliance dates in 2020.
JM sells its products through a wide variety of channels including contractors, distributors, retailers, manufacturers and fabricators. JM operates in highly competitive markets, with competitors comprised primarily of several large global and national manufacturers and smaller regional manufacturers. JM holds leadership positions in the key markets that it serves. JM’s products compete primarily on value, differentiation and customization, and breadth of product line. Sales of JM’s products are moderately seasonal due to increases in construction activity that typically occur in the second and third quarters of the calendar year. JM sees a marketplace trend in customer purchasing decisions being influenced by the sustainable and energy efficient attributes of its products, services and operations.
MiTek Industries, Inc.
MiTek Industries, Inc. (“MiTek”), based in Chesterfield, Missouri, operates in three separate markets: residential, commercial and industrial. MiTek operates worldwide with sales in over 100 countries and with manufacturing facilities and/or sales/engineering offices located in 21 countries. MiTek has completed a number of bolt-on acquisitions in the past five years, intended to diversify product offerings and reduce the impact of the cyclical global housing markets.
In the residential market, MiTek is a leading supplier of engineered connector products, construction hardware, engineering software and services and computer-driven manufacturing machinery to the truss component market of the building components industry. MiTek’s primary customers are component manufacturers who manufacture prefabricated roof and floor trusses and wall panels for the residential building market. MiTek also sells construction hardware to commercial distributors and do-it-yourself retail stores under the MiTek Builders Products name.
MiTek’s commercial market business includes products and services sold to the commercial construction industry offered through its subsidiaries. Commercial products include curtain wall systems (Benson Industries, Inc.), masonry and stone anchoring systems (Hohmann & Barnard, Inc.), light gauge steel framing products (Aegis Metal Framing Division of MiTek USA, Inc.), engineering services for a proprietary high-performance steel frame connection (SidePlate Systems, Inc.) and a comprehensive range of ductwork for the ventilation market (M&M Manufacturing, Inc. and Snappy ADP, Inc.).
MiTek’s industrial market business includes products offered through its subsidiaries, including automated machinery used by battery manufacturers (TBS Engineering, Ltd.), customized air handling systems for commercial, institutional and industrial markets (TMI Climate Solutions, Inc.), design and supply of Nuclear Safety Related HVAC systems and components (Ellis & Watts Global Industries, Inc.), energy recovery and dehumidification systems for commercial applications (Heat-Pipe Technology, Inc.) and pre-engineered and pre-fabricated custom structural mezzanines and platforms for distribution and manufacturing facilities (Cubic Designs, Inc. and Mezzanine International, Ltd.).
K-15
Table of Contents
A significant raw material used by MiTek is hot dipped galvanized sheet steel. While supplies are presently adequate, variations in supply have historically occurred, producing significant variations in cost and availability.
MiTek commenced reorganizing efforts in 2019 to focus on a “One MiTek” brand, operating as one global company operating in two sectors, residential and commercial. Within the sectors, the business will be further managed based on market channels or product categories. The reorganization is expected to provide customers with more targeted solutions and produce a more simplified, efficient and better-integrated organizational structure.
Benjamin Moore
Benjamin Moore & Co. (“Benjamin Moore”), headquartered in Montvale, New Jersey, is a leading formulator, manufacturer and retailer of a broad range of architectural coatings, available principally in the United States and Canada. Products include water-based and solvent-based general-purpose coatings (paints, stains and clear finishes) for use by consumers, contractors and industrial and commercial users. Products are marketed under various registered brand names, including, but not limited to: Aura®, Natura®, Regal Select®, Ultra Spec®, ben®, Eco Spec®, Coronado®, Corotech®, Insl-x®, Lenmar®, Super Kote®, Arborcoat®, Super Hide®, Century®, Ultra Spec®, SCUFF-X® and Notable®™.
Benjamin Moore relies primarily on an independent dealer network for distribution of its products. Benjamin Moore’s distribution network includes over 3,300 independent retailers currently representing over 5,000 storefronts in the United States and Canada. The independent dealer channel offers a broad array of products including Benjamin Moore®, Coronado® and Insl-x® brands and other competitor coatings, wall coverings, window treatments and sundries. In addition, Benjamin Moore operates an on-line “pick up in store” program, which allows consumers to place orders via an e-commerce site, or for national accounts and government agencies via its customer information center, for pick-up at the customer’s nearest dealer.
Benjamin Moore competes with numerous manufacturers, distributors and paint, coatings and related products retailers. Product quality, product innovation, breadth of product line, technical expertise, service and price determine the competitive advantage. Competitors include other paint and decorating stores, mass merchandisers, home centers, independent hardware stores, hardware chains and manufacturer-operated direct outlets, such as Sherwin-Williams Company, PPG Industries, Inc., The Valspar Corporation, The Home Depot, Inc. and Lowe’s Companies, Inc.
The most significant raw materials in Benjamin Moore products are titanium dioxide, monomers, polymers and pigments. Historically, these materials have been generally available, with pricing and availability subject to fluctuation.
Acme Brick
Acme Brick Company and its subsidiaries (“Acme”), headquartered in Fort Worth, Texas, manufactures and distributes clay bricks (Acme Brick®) and concrete block (Featherlite). In addition, Acme distributes a number of other building products of other manufacturers, including floor and wall tile, wood flooring and other masonry products. Products are sold primarily in the South Central and South Eastern United States through company-operated sales offices. Acme distributes products primarily to homebuilders and masonry and general contractors.
In 2018, Acme commenced the closings of two brick plants, three concrete block plants and two limestone fabricating plants. Thereafter, Acme will operate 15 clay brick manufacturing facilities at 12 sites located in seven states and three concrete block facilities in Texas. In addition, Acme operates an aluminum grid fabrication facility and a concrete bagging facility in Texas. The demand for Acme’s products is seasonal, with higher sales in the warmer weather months, and is subject to the level of construction activity, which is cyclical. Acme also owns and leases properties and mineral rights that supply raw materials used in many of its manufactured products. Acme’s raw materials supply is believed to be adequate.
The brick industry is subject to the EPA’s Maximum Achievable Control Technology Rule (MACT Rule) finalized in October of 2015 with a deadline for compliance of December 31, 2018. Key elements of the MACT Rule include emission limits established for certain hazardous air pollutants and acidic gases. The MACT Rule also establishes work practices for “periodic” kilns, including using a designed firing time and temperature for each product, labeling maximum loads, keeping a log of each load, and developing and implementing inspection and maintenance procedures. While many of Acme’s facilities are in compliance, additional capital expenditures may be required to bring other facilities into compliance. Acme applied for and was granted an extension of the compliance deadline until the pending state permits are received, or until December 26, 2019, whichever is sooner.
Berkshire’s building products manufacturers employ approximately 57,000 people.
K-16
Table of Contents
Consumer Products
Apparel
Fruit of the Loom (“FOL”), headquartered in Bowling Green, Kentucky, is primarily a manufacturer and distributor of basic apparel, underwear, casualwear, athletic apparel and sports equipment. Products under the Fruit of the Loom® and JERZEES® labels are primarily sold in the mass merchandise, mid-tier chains and wholesale markets. In the Vanity Fair Brands product line, Vassarette®, Curvation® and Radiant® by Vanity Fair are sold in the mass merchandise market, while Vanity Fair® and Lily of France® products are sold to mid-tier chains and department stores. FOL also markets and sells apparel, sports equipment and balls to team dealers and athletic apparel, sports equipment and balls to sporting goods retailers under the Russell Athletic® and Spalding® brands. Additionally, Spalding® markets and sells balls and sports equipment in the mass merchandise market and dollar store channels. In 2018, approximately 55% of FOL’s sales were to five customers.
FOL generally performs its own knitting, cloth finishing, cutting, sewing and packaging for apparel. For the North American market, which is FOL’s predominant sales region, the majority of FOL’s cloth manufacturing is performed in Honduras. Labor-intensive cutting, sewing and packaging operations are located in Central America, the Caribbean and Vietnam. For the European market, products are either sourced from third-party contractors in Europe or Asia or sewn in Morocco from textiles internally produced in Morocco. Manufacturing of bras, athletic equipment, sporting goods and other athletic apparel lines are generally sourced from third-party contractors located primarily in Asia.
U.S. grown cotton and polyester fibers are the main raw materials used in the manufacturing of FOL’s apparel products and are purchased from a limited number of third-party suppliers. Additionally in 2015, FOL entered into an eight year agreement with one key supplier to provide the majority of FOL’s yarn. Management currently believes there are readily available alternative sources of raw materials and yarn. However, if relationships with suppliers cannot be maintained or delays occur in obtaining alternative sources of supply, production could be adversely affected, which could have a corresponding adverse effect on results of operations. Additionally, raw materials are subject to price volatility caused by weather, supply conditions, government regulations, economic climate and other unpredictable factors. FOL has secured contracts to purchase cotton, either directly or through the yarn suppliers, to meet the majority of its production plans for 2019. FOL’s markets are highly competitive, consisting of many domestic and foreign manufacturers and distributors. Competition is generally based upon product features, quality, customer service and price.
Garan designs, manufactures, imports and sells apparel primarily for children, including boys, girls, toddlers and infants. Products are sold under its own trademark Garanimals® and customer private label brands. Garan also licenses its registered trademark Garanimals® to third parties for apparel and non-apparel products. Garan conducts its business through operating subsidiaries located in the United States, Central America and Asia. Garan’s products are sold through its distribution centers in the United States. Fechheimer Brothers manufactures, distributes and sells uniforms, principally for the public service and safety markets, including police, fire, postal and military markets. Fechheimer Brothers is based in Cincinnati, Ohio.
The BH Shoe Holdings Group manufactures and distributes work, rugged outdoor and casual shoes and western-style footwear under a number of brand names, including Justin, Original Work, Tony Lama®, Chippewa®, BØRN® , B•Ø•C®, Carolina®, EuroSofft, Söfft, Double-H Boots®, Nursemates® and Comfortiva®. Brooks Sports markets and sells performance running footwear and apparel to specialty and national retailers and directly to consumers under the Brooks® brand. A significant volume of the shoes sold by Berkshire’s shoe businesses are manufactured or purchased from sources located outside the United States. Products are sold worldwide through a variety of channels including department stores, footwear chains, specialty stores, catalogs and the Internet, as well as through company-owned retail stores.
Other consumer products
Forest River, Inc. (“Forest River”) is a manufacturer of recreational vehicles (“RV”), utility cargo trailers, buses and pontoon boats, headquartered in Elkhart, Indiana with products sold in the United States and Canada through an independent dealer network. Forest River has numerous manufacturing facilities located in six states. Forest River is a leading manufacturer of RVs with numerous brand names, including Forest River, Coachman RV and Prime Time. Utility cargo trailers are sold under a variety of brand names. Buses are sold under several brand names, including Starcraft Bus. Pontoon boats are sold under the Berkshire, South Bay and Trifecta brand names. The RV industry is very competitive. Competition is based primarily on price, design, quality and service. The industry has consolidated over the past several years with Forest River holding a market share of approximately 33% in 2018 and its largest competitor holding a market share of approximately 48%.
K-17
Table of Contents
Berkshire acquired the Duracell Company (“Duracell’), on February 29, 2016 from The Procter & Gamble Company. Duracell, headquartered in Chicago, Illinois, is a leading manufacturer of high performance alkaline batteries. Duracell manufactures batteries in the U.S., Europe and China and provides a network of worldwide sales and distribution centers. Costco and Walmart are significant customers, representing approximately 25% of Duracell’s annual revenue. There are several competitors in the battery manufacturing market with Duracell holding an approximately 34% market share of the global alkaline battery market. Management believes there are sufficient sources of raw materials, which primarily include steel, zinc and manganese.
Albecca Inc. (“Albecca”), headquartered in Norcross, Georgia, operates in the U.S., Canada and 13 other countries, with products primarily under the Larson-Juhl® name. Albecca designs, manufactures and distributes a complete line of high quality, branded custom framing products, including wood and metal moulding, matboard, foamboard, glass and framing supplies. Complementary to its framing products, Albecca offers art printing and fulfillment services.
Richline Group, Inc. operates four strategic business units: Richline Jewelry, LeachGarner, Rio Grande and Inverness. Each business unit is a manufacturer and distributor of jewelry with precious metal and non-precious metal products to specific target markets including large jewelry chains, department stores, shopping networks, mass merchandisers, e-commerce retailers and artisans plus worldwide manufacturers and wholesalers and the medical, electronic and aerospace industries.
Berkshire’s consumer products manufacturers employ approximately 55,000 persons.
Service and Retailing Businesses
Service Businesses
Berkshire’s service businesses provide grocery and foodservice distribution, professional aviation training programs, fractional aircraft ownership programs and distribution of electronic components. Other service businesses include franchising and servicing of quick service restaurants, media businesses (newspaper, television and information distribution), as well as logistics businesses. Berkshire’s service businesses employ approximately 51,000 people. Information concerning these activities follows.
McLane Company
McLane Company, Inc. (“McLane”) provides wholesale distribution services in all 50 states to customers that include convenience stores, discount retailers, wholesale clubs, drug stores, military bases, quick service restaurants and casual dining restaurants. McLane provides wholesale distribution services to Walmart, which accounts for approximately 22% of McLane’s revenues. McLane’s other significant customers include 7-Eleven and Yum! Brands, each of which accounted for approximately 11% of McLane’s revenues in 2018. A curtailment of purchasing by Walmart or its other significant customers could have a material adverse impact on McLane’s periodic revenues and earnings. McLane’s business model is based on a high volume of sales, rapid inventory turnover and stringent expense controls. Operations are currently divided into three business units: grocery distribution, foodservice distribution and beverage distribution.
McLane’s grocery distribution unit, based in Temple, Texas, maintains a dominant market share within the convenience store industry and serves most of the national convenience store chains and major oil company retail outlets. Grocery operations provide products to approximately 50,000 retail locations nationwide, including Walmart. McLane’s grocery distribution unit operates 23 distribution facilities in 20 states.
McLane’s foodservice distribution unit, based in Carrollton, Texas, focuses on serving the quick service and casual dining restaurant industry with high quality, timely-delivered products. Operations are conducted through 47 facilities in 22 states. The foodservice distribution unit services approximately 35,200 restaurants nationwide.
Through its subsidiaries, McLane also operates several wholesale distributors of distilled spirits, wine and beer. Operations are conducted through 14 distribution centers in Georgia, North Carolina, Tennessee and Colorado. These beverage units operating as Empire Distributors, Empire Distributors of North Carolina, Empire Distributors of Tennessee and Baroness Small Estates, service approximately 25,300 retail locations in the Southeastern United States and Colorado.
K-18
Table of Contents
FlightSafety International
FlightSafety International Inc. (“FlightSafety”), headquartered at New York’s LaGuardia Airport, is an industry leader in professional aviation training services to individuals, businesses (including certain commercial aviation companies) and the U.S. government and certain foreign governments. FlightSafety provides high technology training to pilots, aircraft maintenance technicians, flight attendants and dispatchers who operate and support a wide variety of business, commercial and military aircraft. FlightSafety operates a large fleet of advanced full flight simulators at its learning centers and training locations in the United States, Canada, China, France, Japan, Norway, Singapore, South Africa, the Netherlands, and the United Kingdom. The vast majority of FlightSafety’s instructors, training programs and flight simulators are qualified by the United States Federal Aviation Administration and other aviation regulatory agencies around the world.
FlightSafety is also a leader in the design and manufacture of full flight simulators, visual systems, displays and other advanced technology training devices. This equipment is used to support FlightSafety training programs and is offered for sale to airlines and government and military organizations around the world. Manufacturing facilities are located in Oklahoma, Missouri and Texas. FlightSafety strives to maintain and manufacture simulators and develop courseware using state-of-the-art technology and invests in research and development as it builds new equipment and training programs.
NetJets
NetJets Inc. (“NetJets”) is the world’s leading provider of shared ownership programs for general aviation aircraft. NetJets’ global headquarters is located in Columbus, Ohio, with most of its logistical and flight operations based at Port Columbus International Airport. NetJets’ European operations are based in Lisbon, Portugal. The shared ownership concept is designed to meet the travel needs of customers who require the scale, flexibility and access of a large fleet that whole aircraft ownership cannot deliver. In addition, shared ownership programs are available for corporate flight departments seeking to outsource their general aviation needs or add capacity for peak periods and for others that previously chartered aircraft.
With a focus on safety and service, NetJets’ programs are designed to offer customers guaranteed availability of aircraft, predictable operating costs and increased liquidity. NetJets’ shared aircraft ownership programs permit customers to acquire a specific percentage of a certain aircraft type and allows customers to utilize the aircraft for a specified number of flight hours annually. In addition, NetJets offers prepaid flight cards and other aviation solutions and services for aircraft management, customized aircraft sales and acquisition, ground support and flight operation services under a number of programs including NetJets Shares™, NetJets Leases™ and the Marquis Jet Card®.
NetJets is subject to the rules and regulations of the United States Federal Aviation Administration, the National Institute of Civil Aviation of Portugal and the European Aviation Safety Agency. Regulations address aircraft registration, maintenance requirements, pilot qualifications and airport operations, including flight planning and scheduling as well as security issues and other matters.
TTI, Inc.
TTI, Inc. (“TTI”), headquartered in Fort Worth, Texas, is a global specialty distributor of passive, interconnect, electromechanical, and discrete components used by customers in the manufacturing and assembling of electronic products. TTI’s customer base includes original equipment manufacturers, electronic manufacturing services, original design manufacturers, military and commercial customers, as well as design and system engineers. TTI’s distribution agreements with the industry’s leading suppliers allow it to uniquely leverage its product cost and to expand its business by providing new lines and products to its customers. TTI operates sales offices and distribution centers from more than 100 locations throughout North America, Europe, Asia and Israel.
TTI services a variety of industries including telecommunications, medical devices, computers and office equipment, military/ aerospace, automotive and industrial electronics. TTI’s core customers include businesses in the design through production stages in the electronic component supply chain, which supports its high volume business, and its Mouser subsidiary, which supports a broader base of customers with lower volume purchases through internet based marketing.
K-19
Table of Contents
Other
XTRA Corporation (“XTRA”), headquartered in St. Louis, Missouri, is a leading transportation equipment lessor operating under the XTRA Lease® brand name. XTRA manages a diverse fleet of approximately 82,000 units located at 51 facilities throughout the United States. The fleet includes over-the-road and storage trailers, chassis, temperature controlled vans and flatbed trailers. XTRA is one of the largest lessors (in terms of units available) of over-the-road trailers in North America. Transportation equipment customers lease equipment to cover cyclical, seasonal and geographic needs and as a substitute for purchasing equipment. Therefore, as a provider of marginal capacity to its customers, XTRA’s utilization rates and operating results tend to be cyclical. In addition, transportation providers often use leasing to maximize their asset utilization and reduce capital expenditures. By maintaining a large fleet, XTRA is able to provide customers with a broad selection of equipment and quick response times.
International Dairy Queen develops and services a worldwide system of over 6,900 stores operating primarily under the names DQ Grill and Chill®, Dairy Queen® and Orange Julius® that offer various dairy desserts, beverages, prepared foods and blended fruit drinks. Business Wire provides electronic dissemination of full-text news releases to the media, online services and databases and the global investment community in 150 countries and in 45 languages. Approximately 97% of Business Wire’s revenues derive from its core news distribution business. CORT Business Services Corporation is a leading national provider of rental relocation services including rental furniture, accessories and related services in the “rent-to-rent” market of the furniture rental industry. The Buffalo News and BH Media Group, Inc. are publishers of 31 daily and 43 weekly newspapers. WPLG, Inc. is an ABC affiliate broadcast station in Miami, Florida and Charter Brokerage is a leading non-asset based third party logistics provider to the petroleum and chemical industries.
Retailing Businesses
Berkshire’s retailing businesses include automotive, home furnishings and several other operations that sell various consumer products to consumers. Information regarding each of these operations follows. Berkshire’s retailing businesses employ approximately 29,000 people.
Berkshire Hathaway Automotive
Berkshire acquired a group of affiliated companies referred to as the Berkshire Hathaway Automotive Group, Inc. (BHA) in 2015. BHA is one of the largest automotive retailers in the United States, currently operating 108 new vehicle franchises through 82 dealerships located primarily in major metropolitan markets in the United States. The dealerships sell new and used vehicles, vehicle maintenance and repair services, extended service contracts, vehicle protection products and other aftermarket products. BHA also arranges financing for its customers through third-party lenders. BHA operates 29 collision service centers directly connected to the dealerships’ operations and owns and operates two auto auctions and a fluid maintenance products distribution company.
Dealership operations are highly concentrated in the Arizona and Texas markets, with approximately 70% of dealership-related revenues derived from sales in these markets. BHA currently maintains franchise agreements with 27 different vehicle manufacturers, although it derives a significant portion of its revenue from the Toyota/Lexus, General Motors, Ford/Lincoln, Nissan/Infiniti and Honda/Acura brands. Approximately 90% of BHA’s annual revenues are from dealerships representing these manufacturers.
The retail automotive industry is highly competitive. BHA faces competition from other large public and private dealership groups, as well as individual franchised dealerships and competition via the Internet. Given the pricing transparency available via the Internet, and the fact that franchised dealers acquire vehicles from the manufacturers on the same terms irrespective of volume, the location and quality of the dealership facility, customer service and transaction speed are key differentiators in attracting customers.
BHA’s overall relationships with the automobile manufacturers are governed by framework agreements. The framework agreements contain provisions relating to the management, operation, acquisition and the ownership structure of BHA’s dealerships. Failure to meet the terms of these agreements could adversely impact BHA’s ability to acquire additional dealerships representing those manufacturers. Additionally, these agreements contain limitations on the number of dealerships from a specific manufacturer that may be owned by BHA.
K-20
Table of Contents
Individual dealerships operate under franchise agreements with the manufacturer, which grants the dealership entity a non-exclusive right to sell the manufacturer’s brand of vehicles and offer related parts and service within a specified market area, as well as the right to use the manufacturer’s trademarks. The agreements contain various requirements and restrictions related to the management and operation of the franchised dealership and provide for termination of the agreement by the manufacturer or non-renewal for a variety of causes. The states generally have automotive dealership franchise laws that provide substantial protection to the franchisee, and it is difficult for a manufacturer to terminate or not renew a franchise agreement outside of bankruptcy or with “good cause” under the applicable state franchise law.
BHA owns facilities with approximately 6.5 million square feet of space and approximately 950 acres of land that are utilized in its operations. BHA also develops, underwrites and administers various vehicle protection plans as well as life and accident and health insurance plans sold to consumers through BHA’s dealerships and third party dealerships. BHA also develops proprietary training programs and materials, and provides ongoing monitoring and training of the dealership’s finance and insurance personnel.
Home furnishings retailing
The home furnishings businesses consist of Nebraska Furniture Mart (“NFM”), R.C. Willey Home Furnishings (“R.C. Willey”), Star Furniture Company (“Star”) and Jordan’s Furniture, Inc. (“Jordan’s”). These businesses offer a wide selection of furniture, bedding and accessories. In addition, NFM and R.C. Willey sell a full line of major household appliances, electronics, computers and other home furnishings and offer customer financing to complement their retail operations. An important feature of each of these businesses is their ability to control costs and to produce high business volume by offering significant value to their customers.
NFM operates its business from three large retail complexes, which include warehouse and administrative facilities in Omaha, Nebraska, Kansas City, Kansas and The Colony, Texas a suburb of Dallas, which opened in 2015. These three sites include approximately 1.5 million square feet of retail space. NFM is the largest furniture retailer in each of these markets. NFM also owns Homemakers Furniture located in Des Moines, Iowa, which has approximately 215,000 square feet of retail space. R.C. Willey, based in Salt Lake City, Utah, is the dominant home furnishings retailer in the Intermountain West region of the United States. R.C. Willey currently operates 12 retail stores and three distribution centers. These facilities include approximately 1.5 million square feet of retail space with six stores located in Utah, one store in Idaho, three stores in Nevada and two stores in California.
Jordan’s operates a retail furniture business from six locations with approximately 770,000 square feet of retail space in stores located in Massachusetts, New Hampshire, Rhode Island and Connecticut. The retail stores are supported by an 800,000 square foot distribution center in Taunton, Massachusetts. Jordan’s is the largest furniture retailer, as measured by sales, in Massachusetts and New Hampshire. Jordan’s is well known in its markets for its unique store arrangements and advertising campaigns. Star’s retail facilities include about 700,000 square feet of retail space in 11 locations in Texas with eight in Houston. Star maintains a dominant position in each of its markets.
Other retailing
Borsheim Jewelry Company, Inc. (“Borsheims”) operates from a single store in Omaha, Nebraska. Borsheims is a high volume retailer of fine jewelry, watches, crystal, china, stemware, flatware, gifts and collectibles. Helzberg’s Diamond Shops, Inc. (“Helzberg”) is based in North Kansas City, Missouri, and operates a chain of 217 retail jewelry stores in 36 states, which includes approximately 500,000 square feet of retail space. Helzberg’s stores are located in malls, lifestyle centers, power strip centers and outlet malls, and all stores operate under the name Helzberg Diamonds® or Helzberg Diamonds Outlet®. The Ben Bridge Corporation (“Ben Bridge Jeweler”), based in Seattle, Washington, operates a chain of 95 upscale retail jewelry stores located in 11 states primarily in the Western United States and in British Columbia, Canada. Forty-six of its retail locations are concept stores that sell only PANDORA jewelry. Principal products include finished jewelry and timepieces. Ben Bridge Jeweler stores are located primarily in major shopping malls.
See’s Candies (“See’s”) produces boxed chocolates and other confectionery products with an emphasis on quality and distinctiveness in two large kitchens in Los Angeles and San Francisco and one smaller facility in Burlingame, California. See’s operates approximately 250 retail and quantity discount stores located mainly in California and other Western states. See’s revenues are highly seasonal with nearly half of its annual revenues earned in the fourth quarter.
The Pampered Chef, Ltd. (“Pampered Chef”) is a premier direct seller of distinctive high quality kitchenware products with operations in the United States, Canada and Germany. Pampered Chef’s product portfolio consists of approximately 400 Pampered Chef® branded kitchenware items in categories ranging from stoneware and cutlery to grilling and entertaining. Pampered Chef’s products are available online as well as through a sales force of independent cooking consultants.
K-21
Table of Contents
Oriental Trading Company (“OTC”) is a leading multi-channel retailer and online destination for value-priced party supplies, arts and crafts, toys and novelties, school supplies, educational games, patient giveaways and personalized products. OTC, headquartered in Omaha, Nebraska, serves a broad base of nearly four million customers annually, including consumers, schools, churches, non-profit organizations, medical and dental offices and other businesses. OTC offers a unique assortment of over 50,000 fun products on its websites, including its flagship orientaltrading.com site and utilizes sophisticated digital and print marketing efforts to drive significant traffic and industry leading customer satisfaction.
In April 2015, Berkshire acquired Detlev Louis Motorrad (“Louis”) which is headquartered in Hamburg, Germany. Louis is a leading retailer of motorcycle apparel and equipment in Europe. Louis carries over 32,000 different products from more than 600 manufacturers, primarily covering the clothing, technical equipment and leisure markets. Louis has over 80 stores in Germany, Austria and Switzerland and also sells through catalogs and via the Internet throughout most of Europe.
Additional information with respect to Berkshire’s businesses
Revenue, earnings before taxes and identifiable assets attributable to Berkshire’s reportable business segments are included in Note 26 to Berkshire’s Consolidated Financial Statements contained in Item 8, Financial Statements and Supplementary Data. Additional information regarding Berkshire’s investments in fixed maturity and equity securities is included in Notes 3 and 4, respectively, to Berkshire’s Consolidated Financial Statements.
Since June 2013, Berkshire has maintained a significant investment in H.J. Heinz Holding Corporation (now The Kraft Heinz Company). Information concerning this investment is included in Note 5 to Berkshire’s Consolidated Financial Statements. Kraft Heinz is one of the largest food and beverage companies in the world, with sales in approximately 190 countries and territories. Kraft Heinz manufactures and markets food and beverage products, including condiments and sauces, cheese and dairy meals, meats, refreshment beverages, coffee and other grocery products, throughout the world, under a host of iconic brands including Heinz, Kraft, Oscar Mayer, Philadelphia, Velveeta, Lunchables, Planters, Maxwell House, Capri Sun, Ore-Ida, Kool-Aid and Jell-O.
Berkshire maintains a website (http://www.berkshirehathaway.com) where its annual reports, certain corporate governance documents, press releases, interim shareholder reports and links to its subsidiaries’ websites can be found. Berkshire’s periodic reports filed with the SEC, which include Form 10-K, Form 10-Q, Form 8-K and amendments thereto, may be accessed by the public free of charge from the SEC and through Berkshire. Electronic copies of these reports can be accessed at the SEC’s website (http://www.sec.gov) and indirectly through Berkshire’s website (http://www.berkshirehathaway.com). Copies of these reports may also be obtained, free of charge, upon written request to: Berkshire Hathaway Inc., 3555 Farnam Street, Omaha, NE 68131, Attn: Corporate Secretary.
| Item 1A. | Risk Factors |
Berkshire and its subsidiaries (referred to herein as “we,” “us,” “our” or similar expressions) are subject to certain risks and uncertainties in its business operations which are described below. The risks and uncertainties described below are not the only risks we face. Additional risks and uncertainties that are presently unknown or are currently deemed immaterial may also impair our business operations.
We are dependent on a few key people for our major investment and capital allocation decisions.
Major investment decisions and all major capital allocation decisions are made by Warren E. Buffett, Chairman of the Board of Directors and Chief Executive Officer, age 88, in consultation with Charles T. Munger, Vice Chairman of the Board of Directors, age 95. If for any reason the services of our key personnel, particularly Mr. Buffett, were to become unavailable, there could be a material adverse effect on our operations. However, Berkshire’s Board of Directors has identified certain current Berkshire subsidiary managers who, in their judgment, are capable of succeeding Mr. Buffett and has agreed on a replacement for Mr. Buffett should a replacement be needed currently. The Board continually monitors this risk and could alter its current view regarding a replacement for Mr. Buffett in the future. We believe that the Board’s succession plan, together with the outstanding managers running our numerous and highly diversified operating units helps to mitigate this risk. In 2018, Berkshire’s Board of Directors appointed Mr. Gregory Abel as Vice Chairman of Berkshire’s non-insurance operations and Mr. Ajit Jain as Vice Chairman of Berkshire’s insurance operations. Mr. Abel and Mr. Jain each report directly to Mr. Buffett and Mr. Buffett continues to be responsible for major capital allocation and investment decisions.
K-22
Table of Contents
We need qualified personnel to manage and operate our various businesses.
In our decentralized business model, we need qualified and competent management to direct day-to-day business activities of our operating subsidiaries and to manage changes in future business operations due to changing business or regulatory environments. Our operating subsidiaries also need qualified and competent personnel in executing their business plans and serving their customers, suppliers and other stakeholders. Our inability to recruit and retain qualified and competent managers and personnel could negatively affect the operating results, financial condition and liquidity of our subsidiaries and Berkshire as a whole.
Investments are unusually concentrated and fair values are subject to loss in value.
We concentrate a high percentage of the investments of our insurance subsidiaries in a relatively small number of equity securities and diversify our investment portfolios far less than is conventional in the insurance industry. A significant decline in the fair values of our larger investments in equity securities may produce a material decline in our consolidated shareholders’ equity and our consolidated statement of earnings.
Since a large percentage of our equity securities are held by our insurance subsidiaries, significant decreases in the fair values of these investments will produce significant declines in their statutory surplus. Our large statutory surplus is a competitive advantage, and a long-term material decline could have an adverse effect on our claims-paying ability ratings and our ability to write new insurance business thus potentially reducing our future underwriting profits.
Competition and technology may erode our business franchises and result in lower earnings.
Each of our operating businesses face intense competition within markets in which they operate. While we manage our businesses with the objective of achieving long-term sustainable growth by developing and strengthening competitive advantages, many factors, including technological changes, may erode or prevent the strengthening of competitive advantages. Accordingly, our future operating results will depend to some degree on our operating units successfully protecting and enhancing their competitive advantages. If our operating businesses are unsuccessful in these efforts, our periodic operating results in the future may decline.
Deterioration of general economic conditions may significantly reduce our operating earnings and impair our ability to access capital markets at a reasonable cost.
Our operating businesses are subject to normal economic cycles, which affect the general economy or the specific industries in which they operate. Significant deteriorations of economic conditions over a prolonged period could produce a material adverse effect on one or more of our significant operations. In addition, our utilities and energy businesses and our railroad business regularly utilize debt as a component of their capital structures, and depend on having access to borrowed funds through the capital markets at reasonable rates. To the extent that access to the capital markets is restricted or the cost of funding increases, these operations could be adversely affected.
Terrorist acts could hurt our operating businesses.
A successful (as defined by the aggressor) cyber, biological, nuclear or chemical attack could produce significant losses to our worldwide operations. Our business operations could be adversely affected from such acts through the loss of human resources or destruction of production facilities and information systems. We share the risk with all businesses.
Regulatory changes may adversely impact our future operating results.
Over time, in response to financial markets crises, global economic recessions, and social and environmental issues, regulatory initiatives were adopted in the United States and elsewhere. Such initiatives addressed for example, the regulation of banks and other major financial institutions and environmental and global-warming matters. These initiatives impact all of our businesses, albeit in varying ways. Increased regulatory compliance costs could have a significant negative impact on our operating businesses, as well as on the businesses in which we have a significant, but not controlling economic interests. We cannot predict whether such initiatives will have a material adverse impact on our consolidated financial position, results of operations or cash flows.
Data privacy regulations have recently been enacted in various jurisdictions in the U.S. and throughout the world. These regulations address numerous aspects related to the security of personal information that is stored in our information systems, networks and facilities. Failure to comply with these regulations could result in reputational damage and significant penalties.
K-23
Table of Contents
Cyber security risks
We rely on technology in virtually all aspects of our business. Like those of many large businesses, certain of our information systems have been subject to computer viruses, malicious codes, unauthorized access, phishing efforts, denial-of-service attacks and other cyber attacks and we expect to be subject to similar attacks in the future as such attacks become more sophisticated and frequent. A significant disruption or failure of our technology systems could result in service interruptions, safety failures, security events, regulatory compliance failures, an inability to protect information and assets against unauthorized users, and other operational difficulties. Attacks perpetrated against our systems could result in loss of assets and critical information and expose us to remediation costs and reputational damage.
Although we have taken steps intended to mitigate these risks, including business continuity planning, disaster recovery planning and business impact analysis, a significant disruption or cyber intrusion could adversely affect our results of operations, financial condition and liquidity. Additionally, if we are unable to acquire, develop, implement, adopt or protect rights around new technology, we may suffer a competitive disadvantage, which could also have an adverse effect on our results of operations, financial condition and liquidity.
Cyber attacks could further adversely affect our ability to operate facilities, information technology and business systems, or compromise confidential customer and employee information. Political, economic, social or financial market instability or damage to or interference with our operating assets, customers or suppliers from cyber attacks may result in business interruptions, lost revenues, higher commodity prices, disruption in fuel supplies, lower energy consumption, unstable markets, increased security, repair or other costs, or may materially adversely affect us in ways that cannot be predicted at this time. Any of these risks could materially affect our consolidated financial results. Furthermore, instability in the financial markets resulting from terrorism, sustained or significant cyber attacks, or war could also have a material adverse effect on our ability to raise capital. We share these risks with all businesses.
Derivative contracts may require significant cash settlement payments and result in significant losses in the future.
Over ten years ago, we assumed the risk of potentially significant losses under a number of equity index put option contracts. The contracts remaining at year end 2018 will expire from 2019 through 2025. Risks of losses under these contracts are based on declines in equity prices of stocks comprising certain major U.S. and international stock indexes. We received considerable cash premiums as compensation for accepting these risks. Absent major reductions in future equity securities prices, our ultimate payment obligations are not likely to be significant. Nevertheless, there can be no assurance that equity securities prices will not decline significantly resulting in settlement payments that significantly exceed the year end 2018 intrinsic value of the contracts ($1.7 billion), recorded fair value ($2.45 billion) or the premiums we received at inception ($4.0 billion).
Risks unique to our regulated businesses
Our tolerance for risk in our insurance businesses may result in significant underwriting losses.
When properly paid for the risk assumed, we have been and will continue to be willing to assume more risk from a single event than any other insurer has knowingly assumed. Accordingly, we could incur a significant loss from a single event. We may also write coverages for losses arising from acts of terrorism. We attempt to take into account all possible correlations and avoid writing groups of policies from which pre-tax losses from a single event might aggregate above $10 billion. Currently, we estimate that our aggregate exposure from a single event under outstanding policies is significantly below $10 billion. However, despite our efforts, losses may aggregate in unanticipated ways. Our tolerance for significant insurance losses may result in lower reported earnings in a future period.
The degree of estimation error inherent in the process of estimating property and casualty insurance loss reserves may result in significant underwriting losses.
The principal cost associated with the property and casualty insurance business is claims. In writing property and casualty insurance policies, we receive premiums today and promise to pay covered losses in the future. However, it will take decades before all claims that have occurred as of any given balance sheet date will be reported and settled. Although we believe that liabilities for unpaid losses are adequate, we will not know whether these liabilities or the premiums charged for the coverages provided were sufficient until well after the balance sheet date. Estimating insurance claim costs is inherently imprecise. Our estimated unpaid losses arising under contracts covering property and casualty insurance risks are large ($110 billion at December 31, 2018), and a small percentage increase to those liabilities can result in materially lower reported earnings.
Changes in regulations and regulatory actions can adversely affect our operating results and our ability to allocate capital.
Our insurance businesses are subject to regulation in the jurisdictions in which we operate. Such regulations may relate to among other things, the types of business that can be written, the rates that can be charged for coverage, the level of capital that must be maintained, and restrictions on the types and size of investments that can be made. Regulations may also restrict the timing and amount of dividend payments to Berkshire by these businesses. Accordingly, changes in regulations related to these or other matters or regulatory actions imposing restrictions on our insurance companies may adversely impact our results of operations and restrict our ability to allocate capital.
K-24
Table of Contents
Our railroad business conducted through BNSF is also subject to a significant number of laws and regulations with respect to rates and practices, taxes, railroad operations and a variety of health, safety, labor, environmental and other matters. Failure to comply with applicable laws and regulations could have a material adverse effect on BNSF’s business. Governments may change the legislative and/or regulatory framework within which BNSF operates, without providing any recourse for any adverse effects that the change may have on the business. For example, enacted federal legislation mandated the implementation of positive train control (“PTC”) technology by December 31, 2018, on certain mainline track where inter-city and commuter passenger railroads operate and where toxic-by-inhalation (“TIH”) hazardous materials are transported. Due to the Federal Railroad Administration’s (“FRA”) interpretation of the PTC mandate as requiring all railroads that run on our tracks to be compliant before we can be deemed compliant, the FRA has confirmed an extension of the deadline for the Company to December 31, 2020. Complying with legislative and regulatory changes may pose significant operating and implementation risks and require significant capital expenditures.
BNSF derives significant amounts of revenue from the transportation of energy-related commodities, particularly coal. To the extent that changes in government policies limit or restrict the usage of coal as a source of fuel in generating electricity or alternate fuels, such as natural gas, displace coal on a competitive basis, revenues and earnings could be adversely affected. As a common carrier, BNSF is also required to transport TIH chemicals and other hazardous materials. A release of hazardous materials could expose BNSF to significant claims, losses, penalties and environmental remediation obligations. Changes in the regulation of the rail industry could negatively impact BNSF’s ability to determine prices for rail services and to make capital improvements to its rail network, resulting in an adverse effect on our results of operations, financial condition or liquidity.
Our utilities and energy businesses operated under BHE are highly regulated by numerous federal, state, local and foreign governmental authorities in the jurisdictions in which they operate. These laws and regulations are complex, dynamic and subject to new interpretations or change. Regulations affect almost every aspect of our utilities and energy businesses. Regulations broadly apply and may limit management’s ability to independently make and implement decisions regarding numerous matters including: acquiring businesses; constructing, acquiring or disposing of operating assets; operating and maintaining generating facilities and transmission and distribution system assets; complying with pipeline safety and integrity and environmental requirements; setting rates charged to customers; establishing capital structures and issuing debt or equity securities; transacting between our domestic utilities and our other subsidiaries and affiliates; and paying dividends or similar distributions. Failure to comply with or reinterpretations of existing regulations and new legislation or regulations, such as those relating to air and water quality, renewable portfolio standards, emissions performance standards, climate change, coal combustion byproduct disposal, hazardous and solid waste disposal, protected species and other environmental matters, or changes in the nature of the regulatory process may have a significant adverse impact on our financial results.
Our railroad business requires significant ongoing capital investment to improve and maintain its railroad network so that transportation services can be safely and reliably provided to customers on a timely basis. Our utilities and energy businesses also require significant amounts of capital to construct, operate and maintain generation, transmission and distribution systems to meet their customers’ needs and reliability criteria. Additionally, system assets may need to be operational for long periods of time in order to justify the financial investment. The risk of operational or financial failure of capital projects is not necessarily recoverable through rates that are charged to customers. Further, a significant portion of costs of capital improvements are funded through debt issued by BNSF and BHE and their subsidiaries. Disruptions in debt capital markets that restrict access to funding when needed could adversely affect the results of operations, liquidity and capital resources of these businesses.
| Item 1B. | Unresolved Staff Comments |
None.
| Item 2. | Description of Properties |
The properties used by Berkshire’s business segments are summarized in this section. Berkshire’s railroad and utilities and energy businesses, in particular, utilize considerable physical assets in their businesses.
Railroad Business—Burlington Northern Santa Fe
Through BNSF Railway, BNSF operates approximately 32,500 route miles of track (excluding multiple main tracks, yard tracks and sidings) in 28 states, and also operates in three Canadian provinces. BNSF owns over 23,000 route miles, including easements, and operates over 9,000 route miles of trackage rights that permit BNSF to operate its trains with its crews over other railroads’ tracks. The total BNSF system, including single and multiple main tracks, yard tracks and sidings, consists of over 50,000 operated miles of track, all of which are owned by or held under easement by BNSF except for over 10,000 miles operated under trackage rights.
K-25
Table of Contents
BNSF operates various facilities and equipment to support its transportation system, including its infrastructure, locomotives and freight cars. It also owns or leases other equipment to support rail operations, such as vehicles. Support facilities for rail operations include yards and terminals throughout its rail network, system locomotive shops to perform locomotive servicing and maintenance, a centralized network operations center for train dispatching and network operations monitoring and management in Fort Worth, Texas, regional dispatching centers, computers, telecommunications equipment, signal systems and other support systems. Transfer facilities are maintained for rail-to-rail as well as intermodal transfer of containers, trailers and other freight traffic and include approximately 25 intermodal hubs located across the system. BNSF owns or holds under non-cancelable leases exceeding one year approximately 8,000 locomotives and 70,000 freight cars, in addition to maintenance of way and other equipment.
In the ordinary course of business, BNSF makes significant capital investments to expand and improve its railroad network. BNSF incurs significant costs in repairing and maintaining its properties. In 2018, BNSF recorded approximately $2 billion in repairs and maintenance expense.
Utilities and Energy Businesses—Berkshire Hathaway Energy
BHE’s energy properties consist of the physical assets necessary to support its electricity and natural gas businesses. Properties of BHE’s electricity businesses include electric generation, transmission and distribution facilities, as well as coal mining assets that support certain of BHE’s electric generating facilities. Properties of BHE’s natural gas businesses include natural gas distribution facilities, interstate pipelines, storage facilities, compressor stations and meter stations. The transmission and distribution assets are primarily within each of BHE’s utility service territories. In addition to these physical assets, BHE has rights-of-way, mineral rights and water rights that enable BHE to utilize its facilities. Pursuant to separate financing agreements, a majority of these properties are pledged or encumbered to support or otherwise provide the security for the related subsidiary debt. BHE or its affiliates own or have interests in the following types of electric generating facilities at December 31, 2018:
| Energy Source |
Entity |
Location by Significance |
Facility Net Capacity (MW) (1) |
Net Owned Capacity (MW) (1) |
||||||||
| Natural gas |
PacifiCorp, MEC, NV Energy and BHE Renewables | Nevada, Utah, Iowa, Illinois, Washington, Oregon, Texas, New York, and Arizona | 10,920 | 10,641 | ||||||||
| Coal |
PacifiCorp, MEC and NV Energy | Wyoming, Iowa, Utah, Arizona, Nevada, Colorado and Montana | 16,181 | 9,138 | ||||||||
| Wind |
PacifiCorp, MEC and BHE Renewables | Iowa, Wyoming, Texas, Nebraska, Washington, California, Illinois, Oregon and Kansas | 7,862 | 7,853 | ||||||||
| Solar |
BHE Renewables and NV Energy | California, Texas, Arizona, Minnesota and Nevada | 1,699 | 1,551 | ||||||||
| Hydroelectric |
PacifiCorp, MEC and BHE Renewables | Washington, Oregon, The Philippines, Idaho, California, Utah, Hawaii, Montana, Illinois and Wyoming | 1,299 | 1,277 | ||||||||
| Nuclear |
MEC | Illinois | 1,823 | 456 | ||||||||
| Geothermal |
PacifiCorp and BHE Renewables | California and Utah | 370 | 370 | ||||||||
|
|
|
|
|
|||||||||
| Total |
40,154 | 31,286 | ||||||||||
|
|
|
|
|
|||||||||
| (1) | Facility Net Capacity (MW) represents the lesser of nominal ratings or any limitations under applicable interconnection, power purchase, or other agreements for intermittent resources and the total net dependable capability available during summer conditions for all other units. An intermittent resource’s nominal rating is the manufacturer’s contractually specified capability (in MW) under specified conditions. Net Owned Capacity indicates BHE’s ownership of Facility Net Capacity. |
As of December 31, 2018, BHE’s subsidiaries also have electric generating facilities that are under construction in Iowa and Wyoming having total Facility Net Capacity and Net Owned Capacity of 2,390 MW.
PacifiCorp, MEC and NV Energy own electric transmission and distribution systems, including approximately 24,800 miles of transmission lines and approximately 1,690 substations, gas distribution facilities, including approximately 27,400 miles of gas mains and service lines, and an estimated 25 million tons of recoverable coal reserves in mines owned or leased in Wyoming and Colorado.
The electricity distribution network of Northern Powergrid (Northeast) and Northern Powergrid (Yorkshire) includes approximately 17,400 miles of overhead lines, approximately 42,300 miles of underground cables and approximately 780 major substations. AltaLink’s electricity transmission system includes approximately 8,200 miles of transmission lines and approximately 310 substations.
K-26
Table of Contents
Northern Natural’s pipeline system consists of approximately 14,700 miles of natural gas pipelines, including approximately 6,300 miles of mainline transmission pipelines and approximately 8,400 miles of branch and lateral pipelines. Northern Natural’s end-use and distribution market area includes points in Iowa, Nebraska, Minnesota, Wisconsin, South Dakota, Michigan and Illinois and its natural gas supply and delivery service area includes points in Kansas, Texas, Oklahoma and New Mexico. Storage services are provided through the operation of one underground natural gas storage field in Iowa, two underground natural gas storage facilities in Kansas and two liquefied natural gas storage peaking units, one in Iowa and one in Minnesota.
Kern River’s system consists of approximately 1,700 miles of natural gas pipelines, including approximately 1,400 miles of mainline section, including 100 miles of lateral pipelines, and approximately 300 miles of common facilities. Kern River owns the entire mainline section, which extends from the system’s point of origination in Wyoming through the Central Rocky Mountains into California.
Other Segments
The physical properties used by Berkshire’s other significant business segments are summarized below:
| Number of Properties | ||||||||||||||
| Business |
Country |
Locations |
Property/Facility type |
Owned | Leased | |||||||||
| Insurance: |
||||||||||||||
| GEICO |
U.S. | Locations in 39 states | Offices and claims centers | 12 | 108 | |||||||||
| Non-U.S. | Locations in one country | Offices | — | 2 | ||||||||||
| BHRG |
U.S. | Locations in 15 states | Offices | 1 | 28 | |||||||||
| Non-U.S. | Locations in 23 countries | Offices | 1 | 35 | ||||||||||
| BH Primary |
U.S. | Locations in 23 states | Offices | 9 | 79 | |||||||||
| Non-U.S. | Locations in 8 countries | Offices | — | 12 | ||||||||||
| Manufacturing |
U.S. | Locations in 48 states | Manufacturing facility | 543 | 167 | |||||||||
| Offices/Warehouses | 240 | 443 | ||||||||||||
| Retail/Showroom | 225 | 226 | ||||||||||||
| Housing communities | 280 | — | ||||||||||||
| Non-U.S. | Locations in 65 countries | Manufacturing facility | 241 | 172 | ||||||||||
| Offices/Warehouses | 59 | 540 | ||||||||||||
| Retail/Showroom | — | 5 | ||||||||||||
| Service |
U.S. | Locations in 38 states | Training facilities/Hangars | 19 | 130 | |||||||||
| Offices/Distribution | 52 | 207 | ||||||||||||
| Production facilities | 24 | 3 | ||||||||||||
| Leasing/Showroom/Retail | 40 | 91 | ||||||||||||
| Non-U.S. | Locations in 34 countries | Training facilities/Hangars | 18 | 35 | ||||||||||
| Offices/Distribution | — | 115 | ||||||||||||
| Leasing/Showroom/Retail | — | 1 | ||||||||||||
| McLane Company |
U.S. | Locations in 28 states | Distribution centers/Offices | 57 | 33 | |||||||||
| Retailing |
U.S. | Locations in 42 states | Offices/Warehouses | 32 | 27 | |||||||||
| Retail/Showroom | 143 | 564 | ||||||||||||
| Non-U.S. | Locations in 6 countries | Offices/Warehouses | 1 | 12 | ||||||||||
| Retail/Offices | — | 87 | ||||||||||||
K-27
Table of Contents
| Item 3. | Legal Proceedings |
Berkshire and its subsidiaries are parties in a variety of legal actions that routinely arise out of the normal course of business, including legal actions seeking to establish liability directly through insurance contracts or indirectly through reinsurance contracts issued by Berkshire subsidiaries. Plaintiffs occasionally seek punitive or exemplary damages. We do not believe that such normal and routine litigation will have a material effect on our financial condition or results of operations. Berkshire and certain of its subsidiaries are also involved in other kinds of legal actions, some of which assert or may assert claims or seek to impose fines and penalties. We believe that any liability that may arise as a result of other pending legal actions will not have a material effect on our consolidated financial condition or results of operations.
| Item 4. | Mine Safety Disclosures |
Information regarding the Company’s mine safety violations and other legal matters disclosed in accordance with Section 1503 (a) of the Dodd-Frank Reform Act is included in Exhibit 95 to this Form 10-K.
Executive Officers of the Registrant
Following is a list of the Registrant’s named executive officers:
| Name |
Age | Position with Registrant |
Since | |||
| Warren E. Buffett |
88 | Chairman and Chief Executive Officer | 1970 | |||
| Charles T. Munger |
95 | Vice Chairman | 1978 | |||
| Gregory E. Abel |
56 | Vice Chairman – Non-Insurance Operations | 2018 | |||
| Ajit Jain |
67 | Vice Chairman – Insurance Operations | 2018 | |||
| Marc D. Hamburg |
69 | Senior Vice-President – Chief Financial Officer | 1992 |
Each executive officer serves, in accordance with the by-laws of the Registrant, until the first meeting of the Board of Directors following the next annual meeting of shareholders and until a successor is chosen and qualified or until such executive officer sooner dies, resigns, is removed or becomes disqualified.
FORWARD-LOOKING STATEMENTS
Investors are cautioned that certain statements contained in this document as well as some statements in periodic press releases and some oral statements of Berkshire officials during presentations about Berkshire or its subsidiaries are “forward-looking” statements within the meaning of the Private Securities Litigation Reform Act of 1995 (the “Act”). Forward-looking statements include statements which are predictive in nature, which depend upon or refer to future events or conditions, which include words such as “expects,” “anticipates,” “intends,” “plans,” “believes,” “estimates” or similar expressions. In addition, any statements concerning future financial performance (including future revenues, earnings or growth rates), ongoing business strategies or prospects and possible future Berkshire actions, which may be provided by management, are also forward-looking statements as defined by the Act. Forward-looking statements are based on current expectations and projections about future events and are subject to risks, uncertainties and assumptions about Berkshire and its subsidiaries, economic and market factors and the industries in which we do business, among other things. These statements are not guarantees of future performance and we have no specific intention to update these statements.
Actual events and results may differ materially from those expressed or forecasted in forward-looking statements due to a number of factors. The principal risk factors that could cause our actual performance and future events and actions to differ materially from such forward-looking statements include, but are not limited to, changes in market prices of our investments in fixed maturity and equity securities, losses realized from derivative contracts, the occurrence of one or more catastrophic events, such as an earthquake, hurricane, act of terrorism or cyber attack that causes losses insured by our insurance subsidiaries and/or losses to our business operations, changes in laws or regulations affecting our insurance, railroad, utilities and energy and finance subsidiaries, changes in federal income tax laws, and changes in general economic and market factors that affect the prices of securities or the industries in which we do business.
K-28
Table of Contents
Part II
| Item 5. | Market for Registrant’s Common Equity, Related Security Holder Matters and Issuer Purchases of Equity Securities |
Market Information
Berkshire’s Class A and Class B common stock are listed for trading on the New York Stock Exchange, trading symbol: BRK.A and BRK.B, respectively.
Shareholders
Berkshire had approximately 2,000 record holders of its Class A common stock and 19,500 record holders of its Class B common stock at February 15, 2019. Record owners included nominees holding at least 417,000 shares of Class A common stock and 1,374,000,000 shares of Class B common stock on behalf of beneficial-but-not-of-record owners.
Dividends
Berkshire has not declared a cash dividend since 1967.
Common Stock Repurchase Program
For several years, Berkshire had a common stock repurchase program, which permitted Berkshire to repurchase its Class A and Class B shares at prices no higher than a 20% premium over the book value of the shares. On July 17, 2018, Berkshire’s Board of Directors authorized an amendment to the program, permitting Berkshire to repurchase shares any time that Warren Buffett, Berkshire’s Chairman of the Board and Chief Executive Officer, and Charles Munger, Vice Chairman of the Board, believe that the repurchase price is below Berkshire’s intrinsic value, conservatively determined. Repurchases may be in the open market or through privately negotiated transactions. Information with respect to Berkshire’s Class A and Class B common stock repurchased during the fourth quarter of 2018 follows.
| Period |
Total number of shares purchased |
Average price paid per share |
Total number of shares purchased as part of publicly announced program |
Maximum number or value of shares that yet may be repurchased under the program | ||||||||||
| October 11 through October 18: |
||||||||||||||
| Class A common stock |
202 | $ | 310,762.79 | 202 | * | |||||||||
| Class B common stock |
589,955 | $ | 205.09 | 589,955 | * | |||||||||
| December 13 through December 24: |
||||||||||||||
| Class A common stock |
790 | $ | 295,953.99 | 790 | * | |||||||||
| * | The program does not specify a maximum number of shares to be repurchased or obligate Berkshire to repurchase any specific dollar amount or number of Class A or Class B shares and there is no expiration date to the repurchase program. Berkshire will not repurchase its common stock if the repurchases reduce the total value of Berkshire’s consolidated cash, cash equivalents and U.S. Treasury Bills holdings to less than $20 billion. |
K-29
Table of Contents
Market for Registrant’s Common Equity, Related Security Holder Matters and Issuer Purchases of Equity Securities (Continued)
Stock Performance Graph
The following chart compares the subsequent value of $100 invested in Berkshire common stock on December 31, 2013 with a similar investment in the Standard & Poor’s 500 Stock Index and in the Standard & Poor’s Property – Casualty Insurance Index.**
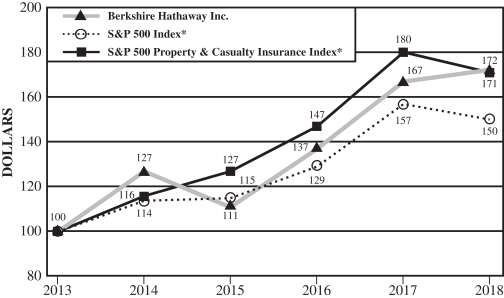
| * | Cumulative return for the Standard & Poor’s indices based on reinvestment of dividends. |
| ** | It would be difficult to develop a peer group of companies similar to Berkshire. The Corporation owns subsidiaries engaged in a number of diverse business activities of which the most important is the property and casualty insurance business and, accordingly, management has used the Standard & Poor’s Property—Casualty Insurance Index for comparative purposes. |
K-30
Table of Contents
| Item 6. | Selected Financial Data |
Selected Financial Data for the Past Five Years
(dollars in millions except per-share data)
| 2018 | 2017 | 2016 | 2015 | 2014 | ||||||||||||||||
| Revenues: |
||||||||||||||||||||
| Insurance premiums earned |
$ | 57,418 | $ | 60,597 | $ | 45,881 | $ | 41,294 | $ | 41,253 | ||||||||||
| Sales and service revenues |
133,336 | 130,243 | 123,053 | 110,811 | 100,606 | |||||||||||||||
| Leasing revenue |
5,732 | 2,552 | 2,553 | 1,546 | 1,463 | |||||||||||||||
| Railroad, utilities and energy revenues |
43,673 | 40,005 | 37,447 | 39,923 | 40,610 | |||||||||||||||
| Interest, dividend and other investment income |
7,678 | 6,536 | 6,180 | 6,867 | 6,484 | |||||||||||||||
|
|
|
|
|
|
|
|
|
|
|
|||||||||||
| Total revenues |
$ | 247,837 | $ | 239,933 | $ | 215,114 | $ | 200,441 | $ | 190,416 | ||||||||||
|
|
|
|
|
|
|
|
|
|
|
|||||||||||
| Investment and derivative gains/losses |
$ | (22,455 | ) | $ | 2,128 | $ | 8,304 | $ | 10,347 | $ | 4,081 | |||||||||
|
|
|
|
|
|
|
|
|
|
|
|||||||||||
| Earnings: |
||||||||||||||||||||
| Net earnings attributable to Berkshire Hathaway (1) |
$ | 4,021 | $ | 44,940 | $ | 24,074 | $ | 24,083 | $ | 19,872 | ||||||||||
|
|
|
|
|
|
|
|
|
|
|
|||||||||||
| Net earnings per share attributable to Berkshire Hathaway shareholders (2) |
$ | 2,446 | $ | 27,326 | $ | 14,645 | $ | 14,656 | $ | 12,092 | ||||||||||
|
|
|
|
|
|
|
|
|
|
|
|||||||||||
| Year-end data: |
||||||||||||||||||||
| Total assets |
$ | 707,794 | $ | 702,095 | $ | 620,854 | $ | 552,257 | $ | 525,867 | ||||||||||
| Notes payable and other borrowings: |
||||||||||||||||||||
| Insurance and other |
34,975 | 40,409 | 42,559 | 26,550 | 24,584 | |||||||||||||||
| Railroad, utilities and energy |
62,515 | 62,178 | 59,085 | 57,739 | 55,306 | |||||||||||||||
| Berkshire Hathaway shareholders’ equity |
348,703 | 348,296 | 282,070 | 254,619 | 239,239 | |||||||||||||||
| Class A equivalent common shares outstanding, in thousands |
1,641 | 1,645 | 1,644 | 1,643 | 1,643 | |||||||||||||||
| Berkshire Hathaway shareholders’ equity per outstanding Class A equivalent common share |
$ | 212,503 | $ | 211,750 | $ | 171,542 | $ | 154,935 | $ | 145,619 | ||||||||||
| (1) | Includes after-tax investment and derivative gains/losses of $(17.7) billion in 2018, $1.4 billion in 2017, $6.5 billion in 2016, $6.7 billion in 2015 and $3.3 billion in 2014. Beginning in 2018, investment gains/losses include the changes in fair values of equity securities during the period. Previously, investment gains/losses of equity securities were recognized in earnings when securities were sold or were other-than-temporarily impaired. Net earnings in 2017 includes a one-time net benefit of $29.1 billion attributable to the enactment of the Tax Cuts and Jobs Act of 2017. |
| (2) | Represents net earnings per average equivalent Class A share outstanding. Net earnings per average equivalent Class B common share outstanding is equal to 1/1,500 of such amount. |
K-31
Table of Contents
Item 7. Management’s Discussion and Analysis of Financial Condition and Results of Operations
Results of Operations
Net earnings attributable to Berkshire Hathaway shareholders for each of the past three years are disaggregated in the table that follows. Amounts are after deducting income taxes and exclude earnings attributable to noncontrolling interests (in millions).
| 2018 | 2017 | 2016 | ||||||||||
| Insurance – underwriting |
$ | 1,566 | $ | (2,219 | ) | $ | 1,370 | |||||
| Insurance – investment income |
4,554 | 3,887 | 3,636 | |||||||||
| Railroad |
5,219 | 3,959 | 3,569 | |||||||||
| Utilities and energy |
2,621 | 2,033 | 2,230 | |||||||||
| Manufacturing, service and retailing |
9,364 | 7,282 | 6,803 | |||||||||
| Investment and derivative gains/losses |
(17,737 | ) | 1,377 | 6,497 | ||||||||
| Other |
(1,566 | ) | (485 | ) | (31 | ) | ||||||
| Tax Cuts and Jobs Act of 2017 |
— | 29,106 | — | |||||||||
|
|
|
|
|
|
|
|||||||
| Net earnings attributable to Berkshire Hathaway shareholders |
$ | 4,021 | $ | 44,940 | $ | 24,074 | ||||||
|
|
|
|
|
|
|
|||||||
Through our subsidiaries, we engage in a number of diverse business activities. We manage our operating businesses on an unusually decentralized basis. There are essentially no centralized or integrated business functions and there is minimal involvement by our corporate headquarters in the day-to-day business activities of the operating businesses. Our senior corporate management team participates in and is ultimately responsible for significant capital allocation decisions, investment activities and the selection of the Chief Executive to head each of the operating businesses. The business segment data (Note 26 to the accompanying Consolidated Financial Statements) should be read in conjunction with this discussion.
Beginning in 2018, our periodic net earnings include changes in unrealized gains and losses on our investments in equity securities. These gains and losses are likely to be very significant given the size of our current holdings and the inherent volatility in securities prices. Prior to 2018, the changes in unrealized gains and losses pertaining to such investments were recorded in other comprehensive income. The new accounting treatment has no effect on our consolidated shareholders’ equity.
After-tax earnings of our business operations in 2018 were favorably affected by lower U.S. income tax expense, primarily attributable to a reduction in the statutory U.S. corporate income tax rate from 35% to 21%. The effect of the lower U.S. statutory income tax rate in 2018 on the comparative after-tax earnings of our various business operations varied, reflecting the differences in the mix of earnings subject to income tax, income tax credits and the effects of state and local income taxes.
Net earnings in 2017 included approximately $29.1 billion attributable to a one-time net benefit from the enactment of the Tax Cuts and Jobs Act of 2017 (“TCJA”) on December 22, 2017. See Note 18 to the Consolidated Financial Statements. This benefit included approximately $29.6 billion related to a one-time non-cash reduction of net deferred income tax liabilities from the reduction in the statutory U.S. corporate income tax rate from 35% to 21%, and a net benefit of approximately $900 million primarily attributable to our earnings from Kraft Heinz, partly offset by a one-time income tax expense of approximately $1.4 billion on the deemed repatriation of certain accumulated undistributed earnings of foreign subsidiaries. Due to their significance, we presented these one-time effects as a distinct item in the preceding table. Accordingly, the after-tax figures presented for 2017 in the discussion of our various operating businesses and other activities exclude the one-time effects of the TCJA.
After-tax earnings from insurance underwriting were approximately $1.6 billion in 2018 compared to after-tax losses of approximately $2.2 billion in 2017. Results in 2018 included reductions of estimated ultimate liabilities for prior years’ property/casualty loss events, gains from foreign currency exchange rate changes on certain non-U.S. Dollar denominated liabilities of U.S subsidiaries of $207 million and a lower effective income tax rate, partly offset by losses from significant catastrophe events of approximately $1.6 billion ($1.3 billion after-tax). After-tax losses from insurance underwriting in 2017 included estimated pre-tax losses of approximately $3.0 billion ($1.95 billion after-tax) from significant catastrophe events. Underwriting results in 2017 also included after-tax foreign currency exchange rate losses of $295 million.
Our railroad business generated a 31.8% increase in after-tax earnings in 2018 compared to 2017, reflecting an increase in unit volume, higher average revenue per car/unit and a lower effective income tax rate, partly offset by increased fuel and other operating costs. After-tax earnings of our railroad business in 2017 were $4.0 billion, an increase of 10.9% compared to 2016, reflecting increased unit volume.
Our utilities and energy businesses produced higher after-tax earnings in 2018 compared to 2017, primarily due to a lower overall effective income tax rate and the effects of losses incurred in 2017 in connection with the prepayment of certain long-term debt, partially offset by lower pre-tax earnings in certain of the regulated utilities. After-tax earnings of our utility and energy businesses in 2017 declined $197 million compared to 2016, reflecting the debt prepayment losses in 2017.
K-32
Table of Contents
Management’s Discussion and Analysis (Continued)
Results of Operations (Continued)
After-tax earnings in 2018 of our manufacturing, service and retailing businesses increased 29% over 2017, due to lower effective income tax rates and a 13% increase in pre-tax earnings. After-tax earnings in 2017 of our manufacturing, service and retailing businesses were $7.3 billion, an increase of 7.0% compared to 2016, reflecting comparatively higher earnings from several of our larger operations and the impact of businesses acquired in 2016 and 2017.
After-tax losses from investments and derivative contracts were $17.7 billion in 2018, which included after-tax losses of approximately $18 billion from changes in market values of our investments in equity securities held at December 31, 2018. Prior to 2018, after-tax investment gains or losses on equity securities arose from the sale of securities during the period based on the cost of the disposed security or through the recording of other-than-temporary impairment losses. In 2017, we recorded after-tax unrealized gains on our investments in equity securities of approximately $19 billion in other comprehensive income.
After-tax investment and derivative gains were approximately $1.4 billion in 2017 and $6.5 billion in 2016. Investment gains in 2016 included approximately $2.7 billion from the redemptions of our Wrigley and Kraft Heinz preferred stock investments, and sales of Dow Chemical common stock we received in the conversion of the Dow Chemical preferred stock investment. Investment gains in 2016 also included a non-cash after-tax gain of approximately $1.9 billion related to the exchange of Procter & Gamble (“P&G”) common stock for 100% of the common stock of Duracell.
We believe that investment and derivative gains/losses, whether realized from dispositions or unrealized from changes in market prices of equity securities, are generally meaningless in understanding our reported results or evaluating the economic performance of our businesses. These gains and losses have caused and will continue to cause significant volatility in our periodic earnings.
Other earnings included after-tax foreign currency exchange rate gains of $289 million in 2018, losses of $655 million in 2017 and gains of $159 million in 2016 related to parent company Euro-denominated debt. In addition, other earnings in 2018 included losses from equity method investments due to Kraft Heinz, partly offset by earnings from other equity method investments. Other earnings in 2018 also reflected increased interest income from short-term investments.
Insurance—Underwriting
Our management views our insurance businesses as possessing two distinct activities – underwriting and investing. Underwriting decisions are the responsibility of the unit managers, while investing decisions are the responsibility of Berkshire’s Chairman and CEO, Warren E. Buffett and Berkshire’s corporate investment managers. Accordingly, we evaluate performance of underwriting operations without any allocation of investment income or investment gains/losses. We consider investment income as a component of our aggregate insurance operating results. However, we consider investment gains and losses, whether realized or unrealized as non-operating, based on our long-held philosophy of acquiring securities and holding those securities for long periods. Accordingly, we believe that such gains and losses are not necessarily meaningful in understanding the operating results of our insurance operations.
The timing and amount of catastrophe losses can produce significant volatility in our periodic underwriting results, particularly with respect to our reinsurance businesses. Generally, we consider catastrophe losses in excess of $100 million (pre-tax) from a current year event as significant. We incurred estimated pre-tax losses of approximately $1.6 billion in 2018 and $3.0 billion in 2017 from significant catastrophe events.
Changes in estimates for unpaid losses and loss adjustment expenses, including amounts established for occurrences in prior years, can also significantly affect our periodic underwriting results. Unpaid loss estimates, including estimates under retroactive reinsurance contracts, were approximately $110 billion as of December 31, 2018. Our periodic underwriting results may also include significant foreign currency transaction gains and losses arising from the changes in the valuation of non-U.S. Dollar denominated reinsurance liabilities of our U.S. based insurance subsidiaries due to foreign currency exchange rate fluctuations.
We engage in both primary insurance and reinsurance of property/casualty, life and health risks. In primary insurance activities, we assume defined portions of the risks of loss from persons or organizations that are directly subject to the risks. In reinsurance activities, we assume defined portions of similar or dissimilar risks that other insurers or reinsurers have subjected themselves to in their own insuring activities. Our insurance and reinsurance businesses are GEICO, Berkshire Hathaway Reinsurance Group (“BHRG”) and Berkshire Hathaway Primary Group.
K-33
Table of Contents
Management’s Discussion and Analysis (Continued)
Insurance—Underwriting (Continued)
Underwriting results of our insurance businesses are summarized below (dollars in millions).
| 2018 | 2017 | 2016 | ||||||||||
| Underwriting gain (loss): |
||||||||||||
| GEICO |
$ | 2,449 | $ | (310 | ) | $ | 462 | |||||
| Berkshire Hathaway Reinsurance Group |
(1,109) | (3,648 | ) | 1,012 | ||||||||
| Berkshire Hathaway Primary Group |
670 | 719 | 657 | |||||||||
|
|
|
|
|
|
|
|||||||
| Pre-tax underwriting gain (loss) |
2,010 | (3,239 | ) | 2,131 | ||||||||
| Income taxes and noncontrolling interests |
444 | (1,020 | ) | 761 | ||||||||
|
|
|
|
|
|
|
|||||||
| Net underwriting gain (loss) |
$ | 1,566 | $ | (2,219 | ) | $ | 1,370 | |||||
|
|
|
|
|
|
|
|||||||
| Effective income tax rate |
21.4% | 32.0% | 34.8% | |||||||||
|
|
|
|
|
|
|
|||||||
GEICO
GEICO writes private passenger automobile insurance, offering coverages to insureds in all 50 states and the District of Columbia. GEICO markets its policies mainly by direct response methods where most customers apply for coverage directly to the company via the Internet or over the telephone. A summary of GEICO’s underwriting results follows (dollars in millions).
| 2018 | 2017 | 2016 | ||||||||||||||||||||||
| Amount | % | Amount | % | Amount | % | |||||||||||||||||||
| Premiums written |
$ | 34,123 | $ | 30,547 | $ | 26,309 | ||||||||||||||||||
|
|
|
|
|
|
|
|||||||||||||||||||
| Premiums earned |
$ | 33,363 | 100.0 | $ | 29,441 | 100.0 | $ | 25,483 | 100.0 | |||||||||||||||
|
|
|
|
|
|
|
|
|
|
|
|
|
|||||||||||||
| Losses and loss adjustment expenses |
26,278 | 78.8 | 25,497 | 86.6 | 21,044 | 82.6 | ||||||||||||||||||
| Underwriting expenses |
4,636 | 13.9 | 4,254 | 14.5 | 3,977 | 15.6 | ||||||||||||||||||
|
|
|
|
|
|
|
|
|
|
|
|
|
|||||||||||||
| Total losses and expenses |
30,914 | 92.7 | 29,751 | 101.1 | 25,021 | 98.2 | ||||||||||||||||||
|
|
|
|
|
|
|
|
|
|
|
|
|
|||||||||||||
| Pre-tax underwriting gain (loss) |
$ | 2,449 | $ | (310 | ) | $ | 462 | |||||||||||||||||
|
|
|
|
|
|
|
|||||||||||||||||||
Premiums written were $34.1 billion in 2018, an increase of 11.7% compared to 2017. The increase reflected voluntary auto policies-in-force growth of 3.3% and increased premiums per auto policy of approximately 6.4%. The increase in premiums per policy was attributable to rate increases, coverage changes and changes in state and risk mix. The rate increases were in response to accelerating claim costs in recent years. Although policies-in-force increased 540,000 during 2018, the rate of increase slowed, as voluntary auto new business sales decreased 4.7% compared to 2017.
Pre-tax underwriting gains in 2018 were $2,449 million compared to losses of $310 million in 2017. Underwriting results in 2018 reflected the effects of lower losses from significant catastrophe events and from prior years’ loss events, as well as increased average premiums per policy.
Losses and loss adjustment expenses were $26.3 billion in 2018, an increase of $781 million (3.1%) compared to 2017. GEICO’s ratio of losses and loss adjustment expenses to premiums earned (the “loss ratio”) for 2018 was 78.8%, a decline of 7.8 percentage points compared to 2017. Losses from significant catastrophe events were $105 million in 2018 (Hurricanes Florence and Michael and the wildfires in California) and approximately $450 million in 2017 (Hurricanes Harvey and Irma).
Losses and loss adjustment expenses regularly include gains or losses for the decreases or increases in the ultimate claim loss estimates during the period for prior years’ loss events. These gains or losses produce corresponding increases or decreases to pre-tax underwriting gains. GEICO’s losses and loss adjustment expenses included gains of $222 million in 2018 and losses of $517 million in 2017 with respect to prior years’ loss events. In addition, claims frequencies in 2018 for property damage, collision, and bodily and personal injury protection coverages declined (two to four percent range) compared to 2017. Average claims severities in 2018 increased for property damage and collision coverages (four to six percent range) and bodily injury coverage (five to seven percent range) versus 2017.
K-34
Table of Contents
Management’s Discussion and Analysis (Continued)
Insurance—Underwriting (Continued)
GEICO (Continued)
Underwriting expenses were approximately $4.6 billion in 2018, an increase of $382 million (9.0%) over 2017. GEICO’s expense ratio (underwriting expenses to premiums earned) in 2018 was 13.9%, a decrease of 0.6 percentage points compared to 2017. The underwriting expense increase was primarily attributable to increases in advertising expenses, insurance premium taxes and employee-related costs, which reflected wage and staffing increases.
Premiums written were $30.5 billion in 2017, an increase of 16.1% over 2016, and premiums earned were $29.4 billion, an increase of approximately $4.0 billion (15.5%). During 2017, our voluntary auto policies-in-force grew approximately 8.6% and premiums per auto policy increased 6.9%. The increase in average premiums per policy was attributable to rate increases, coverage changes and changes in state and risk mix. Voluntary auto new business sales in 2017 increased 10.5% compared to 2016. Voluntary auto policies-in-force increased approximately 1,276,000 during 2017.
Pre-tax underwriting losses in 2017 were $310 million compared to pre-tax gains of $462 million in 2016. Losses and loss adjustment expenses in 2017 increased approximately $4.5 billion (21.2%) compared to 2016. Our loss ratio in 2017 increased 4.0 percentage points compared to 2016. The increase in losses incurred was attributable to increased average claims severities, losses from significant catastrophe events in 2017 ($450 million) and losses with respect to prior years’ loss events ($517 million). Average claims severities were higher in 2017 for property damage and collision coverages (four to six percent range) and bodily injury coverage (five to seven percent range). Claims frequencies in 2017 were relatively unchanged compared to 2016 for bodily injury coverage, decreased about one percent for property damage and collision coverages and decreased about two to three percent for personal injury protection coverage. Underwriting expenses increased $277 million (7.0%) in 2017 compared to 2016. Our expense ratio in 2017 declined 1.1 percentage points compared to 2016.
Berkshire Hathaway Reinsurance Group
We offer excess-of-loss and quota-share reinsurance coverages on property and casualty risks and life and health reinsurance to insurers and reinsurers worldwide through several subsidiaries, led by National Indemnity Company (“NICO”), Berkshire Hathaway Life Insurance Company of Nebraska (“BHLN”) and General Reinsurance Corporation, General Reinsurance AG and General Re Life Corporation (collectively, “General Re”). We also periodically assume property and casualty risks under retroactive reinsurance contracts written through NICO. In addition, we write periodic payment annuity contracts predominantly through BHLN.
With the exception of our retroactive reinsurance and periodic payment annuity businesses, we strive to generate pre-tax underwriting profits. Time-value-of-money concepts are important elements in establishing prices for retroactive reinsurance and periodic payment annuity businesses due to the expected long durations of the liabilities. We expect to incur pre-tax underwriting losses from such businesses, primarily through deferred charge amortization and discount accretion charges. We receive premiums at the inception of these contracts, which are then available for investment. A summary of BHRG’s premiums and pre-tax underwriting results follows (dollars in millions).
| Premiums written | Premiums earned | Pre-tax underwriting gain (loss) | ||||||||||||||||||||||||||||||||||
| 2018 | 2017 | 2016 | 2018 | 2017 | 2016 | 2018 | 2017 | 2016 | ||||||||||||||||||||||||||||
| Property/casualty |
$ | 9,413 | $ | 7,713 | $ | 6,993 | $ | 8,928 | $ | 7,552 | $ | 7,218 | $ | (207) | $ | (1,595 | ) | $ | 895 | |||||||||||||||||
| Retroactive reinsurance |
517 | 10,755 | 1,254 | 517 | 10,755 | 1,254 | (778) | (1,330 | ) | (60) | ||||||||||||||||||||||||||
| Life/health |
5,446 | 4,846 | 4,588 | 5,343 | 4,808 | 4,587 | 216 | (52 | ) | 305 | ||||||||||||||||||||||||||
| Periodic payment annuity |
1,156 | 898 | 1,082 | 1,156 | 898 | 1,082 | (340) | (671 | ) | (128) | ||||||||||||||||||||||||||
|
|
|
|
|
|
|
|
|
|
|
|
|
|
|
|
|
|
|
|||||||||||||||||||
| $ | 16,532 | $ | 24,212 | $ | 13,917 | $ | 15,944 | $ | 24,013 | $ | 14,141 | $ | (1,109) | $ | (3,648 | ) | $ | 1,012 | ||||||||||||||||||
|
|
|
|
|
|
|
|
|
|
|
|
|
|
|
|
|
|
|
|||||||||||||||||||
K-35
Table of Contents
Management’s Discussion and Analysis (Continued)
Insurance—Underwriting (Continued)
Berkshire Hathaway Reinsurance Group (Continued)
Property/casualty
A summary of property/casualty reinsurance underwriting results follows (dollars in millions).
| 2018 | 2017 | 2016 | ||||||||||||||||||||||
| Amount | % | Amount | % | Amount | % | |||||||||||||||||||
| Premiums written |
$ | 9,413 | $ | 7,713 | $ | 6,993 | ||||||||||||||||||
|
|
|
|
|
|
|
|||||||||||||||||||
| Premiums earned |
$ | 8,928 | 100.0 | $ | 7,552 | 100.0 | $ | 7,218 | 100.0 | |||||||||||||||
|
|
|
|
|
|
|
|
|
|
|
|
|
|||||||||||||
| Losses and loss adjustment expenses |
6,929 | 77.6 | 7,217 | 95.6 | 4,336 | 60.1 | ||||||||||||||||||
| Underwriting expenses |
2,206 | 24.7 | 1,930 | 25.5 | 1,987 | 27.5 | ||||||||||||||||||
|
|
|
|
|
|
|
|
|
|
|
|
|
|||||||||||||
| Total losses and expenses |
9,135 | 102.3 | 9,147 | 121.1 | 6,323 | 87.6 | ||||||||||||||||||
|
|
|
|
|
|
|
|
|
|
|
|
|
|||||||||||||
| Pre-tax underwriting gain (loss) |
$ | (207 | ) | $ | (1,595) | $ | 895 | |||||||||||||||||
|
|
|
|
|
|
|
|||||||||||||||||||
Property/casualty premiums earned in 2018 were $8.9 billion, an increase of 18.2% compared to 2017, while premiums earned in 2017 increased 4.6% compared to 2016. These increases were primarily attributable to higher direct and broker markets business, derived primarily from new business and increased participations for renewal business in both property and casualty lines. Premiums earned included approximately $1.8 billion in both 2018 and 2017 and $1.7 billion in 2016 from a 10-year, 20% quota-share contract entered into by NICO with Insurance Australia Group Limited, which expires in 2025.
Losses and loss adjustment expenses in 2018 decreased $288 million (4.0%) compared to 2017, and the loss ratio declined 18 percentage points to 77.6%. Losses incurred from significant catastrophe events in 2018 were approximately $1.3 billion, which derived from Hurricanes Florence and Michael, Typhoon Jebi and the wildfires in California, including $1.1 billion in the fourth quarter. Losses from significant catastrophe events in 2017 were approximately $2.4 billion, which derived from Hurricanes Harvey, Irma and Maria, an earthquake in Mexico, a cyclone in Australia and wildfires in California. There were no significant catastrophe loss events in 2016. In addition, losses and loss adjustment expenses reflected net gains of $469 million in 2018, $295 million in 2017 and $874 million in 2016 from reductions of estimated ultimate losses for prior years’ events. The net gain in 2018 was primarily due to lower than expected property losses. The net gain from prior years’ loss events in 2017 reflected losses from higher than expected property claims and increases in certain United Kingdom (“U.K.”) claim liabilities attributable to the U.K. Ministry of Justice’s decision to reduce the fixed discount rate required in lump sum settlement calculations of personal injury claims from 2.5% to negative 0.75%.
Retroactive reinsurance
Retroactive reinsurance premiums earned in 2018 were $517 million, which derived primarily from one contract. Premiums earned in 2017 included $10.2 billion from an aggregate excess-of-loss retroactive reinsurance agreement with various subsidiaries of American International Group, Inc. (the “AIG Agreement”). At the inception of our retroactive reinsurance contracts, we record the estimated ultimate claim liabilities, and we also record the excess of such claim liabilities over the premiums received as a deferred charge asset. Thus, as of the inception dates of these contracts, there is no net underwriting gain or loss. Deferred charge assets are subsequently amortized over the expected claim settlement period as losses and loss adjustment expenses.
Pre-tax underwriting losses from retroactive reinsurance contracts were $778 million in 2018, $1,330 million in 2017 and $60 million in 2016. Certain retroactive reinsurance liabilities of our U.S. subsidiaries are denominated in foreign currencies. Pre-tax underwriting results included gains of $169 million in 2018, losses of $264 million in 2017 and gains of $392 million in 2016 associated with the re-measurement of such liabilities due to currency exchange rate changes. Pre-tax underwriting losses before foreign currency gains/losses were $947 million in 2018, $1,066 million in 2017 and $452 million in 2016, which derived from deferred charge amortization and changes in the estimated timing and amount of future claim payments. Pre-tax underwriting losses related to the AIG Agreement were $611 million in 2018 and $527 million in 2017.
In 2018, we decreased estimated ultimate liabilities $341 million for prior years’ retroactive reinsurance contracts, which after adjustments to the related unamortized deferred charges from changes in the estimated timing and amount of the future claim payments, produced pre-tax underwriting gains of approximately $185 million. Changes in estimated ultimate liabilities for prior years’ contracts had a relatively insignificant effect on pre-tax underwriting results in 2017 and 2016.
K-36
Table of Contents
Management’s Discussion and Analysis (Continued)
Insurance—Underwriting (Continued)
Berkshire Hathaway Reinsurance Group (Continued)
Retroactive reinsurance (Continued)
Unpaid losses assumed under retroactive reinsurance contracts were approximately $41.8 billion at December 31, 2018 and $42.9 billion at December 31, 2017. Deferred charge assets related to such contracts were approximately $14.1 billion at December 31, 2018 and $15.3 billion at December 31, 2017. Deferred charge assets will be charged to pre-tax earnings over the expected remaining claims settlement periods through periodic amortization.
Life/health
A summary of our life/health reinsurance underwriting results follows (dollars in millions).
| 2018 | 2017 | 2016 | ||||||||||||||||||||||
| Amount | % | Amount | % | Amount | % | |||||||||||||||||||
| Premiums written |
$ | 5,446 | $ | 4,846 | $ | 4,588 | ||||||||||||||||||
|
|
|
|
|
|
|
|||||||||||||||||||
| Premiums earned |
$ | 5,343 | 100.0 | $ | 4,808 | 100.0 | $ | 4,587 | 100.0 | |||||||||||||||
|
|
|
|
|
|
|
|
|
|
|
|
|
|||||||||||||
| Life and health insurance benefits |
4,226 | 79.1 | 4,276 | 88.9 | 3,644 | 79.4 | ||||||||||||||||||
| Underwriting expenses |
901 | 16.9 | 584 | 12.2 | 638 | 13.9 | ||||||||||||||||||
|
|
|
|
|
|
|
|
|
|
|
|
|
|||||||||||||
| Total benefits and expenses |
5,127 | 96.0 | 4,860 | 101.1 | 4,282 | 93.3 | ||||||||||||||||||
|
|
|
|
|
|
|
|
|
|
|
|
|
|||||||||||||
| Pre-tax underwriting gain (loss) |
$ | 216 | $ | (52 | ) | $ | 305 | |||||||||||||||||
|
|
|
|
|
|
|
|||||||||||||||||||
Life/health premiums earned were $5.3 billion, an increase of $535 million (11.1%) over 2017, which increased $221 million (4.8%) compared to 2016. The increases in each year were primarily attributable to growth in the North America, Asia and Australia life insurance markets. In each of the last three years, premiums earned of approximately $1.0 billion derived from a BHLN reinsurance contract with a major reinsurer covering predominantly life risks in North America.
Our life/health business produced pre-tax underwriting gains of $216 million in 2018, losses of $52 million in 2017 and gains of $305 million in 2016. The underwriting gains in 2018 reflected lower losses from the run-off of U.S. long-term care business, partially offset by lower gains from the run-off of variable annuity guarantee contracts. In the fourth quarter of 2017, we recorded pre-tax losses of $450 million from discount rate reductions and changes in other actuarial assumptions associated with long-term care liabilities. Pre-tax gains from variable annuity guarantee reinsurance were $34 million in 2018, $256 million in 2017 and $231 million in 2016. Underwriting results from this business reflect changes in estimated liabilities for guaranteed benefits, which result from changes in securities markets and interest rates and from the periodic amortization of expected profit margins.
Periodic payment annuity
Periodic payment annuity premiums earned in 2018 were $1,156 million, an increase of $258 million (28.7%) compared to 2017, which declined $184 million (17.0%) from 2016, reflecting a corresponding increase and decrease in new business volumes. Periodic payment business is price sensitive, and the volume we write can change rapidly due to changes in prices, which are affected by prevailing interest rates, the perceived risks and durations associated with the expected annuity payments, and the level of competition.
Periodic payment annuity contracts produced pre-tax losses of $340 million in 2018, $671 million in 2017 and $128 million in 2016. Certain contracts written by our U.S. subsidiaries are denominated in foreign currencies and pre-tax underwriting results included gains of $93 million in 2018, losses of $190 million in 2017 and gains of $313 million in 2016 from the re-measurement of such liabilities due to changes in exchange rates. Before foreign currency gains and losses, pre-tax underwriting losses were $433 million in 2018, $481 million in 2017 and $441 million in 2016. These losses primarily derived from the recurring discount accretion of annuity liabilities, as well as the impact of mortality and interest rate changes. Discounted annuity liabilities approximated $12.5 billion at December 31, 2018 and $11.2 billion at December 31, 2017, reflecting a weighted average discount rate of approximately 4.1%.
K-37
Table of Contents
Management’s Discussion and Analysis (Continued)
Insurance—Underwriting (Continued)
Berkshire Hathaway Primary Group
The Berkshire Hathaway Primary Group (“BH Primary”) provides a variety of commercial insurance solutions, including healthcare malpractice, workers’ compensation, automobile, general liability, property and various specialty coverages for small, medium and large clients. The largest of these insurers are Berkshire Hathaway Specialty Insurance (“BH Specialty”), Berkshire Hathaway Homestate Companies (“BHHC”), MedPro Group, Berkshire Hathaway GUARD Insurance Companies (“GUARD”), and National Indemnity Company (“NICO Primary”). Other BH Primary insurers include U.S. Liability Insurance Company, Applied Underwriters, Central States Indemnity Company and MLMIC Insurance Company, acquired October 1, 2018. A summary of BH Primary underwriting results follows (dollars in millions).
| 2018 | 2017 | 2016 | ||||||||||||||||||||||
| Amount | % | Amount | % | Amount | % | |||||||||||||||||||
| Premiums written |
$ | 8,561 | $ | 7,483 | $ | 6,684 | ||||||||||||||||||
|
|
|
|
|
|
|
|||||||||||||||||||
| Premiums earned |
$ | 8,111 | 100.0 | $ | 7,143 | 100.0 | $ | 6,257 | 100.0 | |||||||||||||||
|
|
|
|
|
|
|
|
|
|
|
|
|
|||||||||||||
| Losses and loss adjustment expenses |
5,261 | 64.9 | 4,511 | 63.1 | 3,864 | 61.8 | ||||||||||||||||||
| Underwriting expenses |
2,180 | 26.9 | 1,913 | 26.8 | 1,736 | 27.7 | ||||||||||||||||||
|
|
|
|
|
|
|
|
|
|
|
|
|
|||||||||||||
| Total losses and expenses |
7,441 | 91.8 | 6,424 | 89.9 | 5,600 | 89.5 | ||||||||||||||||||
|
|
|
|
|
|
|
|
|
|
|
|
|
|||||||||||||
| Pre-tax underwriting gain |
$ | 670 | $ | 719 | $ | 657 | ||||||||||||||||||
|
|
|
|
|
|
|
|||||||||||||||||||
Premiums written and earned in 2018 increased 14.4% and 13.6%, respectively, compared to 2017. The increases in premiums written and earned were primarily attributable to written premium growth at BH Specialty (32.5%), GUARD (19.4%), NICO Primary (14.0%) and BHHC (7.6%). Premiums written and earned in 2017 increased 12.0% and 14.2%, respectively, compared to 2016 reflecting written premium increases from all of the significant BH Primary insurers, led by GUARD (26%), BH Specialty (23%) and BHHC (9%).
BH Primary’s loss ratios were 64.9% in 2018, 63.1% in 2017, and 61.8% in 2016. Losses and loss adjustment expenses included losses from significant catastrophe events of $190 million in 2018 from Hurricanes Florence and Michael and the wildfires in California and $225 million in 2017 from Hurricanes Harvey, Irma and Maria. Losses and loss adjustment expenses also included net gains from the reductions of estimated ultimate liabilities for prior years’ loss events of $715 million in 2018, $766 million in 2017 and $503 million in 2016. The liability reductions in each year primarily related to healthcare malpractice and workers’ compensation business. BH Primary writes significant levels of commercial and professional liability and workers’ compensation insurance and the related claim costs may be subject to higher severity and longer claim-tails, which could give rise to significant increases in claims liabilities in the future attributable to higher than expected claim settlements, adverse litigation outcomes or judicial rulings and other factors not currently anticipated.
Insurance—Investment Income
A summary of net investment income attributable to our insurance operations follows (dollars in millions).
| 2018 | 2017 | 2016 | ||||||||||
| Interest and other investment income |
$ | 1,851 | $ | 1,263 | $ | 930 | ||||||
| Dividend income |
3,652 | 3,592 | 3,552 | |||||||||
|
|
|
|
|
|
|
|||||||
| Investment income before income taxes and noncontrolling interests |
5,503 | 4,855 | 4,482 | |||||||||
| Income taxes and noncontrolling interests |
949 | 968 | 846 | |||||||||
|
|
|
|
|
|
|
|||||||
| Net investment income |
$ | 4,554 | $ | 3,887 | $ | 3,636 | ||||||
|
|
|
|
|
|
|
|||||||
| Effective income tax rate |
17.2% | 19.9% | 18.8% | |||||||||
|
|
|
|
|
|
|
|||||||
K-38
Table of Contents
Management’s Discussion and Analysis (Continued)
Insurance—Investment Income (Continued)
Pre-tax interest and other investment income increased $588 million (46.6%) compared to 2017. The increase reflected the effect of higher short-term interest rates in 2018 and higher other investment income, partly offset by lower interest from lower average investments in fixed maturity securities. Our invested assets continue to include significant levels of short-term investments. We believe that maintaining ample liquidity is paramount and we insist on safety over yield with respect to such investments. Dividend income increased $60 million (1.7%) in 2018 as compared to 2017, reflecting the impact of increased investments in marketable equity securities and higher dividend rates, partially offset by Restaurant Brands International’s redemption of our $3 billion investment in 9% preferred stock in December 2017.
Pre-tax investment income increased $373 million (8.3%) in 2017 compared to 2016, attributable to higher interest rates on short-term investments and increased other investment income. Dividend income in 2017 was relatively unchanged compared to 2016 reflecting increased dividend rates and increased overall investment levels, offset by the impact of the conversion of our $3 billion investment in Dow Chemical Company (“Dow”) 8.5% preferred stock into Dow common stock at the end of 2016. Prior to its conversion, we received dividends of $255 million per annum.
Invested assets of our insurance businesses derive from shareholder capital, including reinvested earnings, and from net liabilities under insurance and reinsurance contracts or “float.” The major components of float are unpaid losses and loss adjustment expenses, including liabilities under retroactive reinsurance contracts, life, annuity and health insurance benefit liabilities, unearned premiums and other liabilities due to policyholders, less insurance premiums and reinsurance receivables, deferred charges assumed under retroactive reinsurance contracts and deferred policy acquisition costs. Float approximated $123 billion at December 31, 2018, $114 billion at December 31, 2017, and $91 billion at December 31, 2016.
The increase in float in 2018 reflected the effects of the acquisition of MLMIC and overall growth of our insurance operations. The significant increase in float in 2017 reflected increases in loss adjustment expenses, including liabilities (net of deferred charges) assumed under retroactive reinsurance contracts written in 2017 and estimated liabilities related to catastrophe events, and overall growth of our insurance operations. Our combined insurance operations generated pre-tax underwriting earnings of approximately $2.0 billion in 2018, and consequently, the average cost of float for the period was negative. Pre-tax underwriting losses were approximately $3.2 billion in 2017 and our average cost of float was approximately 3.0%.
A summary of cash and investments held in our insurance businesses as of December 31, 2018 and 2017 follows (in millions).
| December 31, | ||||||||
| 2018 | 2017 | |||||||
| Cash, cash equivalents and U.S. Treasury Bills |
$ | 64,548 | $ | 73,285 | ||||
| Equity securities |
166,385 | 163,134 | ||||||
| Fixed maturity securities |
19,690 | 21,092 | ||||||
|
|
|
|
|
|||||
| $ | 250,623 | $ | 257,511 | |||||
|
|
|
|
|
|||||
Fixed maturity investments as of December 31, 2018 were as follows (in millions).
| Amortized cost |
Unrealized gains/losses |
Carrying value |
||||||||||
| U.S. Treasury, U.S. government corporations and agencies |
$ | 4,213 | $ | — | $ | 4,213 | ||||||
| States, municipalities and political subdivisions |
177 | 7 | 184 | |||||||||
| Foreign governments |
7,478 | 22 | 7,500 | |||||||||
| Corporate bonds, investment grade |
6,241 | 361 | 6,602 | |||||||||
| Corporate bonds, non-investment grade |
664 | 26 | 690 | |||||||||
| Mortgage-backed securities |
443 | 58 | 501 | |||||||||
|
|
|
|
|
|
|
|||||||
| $ | 19,216 | $ | 474 | $ | 19,690 | |||||||
|
|
|
|
|
|
|
|||||||
U.S. government obligations are rated AA+ or Aaa by the major rating agencies. Approximately 87% of all state, municipal and political subdivisions, foreign government obligations and mortgage-backed securities were rated AA or higher. Non-investment grade securities represent securities rated below BBB- or Baa3. Foreign government securities include obligations issued or unconditionally guaranteed by national or provincial government entities.
K-39
Table of Contents
Management’s Discussion and Analysis (Continued)
Railroad (“Burlington Northern Santa Fe”)
Burlington Northern Santa Fe, LLC (“BNSF”) operates one of the largest railroad systems in North America, with approximately 32,500 route miles of track in 28 states. BNSF also operates in three Canadian provinces. BNSF classifies its major business groups by type of product shipped and include consumer products, coal, industrial products and agricultural products. A summary of BNSF’s earnings follows (dollars in millions).
| 2018 | 2017 | 2016 | ||||||||||
| Revenues |
$ | 23,855 | $ | 21,387 | $ | 19,829 | ||||||
|
|
|
|
|
|
|
|||||||
| Operating expenses: |
||||||||||||
| Compensation and benefits |
5,394 | 5,023 | 4,809 | |||||||||
| Fuel |
3,346 | 2,518 | 1,934 | |||||||||
| Purchased services |
2,870 | 2,514 | 2,418 | |||||||||
| Depreciation and amortization |
2,317 | 2,352 | 2,128 | |||||||||
| Equipment rents, materials and other |
2,024 | 1,636 | 1,855 | |||||||||
|
|
|
|
|
|
|
|||||||
| Total operating expenses |
15,951 | 14,043 | 13,144 | |||||||||
| Interest expense |
1,041 | 1,016 | 992 | |||||||||
|
|
|
|
|
|
|
|||||||
| 16,992 | 15,059 | 14,136 | ||||||||||
|
|
|
|
|
|
|
|||||||
| Pre-tax earnings |
6,863 | 6,328 | 5,693 | |||||||||
| Income taxes |
1,644 | 2,369 | 2,124 | |||||||||
|
|
|
|
|
|
|
|||||||
| Net earnings |
$ | 5,219 | $ | 3,959 | $ | 3,569 | ||||||
|
|
|
|
|
|
|
|||||||
| Effective income tax rate |
24.0% | 37.4% | 37.3% | |||||||||
|
|
|
|
|
|
|
|||||||
2018 versus 2017
BNSF’s revenues were $23.9 billion in 2018, representing an increase of $2.5 billion (11.5%) versus 2017. BNSF’s revenues in 2018 reflected a 6.2% comparative increase in average revenue per car/unit and a 4.1% increase in volume. Combined volume was 10.7 million cars/units compared to 10.3 million in 2017. The increase in average revenue per car/unit was attributable to increased rates per car/unit, higher fuel surcharge revenue driven by higher fuel prices, and business mix changes. Pre-tax earnings were approximately $6.9 billion in 2018, an increase of 8.5% compared to 2017.
Revenues from consumer products were $7.9 billion in 2018, an increase of 11.1% compared to 2017, reflecting higher average revenue per car/unit and volume increases of 2.9%. The volume increases were due to higher domestic intermodal volumes, primarily attributable to general economic growth and tight truck capacity leading to conversion from highway to rail, as well as growth in imports and containerized agricultural product exports, partially offset by a sizable contract loss.
Revenues from industrial products were $6.0 billion in 2018, an increase of 16.2% from 2017. The increase was attributable to volume increases of 9.8% as well as higher average revenue per car/unit. Volumes in 2018 were higher primarily due to strength in the industrial and energy sectors, which drove higher demand for petroleum products, building products, construction products, and plastics.
Revenues from agricultural products increased 8.8% in 2018 to $4.7 billion compared to 2017. The increase was due to higher volumes of 9.0%, partially offset by slightly lower average revenue per car/unit. Volumes increased due to strong export and domestic corn shipments, as well as higher fertilizer and other grain products volumes, partially offset by a reduction in soybean and wheat exports.
Revenues from coal in 2018 increased 4.3% to $4.0 billion compared to 2017, attributable to higher average revenue per car/unit, partially offset by lower volumes of 0.8%. The volume decreases in 2018 were due mainly to utility plant retirements combined with competition from natural gas and renewables, mostly offset by market share gains and improved export volumes.
Total operating expenses were $16.0 billion in 2018, an increase of $1.9 billion (13.6%) compared to 2017. Our ratio of operating expenses to revenues increased 1.2 percentage points to 66.9% in 2018 versus 2017. Compensation and benefits expenses increased $371 million (7.4%) compared to 2017. The increase was primarily due to wage inflation and increased headcount and associated training costs. Fuel expenses increased $828 million (32.9%) compared to 2017 primarily due to higher average fuel prices and increased volumes.
K-40
Table of Contents
Management’s Discussion and Analysis (Continued)
Railroad (“Burlington Northern Santa Fe”) (Continued)
Purchased services expense increased $356 million (14.2%) compared to 2017. The increase was due to higher purchased transportation costs of our logistics services business, as well as increased intermodal ramping, drayage, and other volume-related costs. Equipment rents, materials and other expense increased $388 million (23.7%) compared to 2017. The increase resulted from higher locomotive material, personal injury expenses, derailment-related costs, and property taxes, as well as a benefit of the enactment of the TCJA on an equity method investee in 2017.
BNSF’s effective income tax rate was 24.0% for 2018 as compared to 37.4% for 2017 which excludes the effects of the TCJA. The reduction in the U.S. statutory income tax rate under the TCJA, effective January 1, 2018, drove most of the effective income tax rate decrease.
2017 versus 2016
BNSF’s revenues were $21.4 billion in 2017, representing an increase of $1.6 billion (7.9%) versus 2016. Pre-tax earnings increased 11.2% in 2017 compared to 2016. During 2017, BNSF’s revenues reflected a 2.4% comparative increase in average revenue per car/unit and a 5.3% increase in volume. Combined volume was 10.3 million cars/units in 2017 compared to 9.8 million in 2016. The increase in average revenue per car/unit was primarily attributable to higher fuel surcharge revenue, increased rates per car/unit and business mix changes.
Revenues from consumer products were $7.1 billion in 2017, representing an increase of 8.8% compared to 2016, reflecting volume increases of 6.3% as well as higher average revenue per car/unit. The volume increases were primarily attributable to improving economic conditions, normalizing of retail inventories, new services and higher market share, which benefited domestic intermodal, international intermodal and automotive volumes.
Revenues from industrial products were $5.1 billion in 2017, an increase of 7.7% from 2016, attributable to a volume increase of 5.0% as well as higher average revenue per car/unit. Volumes in 2017 were higher for sand and other commodities that support drilling. In addition, broad strengthening in the industrial sector drove greater demand for steel and taconite. These volume increases were partially offset by lower petroleum products volume due to pipeline displacement of U.S. crude rail traffic.
Revenues from agricultural products increased 1.8% to $4.3 billion in 2017 compared to 2016, primarily due to higher average revenue per car/unit. Volumes were relatively flat, primarily due to higher shipments of domestic grain, ethanol and other grain products, offset by lower grain exports.
Revenues from coal increased 13.7% to $3.8 billion in 2017 compared to 2016. This increase reflected higher average revenue per car/unit as well as 6.3% higher volumes. The volume increases in 2017 were due to the effects of higher natural gas prices, which led to increased utility coal usage. This was partially offset by the effects of unit retirements at coal generating facilities, increased renewable generation and coal inventory adjustments at customer facilities.
Total operating expenses were $14.0 billion in 2017, an increase of $899 million (6.8%) compared to 2016. Our ratio of operating expenses to revenues decreased 0.6 percentage points to 65.7% in 2017 versus 2016. Compensation and benefits expenses increased $214 million (4.4%) compared to 2016. The increase was primarily due to higher health and welfare costs and volume-related increases, partially offset by lower headcount. Fuel expenses increased $584 million (30.2%) compared to 2016 primarily due to higher average fuel prices and increased volumes. Depreciation and amortization expense increased $224 million (10.5%) compared to 2016 due to a larger base of depreciable assets in service. Equipment rents, materials and other expense declined $219 million (11.8%) compared to 2016. These declines resulted from the impact of the enactment of the TCJA on an equity method investee, as well as lower personal injury and casualty costs.
Utilities and Energy (“Berkshire Hathaway Energy Company”)
We currently own 90.9% of the outstanding common stock of Berkshire Hathaway Energy Company (“BHE”), which operates a global energy business. BHE’s domestic regulated utility interests are comprised of PacifiCorp, MidAmerican Energy Company (“MEC”) and NV Energy. In Great Britain, BHE subsidiaries operate two regulated electricity distribution businesses referred to as Northern Powergrid. BHE also owns two domestic regulated interstate natural gas pipeline companies. Other energy businesses include a regulated electricity transmission-only business in Alberta, Canada (“AltaLink, L.P.”) and a diversified portfolio of mostly renewable independent power projects. In addition, BHE also operates the second-largest residential real estate brokerage firm and one of the largest residential real estate brokerage franchise networks in the United States.
K-41
Table of Contents
Management’s Discussion and Analysis (Continued)
Utilities and Energy (“Berkshire Hathaway Energy Company”) (Continued)
The rates our regulated businesses charge customers for energy and services are based, in large part, on the costs of business operations, including income taxes and a return on capital, and are subject to regulatory approval. To the extent these regulated operations are not allowed to include such costs in the approved rates, operating results will be adversely affected. Among its provisions, the TCJA reduced the U.S. federal statutory income tax rate of our domestic regulated utilities from 35% to 21%. In 2018, BHE’s regulated subsidiaries began passing the benefits of lower income tax expense attributable to the TCJA to customers through various regulatory mechanisms, including lower rates, higher depreciation and reductions to rate base, which produced lower revenue and pre-tax earnings in 2018. Revenues and earnings of BHE are summarized below (dollars in millions).
| Revenues | Earnings | |||||||||||||||||||||||
| 2018 | 2017 | 2016 | 2018 | 2017 | 2016 | |||||||||||||||||||
| PacifiCorp |
$ | 5,078 | $ | 5,276 | $ | 5,245 | $ | 745 | $ | 1,131 | $ | 1,105 | ||||||||||||
| MidAmerican Energy Company |
3,117 | 2,906 | 2,668 | 407 | 372 | 392 | ||||||||||||||||||
| NV Energy |
3,065 | 3,048 | 2,925 | 417 | 567 | 559 | ||||||||||||||||||
| Northern Powergrid |
1,021 | 950 | 997 | 304 | 311 | 367 | ||||||||||||||||||
| Natural gas pipelines |
1,226 | 1,009 | 986 | 507 | 446 | 413 | ||||||||||||||||||
| Other energy businesses |
2,252 | 2,209 | 2,128 | 296 | 296 | 282 | ||||||||||||||||||
| Real estate brokerage |
4,228 | 3,456 | 2,815 | 204 | 220 | 225 | ||||||||||||||||||
| Corporate interest |
— | — | — | (408 | ) | (844 | ) | (465 | ) | |||||||||||||||
|
|
|
|
|
|
|
|
|
|
|
|
|
|||||||||||||
| $ | 19,987 | $ | 18,854 | $ | 17,764 | |||||||||||||||||||
|
|
|
|
|
|
|
|||||||||||||||||||
| Pre-tax earnings |
2,472 | 2,499 | 2,878 | |||||||||||||||||||||
| Income tax expense (benefit) |
(452 | ) | 148 | 371 | ||||||||||||||||||||
|
|
|
|
|
|
|
|||||||||||||||||||
| Net earnings |
2,924 | 2,351 | 2,507 | |||||||||||||||||||||
| Noncontrolling interests |
303 | 318 | 277 | |||||||||||||||||||||
|
|
|
|
|
|
|
|||||||||||||||||||
| Net earnings attributable to Berkshire Hathaway shareholders |
|
$ | 2,621 | $ | 2,033 | $ | 2,230 | |||||||||||||||||
|
|
|
|
|
|
|
|||||||||||||||||||
| Effective income tax rate |
|
(18.3)% | 5.9% | 12.9% | ||||||||||||||||||||
|
|
|
|
|
|
|
|||||||||||||||||||
PacifiCorp
PacifiCorp operates a regulated electric utility in portions of several Western states, including Utah, Oregon and Wyoming. Revenues in 2018 decreased 4% compared to 2017. Retail revenues in 2018 decreased $197 million compared to 2017. The decline reflected the effects of lower average rates ($180 million, including the impact of the TCJA of $152 million), and a reduction in volumes (0.2%), largely attributable to the impacts of weather.
Pre-tax earnings decreased $386 million (34%) in 2018 as compared to 2017. Utility margin (operating revenues less cost of fuel and energy) in 2018 was $3,269 million, a decrease of $198 million (6%) versus 2017. The decrease was primarily due to the declines in revenues, which included the effects of the TCJA. In addition, pre-tax earnings were negatively impacted $174 million (offset in income tax expense) due to a state regulatory order that accelerated depreciation expense on certain thermal generation facilities. PacifiCorp’s after-tax earnings in 2018 were $739 million, a decrease of $24 million (3%) from 2017.
Revenues increased 1% in 2017 compared to 2016. Wholesale and other revenues increased, reflecting higher volumes and average rates, and retail revenues decreased slightly, attributable to lower average rates, partly offset by higher volumes. Pre-tax earnings increased $26 million (2%) in 2017 as compared to 2016. The increase in earnings reflected higher utility margin, lower operations and maintenance expenses, and increased depreciation and amortization attributable to additional plant in-service. PacifiCorp’s after-tax earnings in 2017 were $763 million, a decrease of $1 million from 2016.
K-42
Table of Contents
Management’s Discussion and Analysis (Continued)
Utilities and Energy (“Berkshire Hathaway Energy Company”) (Continued)
MidAmerican Energy Company
MEC operates a regulated electric and natural gas utility primarily in Iowa and Illinois. Revenues in 2018 increased $211 million (7%) compared to 2017. Electric operating revenues increased $175 million (8%) and natural gas revenues increased $35 million (5%) in 2018 versus 2017. The increase in electric revenues was primarily attributable to higher retail revenues of $102 million, reflecting higher recoveries through bill riders (substantially offset in cost of sales, operating expenses and income tax expense) and volumes, partially offset by lower average rates, predominantly from the impact of the TCJA, and higher wholesale and other revenues of $73 million from higher volumes and average prices. The increase in natural gas revenues was primarily due to increased volumes, partially offset by a lower average per-unit price and the effects of the TCJA.
Pre-tax earnings in 2018 increased $35 million (9%) compared to 2017. Electric utility margin in 2018 was $1,796 million, an increase of $122 million (7%) over 2017, which was primarily due to the net increase in retail revenues. However, the increase in electric utility margin was mostly offset by increased depreciation, maintenance and other operating expenses. The increase in depreciation expense included $65 million from additional wind generation and other plant placed in-service and $44 million from Iowa revenue sharing.
MEC’s after-tax earnings in 2018 and 2017 were $669 million and $584 million, respectively, increases of $85 million (15%) and $52 million (10%), respectively, as compared to the corresponding prior years. MEC’s after-tax earnings were significantly greater than pre-tax earnings, primarily due to production income tax credits received relating to wind-powered generating facilities.
Revenues increased $238 million (9%) in 2017 as compared to 2016. The increase was primarily attributable to higher electric operating revenues ($123 million) and increased natural gas operating revenues ($82 million). Retail electric revenues increased $84 million in 2017 compared to 2016, primarily attributable to higher recoveries through bill riders and from non-weather usage and growth and rate factors, partially offset by the unfavorable impact of milder temperatures in 2017. Wholesale electric and other revenues increased $39 million in 2017 versus 2016, attributable to comparative increases in volumes, average rates and transmission fees. The natural gas operating revenues increase was primarily due to higher average per-unit costs of gas sold, which was offset by an increase in cost of sales. Pre-tax earnings declined $20 million (5%) in 2017 compared to 2016, reflecting increased depreciation, maintenance and other operating expenses and interest expense and debt extinguishment costs, partially offset by comparative increases in electric utility margins of $76 million.
NV Energy
NV Energy operates regulated electric and natural gas utilities in Nevada. Revenues in 2018 increased 1% compared to 2017. Electric operating revenues increased $17 million in 2018, reflecting increased pass-through cost adjustments and higher volumes largely attributable to the impacts of weather and retail customer growth, partly offset by reductions from the impact of the TCJA and lower retail rates resulting from a 2017 regulatory rate review. Natural gas operating revenue increased $5 million in 2018, primarily due to a higher average per-unit price, partially offset by lower customer usage.
Pre-tax earnings in 2018 decreased $150 million (26%) compared to 2017. The decrease was primarily due to lower electric utility margin and increased depreciation, maintenance and other operating costs. Electric utility margin in 2018 was $1,696 million, representing a $52 million (3%) decrease versus 2017. The decrease was primarily due to the effects of the TCJA, partially offset by the higher sales volumes. NV Energy’s after-tax earnings in 2018 were $317 million, a decline of 13% from 2017.
Revenues increased $123 million (4%) in 2017 compared to 2016. The increase was due primarily to an increase in retail electric operating revenues, which included a combination of increased rates from pass-through cost adjustments and higher volumes, partly offset by lower revenues from energy efficiency programs (offset by lower operating expenses). NV Energy also experienced retail electric revenue declines from the transition of certain commercial and industrial customers electing to purchase power from alternative sources and thus becoming distribution service only customers. Natural gas operating revenue declined $11 million in 2017, primarily due to lower rates, partially offset by higher customer usage. Pre-tax earnings increased $8 million (1%) in 2017 compared to 2016, primarily due to lower interest expenses. NV Energy’s after-tax earnings in 2017 were $365 million, an increase of 2% from 2016.
K-43
Table of Contents
Management’s Discussion and Analysis (Continued)
Utilities and Energy (“Berkshire Hathaway Energy Company”) (Continued)
Northern Powergrid
Revenues increased $71 million (7%) in 2018 compared to 2017, primarily due to the favorable foreign currency translation effects of a weaker average U.S. Dollar in 2018 and increased smart meter and distribution revenues. Pre-tax earnings in 2018 decreased $7 million (2%) compared to 2017, primarily due to higher depreciation and other operating expenses, including higher pension settlement losses, partly offset by favorable foreign currency translation effects and the increases in revenues.
Revenues declined $47 million (5%) in 2017 compared to 2016. Foreign currency translation effects of a comparatively stronger average U.S. Dollar in 2017 resulted in a $48 million comparative decline in revenues. In addition, we experienced comparative declines in distribution revenues, which were substantially offset by higher smart metering revenue. Pre-tax earnings declined $56 million (15%) in 2017 compared to 2016. The decline was primarily due to foreign currency translation effects, as well as from increased pension expenses and lower distribution revenues, partially offset by lower asset impairment charges and lower distribution costs.
Natural gas pipelines
Revenues increased $217 million (22%) in 2018 as compared to 2017, primarily due to higher transportation revenues of $113 million from higher volumes and rates due to unique market opportunities and colder average temperatures and increased sales volumes ($99 million) related to system balancing activities (substantially offset in cost of sales). Pre-tax earnings increased $61 million (14%) in 2018 compared to 2017, primarily due to the increases in transportation revenues and lower depreciation expense, partly offset by comparative increases in operations and maintenance expenses.
Revenues increased $23 million (2%) in 2017 compared to 2016. Northern Natural Gas produced higher transportation revenues and higher gas sales, primarily from system balancing activities, which were partly offset by lower transportation revenues at Kern River. Pre-tax earnings increased $33 million (8%) in 2017 compared to 2016. The increase was primarily due to the increase in transportation revenues and a reduction in expenses and regulatory liabilities related to the impact of an alternative rate structure approved by Kern River’s regulators in the first quarter of 2017, partially offset by higher operating expenses.
Other energy businesses
Revenues in 2018 increased $43 million (2%) compared to 2017, reflecting a comparative increase from renewable energy. Pre-tax earnings in 2018 were unchanged from 2017 as the increased revenues from renewable energy were offset by increased depreciation expense and higher other operating expenses.
Revenues increased 4% in 2017 compared to 2016. AltaLink L.P.’s operating revenues increased $197 million (39%) in 2017 compared to 2016, primarily due to effects of a decision in 2016 by its regulator, which changed the timing of when construction-in-progress expenditures included in the rate base are billable to customers and earned in revenues. The decision resulted in a one-time net reduction in revenue in 2016, with offsetting reductions in expenses. In 2017, we also experienced a comparative revenue increase of 13% from renewable energy and a comparative decline of 12% from the unregulated retail services business. Pre-tax earnings in 2017 increased 5% compared to 2016, as increased earnings from renewable energy and AltaLink L.P. were partly offset by lower earnings from the unregulated retail services business and other energy ventures.
Real estate brokerage
Revenues in 2018 increased 22% as compared to 2017, primarily due to recent business acquisitions. Pre-tax earnings decreased $16 million in 2018 compared to 2017, as higher operating costs and interest expense more than offset the revenue increase.
Revenues increased 23% in 2017 compared to 2016, primarily due to business acquisitions and an increase in average home sales prices. Pre-tax earnings decreased 2% in 2017 as compared to 2016. Earnings in 2017 included increased earnings from franchise businesses, partially offset by lower earnings from brokerage businesses, primarily due to higher operating expenses.
Corporate interest and income taxes
Corporate interest includes interest on unsecured debt issued by the BHE holding company and borrowings from Berkshire insurance subsidiaries in connection with certain of BHE’s business acquisitions. The borrowings from Berkshire insurance subsidiaries were repaid in the third quarter of 2017. Corporate interest in 2017 also included pre-tax charges of $410 million from a tender offer completed in December 2017 to redeem certain long-term debt of BHE. Otherwise, corporate interest declined 6% and 7%, respectively, in 2018 and 2017 as compared to the corresponding prior years, primarily due to lower average borrowings.
K-44
Table of Contents
Management’s Discussion and Analysis (Continued)
Utilities and Energy (“Berkshire Hathaway Energy Company”) (Continued)
Corporate interest and income taxes (Continued)
BHE’s consolidated effective income tax rates were (18.3)% in 2018, 5.9% in 2017 and 12.9% in 2016. BHE’s effective income tax rates regularly reflect significant production tax credits from wind-powered electricity generation placed in service by our domestic regulated utilities and other energy businesses. The decrease in the effective income tax rate in 2018 compared to 2017 was attributable to the reduction in the U.S. Federal corporate income tax rate, the impacts of rate making, adjustments to the amounts recorded for the repatriation tax on foreign earnings, higher production tax credits and lower U.S. income taxes on foreign earnings. The effective income tax rate in 2017 decreased versus 2016 primarily due to an increase in production tax credits.
Manufacturing, Service and Retailing
A summary of revenues and earnings of our manufacturing, service and retailing businesses follows (dollars in millions).
| Revenues | Earnings * | |||||||||||||||||||||||
| 2018 | 2017 | 2016 | 2018 | 2017 | 2016 | |||||||||||||||||||
| Manufacturing |
$ | 61,883 | $ | 57,645 | $ | 52,969 | $ | 9,366 | $ | 8,324 | $ | 7,735 | ||||||||||||
| Service and retailing |
78,926 | 76,994 | 74,467 | 2,942 | 2,603 | 2,489 | ||||||||||||||||||
|
|
|
|
|
|
|
|
|
|
|
|
|
|||||||||||||
| $ | 140,809 | $ | 134,639 | $ | 127,436 | |||||||||||||||||||
|
|
|
|
|
|
|
|||||||||||||||||||
| Pre-tax earnings |
12,308 | 10,927 | 10,224 | |||||||||||||||||||||
| Income taxes and noncontrolling interests |
2,944 | 3,645 | 3,421 | |||||||||||||||||||||
|
|
|
|
|
|
|
|||||||||||||||||||
| $ | 9,364 | $ | 7,282 | $ | 6,803 | |||||||||||||||||||
|
|
|
|
|
|
|
|||||||||||||||||||
| Effective income tax rate |
23.4% | 32.8% | 33.0% | |||||||||||||||||||||
|
|
|
|
|
|
|
|||||||||||||||||||
| * | Excludes certain acquisition accounting expenses, which primarily related to the amortization of identified intangible assets recorded in connection with our business acquisitions. The after-tax acquisition accounting expenses excluded from earnings above were $932 million in 2018, $937 million in 2017 and $814 million in 2016. These expenses are included in “Other” in the summary of earnings on page K-32 and in the “Other” earnings section on page K-53. |
Manufacturing
Our manufacturing group includes a variety of industrial, building and consumer products businesses. Industrial products group includes specialty chemicals (The Lubrizol Corporation (“Lubrizol”)), complex metal products for aerospace, power and general industrial markets (Precision Castparts Corp. (“PCC”)), metal cutting tools/systems (IMC International Metalworking Companies (“IMC”)), equipment and systems for the livestock and agricultural industries (CTB International (“CTB”)), and a variety of industrial products for diverse markets (Marmon, Scott Fetzer and LiquidPower Specialty Products (“LSPI”)). Marmon includes UTLX Company (“UTLX”), which provides various products and services (including equipment leasing) for the rail and mobile crane industries.
The building products group includes homebuilding and manufactured housing finance (Clayton Homes), flooring (Shaw), insulation, roofing and engineered products (Johns Manville), bricks and masonry products (Acme Building Brands), paint and coatings (Benjamin Moore), and residential and commercial construction and engineering products and systems (MiTek). The consumer products group includes leisure vehicles (Forest River), several apparel and footwear operations (including Fruit of the Loom, Garan, H.H. Brown Shoe Group and Brooks Sports) and the Duracell Company (“Duracell”), a manufacturer of high performance alkaline batteries. This group also includes custom picture framing products (Larson Juhl) and jewelry products (Richline). A summary of revenues and pre-tax earnings of our manufacturing operations follows (dollars in millions).
| Revenues | Pre-tax earnings | |||||||||||||||||||||||
| 2018 | 2017 | 2016 | 2018 | 2017 | 2016 | |||||||||||||||||||
| Industrial products |
$ | 30,679 | $ | 28,566 | $ | 26,935 | $ | 5,822 | $ | 5,065 | $ | 4,989 | ||||||||||||
| Building products |
18,677 | 16,946 | 15,002 | 2,336 | 2,147 | 1,922 | ||||||||||||||||||
| Consumer products |
12,527 | 12,133 | 11,032 | 1,208 | 1,112 | 824 | ||||||||||||||||||
|
|
|
|
|
|
|
|
|
|
|
|
|
|||||||||||||
| $ | 61,883 | $ | 57,645 | $ | 52,969 | $ | 9,366 | $ | 8,324 | $ | 7,735 | |||||||||||||
|
|
|
|
|
|
|
|
|
|
|
|
|
|||||||||||||
K-45
Table of Contents
Management’s Discussion and Analysis (Continued)
Manufacturing, Service and Retailing (Continued)
Industrial products
2018 versus 2017
Revenues from industrial products businesses were approximately $30.7 billion in 2018, an increase of approximately $2.1 billion (7.4%) compared to 2017. PCC’s revenues in 2018 were $10.2 billion, an increase of 7.2% compared to 2017. The increase reflected increased demand in aerospace markets in connection with new aircraft programs, partly offset by lower demand for industrial gas turbine products. PCC is in the process of repurposing certain manufacturing assets previously used to support industrial gas turbine business to accommodate aerospace products. In addition, PCC experienced lower sales of certain pipe products in 2018, primarily attributable to the U.S tariffs.
Lubrizol’s revenues in 2018 were $6.8 billion, an increase of 5.9% compared to 2017 due to higher average sales prices, favorable changes in product mix and foreign currency translation effects, and a 2% increase in aggregate unit volumes. Lubrizol experienced significant increases in average material unit costs during 2018 and 2017, necessitating increases in sales prices. Lubrizol’s consolidated volume included increases in the Advanced Materials (5%) and the Additives (1%) product lines.
Marmon’s revenues in 2018 were $8.2 billion, an increase of 5.5% as compared to 2017. The revenue increase was primarily attributable to volume increases in the Transportation Products sector, higher average metals prices in the Plumbing & Refrigeration, Electrical Products, and Metal Services sectors, and business acquisitions in the Transportation Products, Crane Services, and Engineered Wire & Cable sectors. These increases were partially offset by revenue decreases in the Beverage Technologies and Rail Products and Services sectors. Rail Products and Services sector revenues decreased due to lower railcar lease revenues, partly offset by increased railcar equipment sales and repair services. Throughout 2018, the railcar leasing business experienced the negative effects of lower lease renewal rates for railcars versus the rates on expiring leases.
IMC’s revenues increased 16.1% in 2018 compared to 2017, due to a combination of factors, including higher unit sales, the effects of business acquisitions during 2017 and 2018, and foreign currency translation effects from a weaker average U.S. Dollar in the first half of 2018. CTB’s revenues increased 4.0% in 2018 versus 2017, due to favorable foreign currency translation effects and modest sales growth in protein production and processing systems.
Pre-tax earnings of the industrial products group were approximately $5.8 billion in 2018, an increase of $757 million (14.9%) compared to 2017. Pre-tax earnings as a percentage of revenues were 19.0% in 2018 and 17.7% in 2017. The comparative earnings increase was partially attributable to certain one-time charges at PCC and Lubrizol in 2017.
PCC’s pre-tax earnings increased 16.0% in 2018 compared to 2017. PCC’s earnings in 2017 included certain one-time inventory and impairment charges of $272 million. Results in 2018 were negatively affected by costs associated with the temporary unplanned shut-down of certain metals facilities, metal press outages and lower earnings from the industrial gas turbine business. The facilities that were shut-down gradually resumed production and were approximately 80% operational at the end of 2018. These facilities are expected to resume normal production in early 2019. In addition, the aforementioned new aircraft programs involve relatively complex manufacturing processes and manufacturing costs to-date have been relatively high, negatively affecting earnings. However, we expect costs will decline as processes improve and efficiencies develop.
Lubrizol’s pre-tax earnings in 2018 increased 43.5% compared to earnings in 2017, which included pre-tax losses of approximately $190 million related to Lubrizol’s disposition of an underperforming bolt-on business and related intangible asset impairments and restructuring charges. Before such charges, Lubrizol’s earnings increased 17%, reflecting the previously mentioned increases in sales volumes and selling prices, as well as lower other restructuring charges, lower net interest expense, and the favorable effects of foreign currency translation and ongoing expense control efforts, partly offset by higher raw material costs.
Marmon’s pre-tax earnings in 2018 decreased 5.6% compared to 2017. The decrease was primarily due to lower pre-tax earnings from the Rail Products and Services sector ($126 million) and the Foodservice Technologies and Retail Solutions sectors ($33 million), partially offset by increased earnings from the Transportation Products sector and a non-recurring gain of $42 million in 2018 from the sale of certain assets of the Beverage Technologies sector. The Rail Products and Services earnings decline was attributable to lower railcar leasing revenues and higher lease fleet repair costs.
K-46
Table of Contents
Management’s Discussion and Analysis (Continued)
Manufacturing, Service and Retailing (Continued)
Industrial products (Continued)
IMC’s pre-tax earnings increased significantly in 2018 compared to 2017, reflecting a combination of higher sales, increased manufacturing efficiencies, the effects of business acquisitions and ongoing expense control efforts, partly offset by higher raw material costs. CTB’s pre-tax earnings in 2018 were lower, primarily due to lower gross sales margins attributable to raw material cost increases and higher other operating expenses.
2017 versus 2016
Industrial products revenues were approximately $28.6 billion in 2017, an increase of approximately $1.6 billion (6.1%) versus 2016, reflecting increased revenues at several of our businesses. PCC’s revenues increased $754 million (8.6%) in 2017 compared to the eleven-month post-acquisition period in 2016. On a comparable full year-to-date basis, PCC’s revenues increased approximately 2.3% compared to 2016.
In 2017, PCC generated revenue increases from structural castings, airfoils and forged products and from business acquisitions, partly offset by lower revenues from airframe products and industrial gas turbine products used in power markets. Revenue increases associated with PCC’s transition into products for new aerospace programs were partly offset by revenue decreases from the winding down of prior programs. Lubrizol’s revenues increased $165 million (2.6%) compared to 2016, primarily due to higher unit volumes, partly offset by effects of the disposition of an underperforming business.
Marmon’s revenues increased $305 million (4.1%) in 2017 versus 2016, primarily due to business acquisitions and higher average metal prices, partly offset by lower overall volumes, changes in mix and lower leasing revenues from the Rail Products and Services sector. Railcar leasing revenues declined due to fewer railcars on lease at lower rates. During 2017, railcars available for lease exceeded demand, which contributed to the lower lease rates.
IMC’s revenues increased 13.3%, primarily due to increased customer demand and from business acquisitions. The global demand for cutting tools was generally higher in 2017. CTB’s revenues increased 5.3% in 2017 compared to 2016. The increase reflected the impact of a bolt-on business acquisition, partly offset by weak demand in the U.S. egg and poultry production markets and selling price pressures for grain storage systems.
Industrial products pre-tax earnings were approximately $5.1 billion in 2017, an increase of $76 million (1.5%) compared to 2016. Overall, pre-tax earnings as a percentage of revenues were 17.7% in 2017 and 18.5% in 2016.
PCC’s pre-tax earnings declined 12.5% in 2017 compared to the post-acquisition period in 2016, primarily due to certain one-time inventory and impairment charges. Lubrizol’s pre-tax earnings increased 17.3% in 2017 compared to 2016, due to the disposition in 2016 of an underperforming bolt-on business and ongoing cost containment efforts, partly offset by lower gross sales margins, which were primarily attributable to higher average raw material prices. In 2017, average raw material prices at Lubrizol, including base oil feedstock and petrochemicals, increased about 9% versus 2016.
Marmon’s earnings in 2017 declined 3.5% compared to 2016, primarily due to lower earnings of the Rail Products and Services sector, partially offset by the effects of business acquisitions and ongoing cost control efforts.
Building products
2018 versus 2017
Revenues of the building products group in 2018 were approximately $18.7 billion, an increase of 10.2% compared to 2017. Pre-tax earnings of the building products group were approximately $2.3 billion in 2018, an increase of 8.8% versus 2017. Overall, pre-tax earnings as a percentage of revenues were 12.5% in 2018 and 12.7% in 2017. The pre-tax earnings increase was primarily due to higher earnings from Clayton Homes and Shaw, partly offset by lower earnings from Johns Manville.
Clayton Homes’ revenues were $6,046 million in 2018, an increase of $1,036 million (20.7%) over 2017. The increase was driven by an increase in revenues from home sales of $971 million (28.2%), primarily due to a 105% increase in unit sales of site built homes attributable to businesses acquired over the last two years. Unit sales of manufactured homes in 2018 also increased 4.9% compared to 2017. Average unit prices of site built homes are considerably higher than traditional manufactured homes. In addition, interest income from lending activities increased 4% in 2018 compared to 2017 primarily due to increased average outstanding loan balances.
K-47
Table of Contents
Management’s Discussion and Analysis (Continued)
Manufacturing, Service and Retailing (Continued)
Building products (Continued)
Clayton Homes pre-tax earnings were $911 million in 2018, an increase of $145 million (19.0%) compared to 2017. The increase in earnings in 2018 was primarily attributable to a significant increase in earnings from home building (manufactured housing and site built homes) activities, which reflected the impact of increased home sales and margins, as well as increased earnings from lending activities. A significant part of Clayton Homes’ earnings derives from manufactured housing lending activities. Pre-tax earnings from lending activities in 2018 declined 2% compared to 2017, reflecting increased interest expense, attributable to higher average debt balances and interest rates and higher operating costs, which more than offset the increase in interest income. As of December 31, 2018 and 2017, aggregate loan balances outstanding were approximately $14.7 billion and $13.7 billion, respectively.
Revenues of our other building products businesses increased 5.8% in 2018 to approximately $12.6 billion compared to 2017. In 2018, Shaw’s sales increased 7.9% and Johns Manville’s sales increased 7.2% as compared to 2017. The increases reflected higher average selling prices, product mix changes and overall unit volume increases.
Raw material and production costs of our building products businesses were generally higher in 2018. In particular, costs for steel, titanium dioxide and petrochemicals were substantially higher in 2018 than in 2017, as were product delivery costs, due in part to the shortage of truck drivers in the U.S. These cost increases precipitated sales price increases, although such increases have lagged the increases in raw materials costs. As a result, the increase in pre-tax earnings in 2018 of our other building products businesses ($43 million or 3.1%) lagged the 5.8% increase in revenues.
2017 versus 2016
Building products revenues were approximately $16.9 billion in 2017, an increase of approximately $1.9 billion (13.0%) compared to 2016. The increase was primarily attributable to bolt-on business acquisitions by Clayton, Shaw and MiTek. The remainder of the increase reflected sales volume increases at MiTek, Benjamin Moore and Johns Manville, partly offset by changes in prices and product mix.
Clayton Homes’ revenues were approximately $5.0 billion in 2017, an increase of $780 million (18%) compared to 2016. The increase was primarily due to sales from newly-acquired site built home businesses, an increase in overall unit sales (9%) and higher average prices. Interest income from lending activities and other and financial services revenues increased 2% in 2017 compared to 2016.
Building products pre-tax earnings were $2.1 billion in 2017, an increase of $225 million (11.7%) compared to 2016. Pre-tax earnings as a percentage of revenues were 12.7% in 2017 and 12.8% in 2016. Clayton Homes’ pre-tax earnings increased $21 million (2.8%) in 2017 compared to 2016. Pre-tax earnings in 2017 from manufacturing, retailing and site built activities increased, while earnings from finance activities declined slightly. Clayton Homes’ earnings in 2017 also included a gain from a legal settlement, offset by increased employee healthcare, technology, marketing and other expenses. The comparative earnings increase reflected the effects of asset impairment, pension settlement and environmental claim charges of $107 million recorded in 2016 by Shaw and Benjamin Moore. The comparative earnings increase also was a result of bolt-on acquisitions, partly offset by comparative declines in average gross sales margin rates due to higher raw material and other production costs.
Consumer products
2018 versus 2017
Consumer products revenues were approximately $12.5 billion in 2018, an increase of $394 million (3.2%) compared to 2017, which was primarily due to revenue increases of Forest River and of our apparel and footwear businesses. Forest River’s revenues increased 2.6% in 2018, reflecting relatively unchanged unit sales versus 2017. However, over the second half of the year, comparative sales declined 5%, reflecting a 7% decline in units sold. Management attributes the slowing of sales, in part, to the effects of U.S. tariffs on steel products. Apparel and footwear revenues increased 4.6% to approximately $4.3 billion, primarily due to increased sales volume at Brooks Sports and Garan.
Pre-tax earnings were $1,208 million in 2018, an increase of $96 million (8.6%) compared to 2017. Pre-tax earnings as a percentage of revenues were 9.6% in 2018 and 9.2% in 2017. The increase in earnings reflected increases from Duracell and the apparel and footwear businesses, partly offset by lower earnings from Forest River and Larson Juhl.
K-48
Table of Contents
Management’s Discussion and Analysis (Continued)
Manufacturing, Service and Retailing (Continued)
Consumer products (Continued)
Forest River’s pre-tax earnings in 2018 declined 9.0% compared to 2017. Operating results were adversely affected over the second half of 2018, and in the fourth quarter in particular, by higher material costs, which, together with the effects of lower sales volumes, contributed to a 28% reduction in fourth quarter pre-tax earnings.
Pre-tax earnings of the apparel and footwear businesses increased 6.4% in 2018 compared to 2017, primarily attributable to the overall increase in revenues and sales mix changes. Duracell’s pre-tax earnings increased in 2018 compared to 2017, reflecting the favorable effects of ongoing operational improvement efforts and a comparative decline in restructuring charges. Since its acquisition in 2016, Duracell has undertaken significant transition and restructuring initiatives intended to restore and maintain adequate profit levels over the long-term.
2017 versus 2016
Consumer products revenues were approximately $12.1 billion in 2017, an increase of $1.1 billion (10%) compared to 2016, driven by increases from Duracell and Forest River. Duracell’s revenues increased 25.3% in 2017 compared to the ten-month post-acquisition period in 2016. Forest River’s revenues increased 13.7% in 2017 compared to 2016, reflecting a 13.5% comparative increase in units sold. Apparel and footwear revenues were approximately $4.2 billion in 2017, an increase of 1.6% compared to 2016.
Consumer products pre-tax earnings increased $288 million (35%) in 2017 compared to 2016. The increase in earnings was primarily due to increased earnings from Duracell and Forest River. The improvement in Duracell’s operating results in 2017 reflects an overall reduction in transition costs and the positive effects of ongoing restructuring and business development efforts. Forest River’s earnings increased 23% in 2017, primarily attributable to the increase in sales and lower manufacturing overhead rates. Earnings from apparel and footwear businesses increased 5% in 2017 compared to 2016, primarily due to increased earnings from the footwear businesses.
Service and retailing
A summary of revenues and pre-tax earnings of our service and retailing businesses follows (dollars in millions).
| Revenues | Pre-tax earnings | |||||||||||||||||||||||
| 2018 | 2017 | 2016 | 2018 | 2017 | 2016 | |||||||||||||||||||
| Service |
$ | 13,333 | $ | 12,155 | $ | 11,300 | $ | 1,836 | $ | 1,519 | $ | 1,399 | ||||||||||||
| Retailing |
15,606 | 15,064 | 15,092 | 860 | 785 | 659 | ||||||||||||||||||
| McLane Company |
49,987 | 49,775 | 48,075 | 246 | 299 | 431 | ||||||||||||||||||
|
|
|
|
|
|
|
|
|
|
|
|
|
|||||||||||||
| $ | 78,926 | $ | 76,994 | $ | 74,467 | $ | 2,942 | $ | 2,603 | $ | 2,489 | |||||||||||||
|
|
|
|
|
|
|
|
|
|
|
|
|
|||||||||||||
Service
Our service business group offers fractional ownership programs for general aviation aircraft (NetJets) and high technology training to operators of aircraft (FlightSafety). We also distribute electronic components (TTI) and franchise and service a network of quick service restaurants (Dairy Queen). Other service businesses include transportation equipment leasing (XTRA) and furniture leasing (CORT), electronic news distribution, multimedia and regulatory filings (Business Wire), publication of newspapers and other publications (Buffalo News and the BH Media Group) and operation of a television station in Miami, Florida (WPLG). We also offer third party logistics services that primarily serve the petroleum and chemical industries (Charter Brokerage).
K-49
Table of Contents
Management’s Discussion and Analysis (Continued)
Manufacturing, Service and Retailing (Continued)
Service (Continued)
2018 versus 2017
Revenues of the service group were approximately $13.3 billion in 2018, an increase of approximately $1.2 billion (9.7%) compared to 2017. TTI’s revenues in 2018 increased approximately 33.7% compared to 2017, reflecting industry-wide increases in demand for electronic components in many geographic markets around the world, and the effects of recent business acquisitions and favorable foreign currency translation effects. While TTI’s revenue increase in 2018 was significant, revenue growth began to moderate in the fourth quarter, in part attributable to the impact of U.S. trade tariffs. WPLG generated a revenue increase of 20.8% in 2018 over 2017, primarily due to increased political advertising revenue. Revenues of Charter Brokerage increased 53.3%, reflecting increased fees and product mix changes. Revenues of our leasing businesses increased 8.4% in 2018 compared to 2017 due to increased over-the road trailer units on lease (XTRA) and increased furniture rental income (CORT).
Pre-tax earnings of the service group in 2018 were approximately $1.8 billion, an increase of $317 million (20.9%) compared to 2017. The comparative earnings increase was primarily due to TTI, which accounted for almost 84% of the increase. The earnings increase of TTI was primarily due to the effects of the sales volume increases. In addition, XTRA, Charter Brokerage and NetJets each generated increased earnings in 2018 compared to 2017. The increases in earnings of these businesses were partly offset by lower earnings at FlightSafety, primarily due to reduced margins from sales of flight simulators and impairment charges of $41 million related to certain fixed assets.
2017 versus 2016
Service business revenues were approximately $12.2 billion in 2017, an increase of $855 million (7.6%) compared to 2016. The increase was primarily attributable to TTI and NetJets. TTI’s revenues increased 16.4% in 2017 compared to 2016, primarily due to higher customer demand. NetJets’ revenues increased due to an increase in revenue flight hours and increased aircraft management services.
Pre-tax earnings were approximately $1.5 billion in 2017, an increase of $120 million (8.6%) compared to 2016. The comparative increase in earnings was primarily attributable to increased earnings of NetJets and TTI, partly offset by comparatively lower earnings from FlightSafety, and from our leasing, media and logistics businesses.
Retailing
Our retailers include Berkshire Hathaway Automotive (“BHA”). BHA includes over 80 auto dealerships that sell new and pre-owned automobiles, and offer repair services and related products. BHA also operates two insurance businesses, two auto auctions and an automotive fluid maintenance products distributor. Our retailing businesses also include four home furnishings retailing businesses (Nebraska Furniture Mart, R.C. Willey, Star Furniture and Jordan’s), which sell furniture, appliances, flooring and electronics.
Other retailing businesses include three jewelry retailing businesses (Borsheims, Helzberg and Ben Bridge), See’s Candies (confectionary products), Pampered Chef (high quality kitchen tools), Oriental Trading Company (party supplies, school supplies and toys and novelties) and Detlev Louis Motorrad (“Louis”), a Germany-based retailer of motorcycle accessories.
2018 versus 2017
Revenues of the retailing group were approximately $15.6 billion in 2018, an increase of $542 million (3.6%) compared to 2017. BHA’s revenues, which represented approximately 63% of the aggregate retailing revenues in each of the past three years, increased 4.0% in 2018 as compared to 2017. The increase derived primarily from increased pre-owned vehicle sales and service contract revenues. Revenues from new vehicle sales were relatively unchanged. Louis revenues increased 7.8% in 2018 versus 2017, primarily due to the translation effects of a weaker average U.S. Dollar. Home furnishings revenues increased 4.7% in 2018 over 2017, reflecting increased sales in certain geographic markets and the effect of a new store.
Pre-tax earnings of the retailing group were $860 million in 2018, an increase of $75 million (9.6%) over 2017. The earnings increase included higher earnings from BHA and Louis, partly offset by lower earnings from the home furnishings retailers. The earnings increase of BHA was primarily from finance and service contract activities, partly offset by higher floorplan interest expense. The earnings increase at Louis reflected the revenues increase and an increase in operating margin rate. Earnings of the home furnishings businesses declined 2.4% in 2018 compared to 2017, partly due to increased inventory liquidation, delivery and occupancy costs at Star Furniture.
K-50
Table of Contents
Management’s Discussion and Analysis (Continued)
Manufacturing, Service and Retailing (Continued)
Retailing (Continued)
2017 versus 2016
Retailing revenues were $15.1 billion in 2017, slightly lower than in 2016. BHA’s aggregate revenues declined 1.3% in 2017 compared to 2016, due primarily due to a 3.7% decline in new and used cars sold, partly offset by higher service and finance revenues. Revenues of our other retailers increased 1.7% in 2017 compared to 2016.
Pre-tax earnings increased $126 million (19.1%) in 2017 as compared to 2016. The increase reflected comparatively higher earnings from BHA, primarily due to increased earnings from service contract and finance activities and lower selling and administrative expenses, partly offset by lower auto sales volumes and margins. Pre-tax earnings of our home furnishings retailers increased 6.5% in 2017 compared to 2016. Pampered Chef also produced comparatively higher earnings in 2017, primarily attributable to revenue increases and expense management efforts.
McLane Company
McLane operates a wholesale distribution business that provides grocery and non-food consumer products to retailers and convenience stores (“grocery”) and to restaurants (“foodservice”). McLane also operates businesses that are wholesale distributors of distilled spirits, wine and beer (“beverage”). The grocery and foodservice businesses generate high sales and very low profit margins. These businesses have several significant customers, including Walmart, 7-Eleven, Yum! Brands and others. Grocery sales comprised approximately 67% of McLane’s consolidated sales in 2018 with food service comprising most of the remainder. A curtailment of purchasing by any of its significant customers could have an adverse impact on periodic revenues and earnings.
McLane’s revenues were approximately $50.0 billion in 2018, slightly higher than 2017, reflecting a slight increase in grocery sales (1%) and a slight decrease in foodservice sales (1%). The decline in foodservice revenues was primarily due to a net loss of customers. Pre-tax earnings were $246 million in 2018, a decline of $53 million (17.7%), compared to 2017. McLane’s grocery and foodservice businesses continue to operate in a highly competitive business environment, which is negatively affecting its current operating results. While gross margin rates increased slightly over 2018, increases in fuel, depreciation and certain other operating expenses more than offset the increase, producing a decline in pre-tax earnings compared to 2017. We expect the current unfavorable operating conditions will continue in 2019.
McLane’s revenues were approximately $49.8 billion in 2017, an increase of 3.5% compared to 2016. The increase in revenues was primarily due to a 4.7% increase in grocery business sales. Pre-tax earnings in 2017 were $299 million, a decrease of $132 million (30.6%) compared to 2016. The earnings decline reflected a 57% decline in earnings from our grocery operations, partly offset by a $39 million increase in gains from asset sales. Throughout 2017, significant pricing pressures and an increasingly competitive business environment negatively affected McLane’s operating results, particularly with respect to the grocery business.
Investment and Derivative Gains (Losses)
A summary of investment and derivative gains and losses follows (dollars in millions).
| 2018 | 2017 | 2016 | ||||||||||
| Investment gains (losses) |
$ | (22,155 | ) | $ | 1,410 | $7,553 | ||||||
| Derivative gains (losses) |
(300 | ) | 718 | 751 | ||||||||
|
|
|
|
|
|
|
|||||||
| Gains (losses) before income taxes and noncontrolling interests |
(22,455 | ) | 2,128 | 8,304 | ||||||||
| Income taxes and noncontrolling interests |
(4,718 | ) | 751 | 1,807 | ||||||||
|
|
|
|
|
|
|
|||||||
| Net gains (losses) |
$ | (17,737 | ) | $ | 1,377 | $6,497 | ||||||
|
|
|
|
|
|
|
|||||||
| Effective income tax rate |
20.8% | 34.9% | 21.8% | |||||||||
|
|
|
|
|
|
|
|||||||
K-51
Table of Contents
Management’s Discussion and Analysis (Continued)
Investment and Derivative Gains (Losses) (Continued)
Investment gains (losses)
As discussed in Note 1(w) to the accompanying Consolidated Financial Statements, on January 1, 2018, we adopted a new accounting pronouncement (“ASU 2016-01”), which requires the recognition of unrealized gains and losses arising from changes in market values of investments in equity securities in the Consolidated Statements of Earnings. Prior to 2018, investment gains/losses related to equity securities were generally recorded as the securities were sold, redeemed or exchanged based on the cost of the disposed securities. While ASU 2016-01 does not affect our consolidated shareholders’ equity or total comprehensive income, it has significantly increased the volatility of our periodic net earnings due to the magnitude of our equity securities portfolio and the inherent volatility of equity securities prices. Investment gains and losses from periodic changes in securities prices will continue to cause significant volatility in our consolidated earnings.
Pre-tax investment gains/losses reflected in earnings in 2018 included net unrealized losses of approximately $22.7 billion from investments in equity securities still held at December 31, 2018, reflecting the declines in securities prices in the fourth quarter. Prior to the adoption of ASU 2016-01, such unrealized gains and losses were included in other comprehensive income. Pre-tax net unrealized gains on equity securities recorded in other comprehensive income were approximately $29 billion in 2017 and $7 billion in 2016.
Pre-tax investment gains were approximately $1.4 billion in 2017 and $7.6 billion in 2016. Investment gains in 2016 included $4.2 billion from the redemptions of our Wrigley and Kraft Heinz preferred stock investments and from the sales of Dow Chemical common stock that was received upon the conversion of our Dow Chemical preferred stock investment. We also realized pre-tax gains of $1.1 billion in connection with the tax-free exchange of our shares of P&G common stock for 100% of the common stock of Duracell. Income tax expense allocated to investment gains in 2016 included a benefit from the reduction of certain deferred income tax liabilities in connection with the exchange of P&G common stock for Duracell. Our after-tax gain from this transaction was approximately $1.9 billion.
We believe that investment gains/losses, whether realized from sales or unrealized from changes in market prices, are often meaningless in terms of understanding our reported consolidated earnings or evaluating our periodic economic performance. We continue to believe the amount of investment gains/losses included in earnings, including the changes in market prices for equity securities, in any given period has little analytical or predictive value.
Derivative gains (losses)
Derivative contract gains/losses include the changes in fair value of our equity index put option contract liabilities. These liabilities relate to contracts entered into before March 2008. Substantially all of these contracts will expire between April 2019 and February 2023. The periodic changes in the fair values of these liabilities are recorded in earnings and can be significant, reflecting the volatility of underlying equity markets and the changes in the inputs used to measure such liabilities.
As of December 31, 2018, the intrinsic value of our equity index put option contracts was approximately $1,653 million and our recorded liabilities at fair value were approximately $2,452 million. Our ultimate payment obligations, if any, under our contracts will be determined as of the contract expiration dates based on the intrinsic value as defined under the contracts. Contracts with an aggregate notional value of approximately $12.2 billion will expire in 2019.
Derivative contracts produced pre-tax losses in 2018 of $300 million, which were primarily due to lower index values. Equity index put option contracts produced pre-tax gains of $718 million in 2017 and $662 million in 2016, which reflected the effects of shorter remaining contract durations and overall higher index values. In July 2016, our last credit default contract was terminated by mutual agreement with the counterparty and we paid the counterparty $195 million. This contract produced pre-tax earnings of $89 million in 2016.
K-52
Table of Contents
Management’s Discussion and Analysis (Continued)
Other
A summary of after-tax other earnings (losses) follows (in millions).
| 2018 | 2017 | 2016 | ||||||||||
| Equity method earnings (losses) |
$ | (1,419) | $ | 1,111 | $ | 707 | ||||||
| Acquisition accounting expenses |
(1,111) | (936) | (846) | |||||||||
| Corporate interest expense, before foreign currency effects |
(311) | (266) | (256) | |||||||||
| Euro note foreign exchange gains (losses) |
289 | (655) | 159 | |||||||||
| Corporate interest and dividend income |
530 | 232 | 288 | |||||||||
| Other |
456 | 29 | (83) | |||||||||
|
|
|
|
|
|
|
|||||||
| Net earnings (losses) attributable to Berkshire Hathaway shareholders |
$ | (1,566) | $ | (485) | $ | (31) | ||||||
|
|
|
|
|
|
|
|||||||
After-tax equity method earnings includes Berkshire’s share of earnings attributable to Kraft Heinz, Pilot Flying J, Berkadia and Electric Transmission of Texas. Our after-tax equity method losses in 2018 included approximately $2.7 billion from intangible asset impairment charges recorded by Kraft Heinz. Our after-tax equity method earnings in 2017 excluded approximately $1.1 billion from the net effects of the TCJA on Kraft Heinz’s net earnings. Corporate interest and dividend income in 2016 included pre-tax dividend income of $180 million from our Kraft Heinz preferred stock investment, which Kraft Heinz redeemed in June 2016.
After-tax other earnings (losses) also include charges arising from the application of the acquisition method in connection with certain of Berkshire’s past business acquisitions. Such charges were primarily from the amortization or impairment of intangible assets recorded in connection with those business acquisitions.
Berkshire issued Euro denominated debt in 2015, 2016 and 2017 and the aggregate par amount outstanding was €6.85 billion at December 31, 2018. Changes in foreign currency exchange rates produced sizable non-cash unrealized gains and losses in each of the past three years from the periodic revaluation of these liabilities into U.S. Dollars.
Financial Condition
Our consolidated balance sheet continues to reflect significant liquidity and a strong capital base. Consolidated shareholders’ equity at December 31, 2018 was approximately $349 billion, a decrease of $26.9 billion since September 30, 2018 and an increase of $407 million since December 31, 2017. Net earnings attributable to Berkshire shareholders in 2018 were $4.0 billion, which included after-tax losses on our investments of approximately $17.5 billion. After-tax losses on investments were approximately $27.6 billion in the fourth quarter of 2018, reflecting the declines in market prices of the equity securities we owned at December 31, 2018.
At December 31, 2018, our insurance and other businesses held cash, cash equivalents and U.S. Treasury Bills of approximately $109 billion, which included $85 billion in U.S. Treasury Bills. Investments in equity and fixed maturity securities (excluding our investment in Kraft Heinz) were approximately $193 billion.
Berkshire parent company debt outstanding at December 31, 2018 was approximately $16.9 billion, a decrease of $1.9 billion since December 31, 2017, reflecting term debt maturities of $1.55 billion and a $366 million decrease attributable to foreign currency exchange rate changes applicable to the €6.85 billion par amount of Euro denominated senior notes. Berkshire parent company debt of $750 million matures in 2019.
Borrowings of Berkshire’s insurance and other subsidiaries declined $3.5 billion in 2018 to approximately $18.1 billion at December 31, 2018, primarily attributable to a net decrease in borrowings of Berkshire Hathaway Finance Corporation (“BHFC”), a wholly-owned financing subsidiary. During 2018, BHFC repaid $4.6 billion of maturing senior notes and issued $2.35 billion of 4.2% senior notes due in 2048. BHFC’s senior note borrowings are used to fund loans originated and acquired by Clayton Homes and a portion of assets held for lease by our UTLX railcar leasing business. In January 2019, BHFC repaid $950 million of maturing senior notes and issued $1.25 billion of 4.25% senior notes due in 2049. An additional $3.0 billion of BHFC senior notes will mature in 2019. Berkshire guarantees the full and timely payment of principal and interest with respect to BHFC’s senior notes.
Our railroad, utilities and energy businesses (conducted by BNSF and BHE) maintain very large investments in capital assets (property, plant and equipment) and will regularly make significant capital expenditures in the normal course of business. We forecast capital expenditures of these two operations will approximate $10.5 billion for the year ending December 31, 2019.
K-53
Table of Contents
Management’s Discussion and Analysis (Continued)
Financial Condition (Continued)
BNSF’s outstanding debt approximated $23.2 billion as of December 31, 2018, an increase of $727 million since December 31, 2017. In 2018, BNSF issued $1.5 billion of senior unsecured debentures due in 2048 with a weighted average interest rate of 4.1%. BNSF debentures of $750 million will mature in 2019.
Outstanding borrowings of BHE and its subsidiaries were approximately $39.3 billion at December 31, 2018, a decrease of $390 million since December 31, 2017. In 2018, BHE issued $3.2 billion of senior unsecured debt with maturities ranging from 2021 to 2049 with a weighted average interest rate of 3.6%. BHE subsidiaries also issued debt in 2018, aggregating $2.3 billion with maturity dates ranging from 2020 to 2049. The proceeds from these financings were used to repay borrowings, to fund capital expenditures and for other general corporate purposes. Approximately $2.1 billion of BHE subsidiary term debt will mature in 2019. Berkshire does not guarantee the repayment of debt issued by BNSF, BHE or any of their subsidiaries and is not committed to provide capital to support BNSF, BHE or any of their subsidiaries.
Berkshire’s common stock repurchase program was amended on July 17, 2018, permitting Berkshire to repurchase its Class A and Class B shares at prices below Berkshire’s intrinsic value, as conservatively determined by Warren Buffett, Berkshire’s Chairman of the Board and Chief Executive Officer, and Charlie Munger, Vice Chairman of the Board. The program allows share repurchases in the open market or through privately negotiated transactions and does not specify a maximum number of shares to be repurchased. The program is expected to continue indefinitely. We will not repurchase our stock if it reduces the total amount of Berkshire’s consolidated cash, cash equivalents and U.S. Treasury Bills holdings below $20 billion. Financial strength and redundant liquidity will always be of paramount importance at Berkshire. Subsequent to the program amendment, in 2018, Berkshire repurchased shares of Class A and B common stock for an aggregate cost of approximately $1.3 billion.
Contractual Obligations
We are party to contracts associated with ongoing business and financing activities, which will result in cash payments to counterparties in future periods. Certain obligations are included in our Consolidated Balance Sheets, such as notes payable, which require future payments on contractually specified dates and in fixed and determinable amounts. Other obligations pertaining to the acquisition of goods or services in the future, such as minimum rentals under operating leases and certain purchase obligations not currently reflected in the financial statements, will be recognized in future periods as the goods are delivered or services are provided. Beginning in 2019, operating lease obligations will be included in the consolidated balance sheet upon the adoption of a new accounting pronouncement. The timing and amount of the payments under certain contracts, such as insurance and reinsurance contracts, are contingent upon the outcome of future events. Actual payments will likely vary, perhaps materially, from the estimated liabilities currently recorded in our Consolidated Balance Sheet.
A summary of our contractual obligations as of December 31, 2018 follows (in millions). Actual payments will likely vary, perhaps significantly, from estimates reflected in the table.
| Estimated payments due by period | ||||||||||||||||||||
| Total | 2019 | 2020-2021 | 2022-2023 | After 2023 | ||||||||||||||||
| Notes payable and other borrowings, including interest |
$ | 153,059 | $ | 15,840 | $ | 17,777 | $ | 20,341 | $ | 99,101 | ||||||||||
| Operating leases |
9,013 | 1,360 | 2,415 | 1,580 | 3,658 | |||||||||||||||
| Purchase obligations (1) |
47,264 | 15,709 | 8,181 | 6,078 | 17,296 | |||||||||||||||
| Unpaid losses and loss adjustment expenses (2) |
110,292 | 22,204 | 25,329 | 14,613 | 48,146 | |||||||||||||||
| Life, annuity and health insurance benefits (3) |
34,362 | 1,461 | (82) | 322 | 32,661 | |||||||||||||||
| Other |
15,589 | 628 | 1,748 | 4,876 | 8,337 | |||||||||||||||
|
|
|
|
|
|
|
|
|
|
|
|||||||||||
| Total |
$ | 369,579 | $ | 57,202 | $ | 55,368 | $ | 47,810 | $ | 209,199 | ||||||||||
|
|
|
|
|
|
|
|
|
|
|
|||||||||||
| (1) | Primarily related to fuel, capacity, transmission and maintenance contracts and capital expenditure commitments of BHE and BNSF and aircraft purchase commitments of NetJets. |
| (2) | Includes unpaid losses and loss adjustment expenses under retroactive reinsurance contracts. |
| (3) | Amounts represent estimated undiscounted benefits, net of estimated future premiums, as applicable. |
K-54
Table of Contents
Management’s Discussion and Analysis (Continued)
Critical Accounting Policies
Certain accounting policies require us to make estimates and judgments in determining the amounts reflected in the Consolidated Financial Statements. Such estimates and judgments necessarily involve varying, and possibly significant, degrees of uncertainty. Accordingly, certain amounts currently recorded in the financial statements will likely be adjusted in the future based on new available information and changes in other facts and circumstances. A discussion of our principal accounting policies that required the application of significant judgments as of December 31, 2018 follows.
Property and casualty losses
We record liabilities for unpaid losses and loss adjustment expenses (also referred to as “gross unpaid losses” or “claim liabilities”) based upon estimates of the ultimate amounts payable for losses occurring on or before the balance sheet date. The timing and amount of ultimate loss payments are contingent upon, among other things, the timing of claim reporting from insureds and ceding companies and the final determination of the loss amount through the loss adjustment process. We use a variety of techniques in establishing claim liabilities and all techniques require significant judgments and assumptions.
As of the balance sheet date, recorded claim liabilities include provisions for reported claims, as well as claims not yet reported and the development of reported claims. The period between the loss occurrence date and loss settlement date is the “claim-tail.” Property claims usually have relatively short claim-tails, absent litigation. Casualty claims usually have longer claim-tails, occasionally extending for decades. Casualty claims may be more susceptible to litigation and the impact of changing contract interpretations. The legal environment and judicial process further contribute to extending claim-tails.
Our consolidated claim liabilities as of December 31, 2018 were approximately $110 billion, of which 84% related to GEICO and the Berkshire Hathaway Reinsurance Group. Additional information regarding significant uncertainties inherent in the processes and techniques of these businesses follows.
GEICO
GEICO predominantly writes private passenger auto insurance. As of December 31, 2018, GEICO’s gross unpaid losses were $19.5 billion. Claim liabilities, net of reinsurance recoverable were $18.6 billion.
GEICO’s claim reserving methodologies produce liability estimates based upon the individual claims. The key assumptions affecting our liability estimates include projections of ultimate claim counts (“frequency”) and average loss per claim (“severity”). We utilize a combination of several actuarial estimation methods, including Bornhuetter-Ferguson and chain-ladder methodologies.
Claim liability estimates for automobile liability coverages (such as bodily injury (“BI”), uninsured motorists, and personal injury protection) are more uncertain due to the longer claim-tails, so we establish additional case development estimates. As of December 31, 2018, case development liabilities averaged approximately 30% of the case reserves. We select case development factors through analysis of the overall adequacy of historical case liabilities.
For incurred-but-not-reported (“IBNR”) claims, liabilities are based on projections of the ultimate number of claims expected (reported and unreported) for each significant coverage. We use historical claim count data to develop age-to-age projections of the ultimate counts by quarterly accident period, from which we deduct reported claims to produce the number of unreported claims. We estimate the average costs per unreported claim and apply such estimates to the unreported claim counts, producing an IBNR liability estimate. We may record additional IBNR estimates when actuarial techniques are difficult to apply.
We test the adequacy of the aggregate claim liabilities using one or more actuarial projections based on claim closure models, and paid and incurred loss triangles. Each type of projection analyzes loss occurrence data for claims occurring in a given period and projects the ultimate cost.
Our claim liability estimates recorded at the end of 2017 decreased $222 million during 2018, which produced a corresponding increase to pre-tax earnings. We modified the assumptions used to estimate liabilities at December 31, 2018 to reflect the most recent frequency and severity results. Future development of recorded liabilities will depend on whether actual frequency and severity are more or less than anticipated.
With respect to liabilities for BI claims, our most significant claim category, we believe it is reasonably possible that average severities will change by at least one percentage point from the severities used in establishing the recorded liabilities at December 31, 2018. We estimate that a one percentage point increase or decrease in BI severities would produce a $275 million increase or decrease in recorded liabilities, with a corresponding decrease or increase in pre-tax earnings. Many of the economic forces that would likely cause BI severity to differ from expectations would likely also cause severities for other injury coverages to differ in the same direction.
K-55
Table of Contents
Management’s Discussion and Analysis (Continued)
Property and casualty losses (Continued)
Berkshire Hathaway Reinsurance Group (“BHRG”)
BHRG’s liabilities for unpaid losses and loss adjustment expenses derive primarily from reinsurance contracts issued through NICO and General Re. In connection with reinsurance contracts, the nature, extent, timing and perceived reliability of premium and loss information received from ceding companies varies widely depending on the type of coverage and the contractual reporting terms. Contract terms, conditions and coverages also tend to lack standardization and may evolve more rapidly than primary insurance policies.
The nature and extent of loss information provided under many facultative (individual risk), per occurrence excess or retroactive reinsurance contracts may not differ significantly from the information received under a primary insurance contract if reinsurer personnel either work closely with the ceding company in settling individual claims or manage the claims themselves. However, loss information is often less detailed with respect to aggregate excess-of-loss and quota-share contracts. Additionally, loss information we receive through periodic reports is often in a summary format rather than on an individual claim basis. Loss data includes recoverable paid losses, as well as case loss estimates. Ceding companies infrequently provide reliable IBNR estimates to reinsurers.
Loss reporting to reinsurers is typically slower in comparison to primary insurers. Periodic premium and claims reports are required from ceding companies. In the U.S., such reports are generally required at quarterly intervals ranging from 30 to 90 days after the end of the quarterly period. Outside of the U.S., reinsurance reporting practices may vary further. In certain countries, clients report annually, often 90 to 180 days after the end of the annual period. In some instances, reinsurers assume and cede underlying risks thereby creating multiple contractual parties between us and the primary insured, potentially compounding the claim reporting delays. The relative impact of reporting delays on the reinsurer may vary depending on the type of coverage, contractual reporting terms, the magnitude of the claim relative to the attachment point of the reinsurance coverage, and for other reasons.
As reinsurers, the premium and loss data we receive is at least one level removed from the underlying claimant, so there is a risk that the loss data reported is incomplete, inaccurate or the claim is outside the coverage terms. When received, we review the information for completeness and compliance with the contract terms. Generally, our reinsurance contracts permit us to access the ceding company’s books and records with respect to the subject business, thus providing the ability to audit the reported information. In the normal course of business, disputes occasionally arise concerning whether claims are covered by our reinsurance policies. We resolve most coverage disputes through negotiation with the client. If disputes cannot be resolved, our contracts generally provide arbitration or alternative dispute resolution processes. There are no coverage disputes at this time for which an adverse resolution would likely have a material impact on our consolidated results of operations or financial condition.
A summary of BHRG’s property and casualty unpaid losses and loss adjustment expenses, other than retroactive reinsurance losses and loss adjustment expenses, as of December 31, 2018 follows (in millions).
| General Re | NICO | Total | ||||||||||||||||||||||||||||||||||
| Property | Casualty | Total | Property | Casualty | Total | Property | Casualty | Total | ||||||||||||||||||||||||||||
| Reported case liabilities |
$ | 1,682 | $ | 6,310 | $ | 7,992 | $ | 3,903 | $ | 3,194 | $ | 7,097 | $ | 5,585 | $ | 9,504 | $ | 15,089 | ||||||||||||||||||
| IBNR liabilities |
1,657 | 7,126 | 8,783 | 2,550 | 4,440 | 6,990 | 4,207 | 11,566 | 15,773 | |||||||||||||||||||||||||||
|
|
|
|
|
|
|
|
|
|
|
|
|
|
|
|
|
|
|
|||||||||||||||||||
| Gross unpaid losses and loss adjustment expenses |
3,339 | 13,436 | 16,775 | 6,453 | 7,634 | 14,087 | 9,792 | 21,070 | 30,862 | |||||||||||||||||||||||||||
| Reinsurance recoverable |
285 | 668 | 953 | 27 | 182 | 209 | 312 | 850 | 1,162 | |||||||||||||||||||||||||||
|
|
|
|
|
|
|
|
|
|
|
|
|
|
|
|
|
|
|
|||||||||||||||||||
| Net unpaid losses and loss adjustment expenses |
$ | 3,054 | $ | 12,768 | $ | 15,822 | $ | 6,426 | $ | 7,452 | $ | 13,878 | $ | 9,480 | $ | 20,220 | $ | 29,700 | ||||||||||||||||||
|
|
|
|
|
|
|
|
|
|
|
|
|
|
|
|
|
|
|
|||||||||||||||||||
Gross unpaid losses and loss adjustment expenses in the table above consist primarily of traditional property and casualty coverages written primarily under excess-of-loss and quota-share treaties. Under certain contracts, coverage can apply to multiple lines of business written and the ceding company may not report loss data by such lines consistently, if at all. In those instances, we allocated losses to property and casualty coverages based on internal estimates.
K-56
Table of Contents
Management’s Discussion and Analysis (Continued)
Property and casualty losses (Continued)
Berkshire Hathaway Reinsurance Group (“BHRG”) (Continued)
With respect to General Re, we use a variety of actuarial methodologies to establish unpaid losses and loss adjustment expenses. Certain methodologies, such as paid and incurred loss development techniques, incurred and paid loss Bornhuetter-Ferguson techniques and frequency and severity techniques, are utilized, as well as ground-up techniques when appropriate. The critical processes involved in estimating unpaid losses and loss adjustment expenses include the establishment of case liability estimates, the determination of expected loss ratios and loss reporting patterns, which drive IBNR liability estimates, and the comparison of reported activity to the expected loss reporting patterns.
General Re’s process for estimating unpaid losses and loss adjustment expenses starts with case loss estimates reported by ceding companies. We independently evaluate certain reported case losses and if appropriate, we use our own case liability estimate. As of December 31, 2018, our case loss estimates exceeded ceding company estimates by approximately $2.0 billion, which were concentrated in legacy workers’ compensation claims occurring over 10 years ago. We also periodically conduct detailed reviews of individual client claims, which may cause us to adjust our case estimates.
In estimating IBNR liabilities, General Re considers expected case loss emergence and development patterns, together with expected loss ratios by year. In this process, we classify all loss and premium data into groups or portfolios of policies based primarily on product type (e.g., treaty, facultative and program), line of business (e.g., auto liability, property and workers’ compensation) and/or geographic jurisdiction, and in some cases contractual features or market segment. For each portfolio, we aggregate premiums and losses by accident year or coverage period and analyze the paid and incurred loss data over time. We estimate the expected development of reported claims, which, together with the expected loss ratios, are used to calculate IBNR liability estimates. Factors affecting our loss development analysis include, but are not limited to, changes in the following: client claims reporting and settlement practices; the frequency of client company claim reviews; policy terms and coverage (such as loss retention levels and occurrence and aggregate policy limits); loss trends; and legal trends that result in unanticipated losses. Collectively, these factors influence our selections of expected case loss emergence patterns.
NICO generally establishes reinsurance claim liabilities on a contract-by-contract basis determined from case loss estimates reported by ceding companies and IBNR liabilities that are primarily a function of an anticipated loss ratio for the contract and the reported case loss estimates. Liabilities are adjusted upward or downward over time to reflect case losses reported versus expected case losses, which we use to form revised judgments on the adequacy of the expected loss ratio and the level of IBNR liabilities required for unreported claims. Anticipated loss ratios are also revised to include estimates of known major catastrophe events.
Certain catastrophe, individual risk and aviation excess-of-loss contracts tend to generate low frequency/high severity losses. Our processes and techniques for estimating liabilities under such contracts generally rely more on a per-policy assessment of the ultimate cost associated with the individual loss event rather than with an analysis of the historical development patterns of past losses.
BHRG’s estimated ultimate net losses for prior years’ loss events were reduced $469 million in 2018, which produced a corresponding increase in pre-tax earnings. Reported claims for prior years’ property loss events were less than anticipated and we reduced our estimated ultimate liabilities by $365 million. Property losses incurred during any given period may be more volatile because of the effect of catastrophe and large individual property loss events. In addition, we lowered estimated ultimate losses for prior years’ casualty events $104 million in 2018, reflecting reduced estimates for workers’ compensation and other casualty coverages, partially offset by an increase in estimates for asbestos, environmental and other latent injury claims.
General Re’s reported losses for prior years’ workers’ compensation claims were less than expected. After reevaluating expected remaining IBNR estimates, liabilities were reduced by $117 million. An increase of ten percent in the tail of the expected loss emergence pattern and an increase of ten percent in the expected loss ratios would produce a net increase of approximately $1 billion in General Re’s workers’ compensation IBNR liabilities, producing a corresponding decrease in pre-tax earnings. We believe it is reasonably possible for these assumptions to increase at these rates.
We reduced estimated ultimate losses for prior years’ events for other casualty losses, excluding asbestos, environmental, and other latent injury claims, by $132 million in 2018, reflecting lower than expected reported losses. For General Re’s significant casualty and general liability portfolios, we estimate that an increase of five percent in the claim-tails of the expected loss emergence patterns and a five percent increase in expected loss ratios would produce a net increase in our nominal IBNR liabilities and a corresponding reduction in pre-tax earnings of approximately $800 million. While we believe it is reasonably possible for these assumptions to increase at these rates, more likely outcomes are less than $800 million given the diversification in worldwide business.
K-57
Table of Contents
Management’s Discussion and Analysis (Continued)
Property and casualty losses (Continued)
Berkshire Hathaway Reinsurance Group (“BHRG”) (Continued)
Estimated ultimate liabilities for asbestos, environmental and other latent injury claims were increased approximately $145 million in 2018, which produced a corresponding reduction in pre-tax earnings. Net liabilities for such claims, excluding amounts assumed under retroactive reinsurance contracts, were approximately $1.7 billion at December 31, 2018. We may use industry-wide loss experience data and informed judgment when internal loss data is of limited reliability in making estimates for such losses. Loss estimations for these exposures are difficult to determine due to the changing legal environment, and increases may be required in the future if new exposures or claimants are identified, new claims are reported or new theories of liability emerge. In addition to the previously described methodologies, we consider “survival ratios,” which is the average net claim payments in recent years in relation to net unpaid losses, as a rough guide to reserve adequacy. Our survival ratio was approximately 16 years as of December 31, 2018.
Retroactive reinsurance
Our retroactive reinsurance contracts cover loss events occurring before the contract inception dates. Claim liabilities relating to our retroactive reinsurance contracts are predominately related to casualty or liability exposures. We expect the claim-tails to be very long. Our gross unpaid losses, deferred charge assets, and net liabilities at December 31, 2018 were as follows (in millions).
| Gross unpaid losses | Deferred charges | Liabilities, net of deferred charges |
||||||||||
| December 31, 2018 |
$ | 41,834 | $ | 14,104 | $ | 27,730 | ||||||
Our contracts are generally subject to maximum limits of indemnifications. We currently expect that maximum remaining gross losses payable under our retroactive policies will not exceed $55 billion due to the applicable aggregate contract limits. Absent significant judicial or legislative changes affecting asbestos, environmental or latent injury exposures, we also currently believe it unlikely that losses will develop upward to the maximum losses payable or downward by more than 15% of our $41.8 billion estimated liability at December 31, 2018.
We establish liability estimates by individual contract, considering exposure and development trends. In establishing our liability estimates, we often analyze historical aggregate loss payment patterns and project expected ultimate losses under various scenarios. We assign judgmental probability factors to these scenarios and an expected outcome is determined. We then monitor subsequent loss payment activity and review ceding company reports and other available information concerning the underlying losses. We re-estimate the expected ultimate losses when significant events or significant deviations from expected results are revealed.
Certain of our retroactive reinsurance contracts include asbestos, environmental and other latent injury claims. Our estimated liabilities for such claims were approximately $13.1 billion at December 31, 2018. We do not consistently receive reliable detailed data regarding asbestos, environmental and latent injury claims from all ceding companies, particularly with respect to multi-line or aggregate excess-of-loss policies. When possible, we conduct a detailed analysis of the underlying loss data to make an estimate of ultimate reinsured losses. When detailed loss information is unavailable, we develop estimates by applying recent industry trends and projections to aggregate client data. Judgments in these areas necessarily consider the stability of the legal and regulatory environment under which we expect these claims will be adjudicated. Legal reform and legislation could also have a significant impact on our ultimate liabilities.
We reduced estimated ultimate liabilities for prior years’ retroactive reinsurance contracts by $341 million in 2018, which after the changes in related deferred charge assets, resulted in pre-tax earnings of $185 million. In 2018, we paid losses and loss adjustment expenses of approximately $1.4 billion with respect to these contracts.
In connection with our retroactive reinsurance contracts, we also record deferred charge assets, which at contract inception represents the excess, if any, of the estimated ultimate liability for unpaid losses over premiums. We amortize deferred charge assets, which produces charges to pre-tax earnings in future periods based on the expected timing and amount of loss payments. We also adjust deferred charge balances due to changes in the expected timing and ultimate amount of claim payments. Significant changes in such estimates may have a significant effect on unamortized deferred charge balances and the amount of periodic amortization. Based on the contracts in effect as of December 31, 2018, we currently estimate that amortization expense in 2019 will approximate $1.2 billion.
K-58
Table of Contents
Management’s Discussion and Analysis (Continued)
Other Critical Accounting Policies
Our Consolidated Balance Sheet at December 31, 2018 included goodwill of acquired businesses of $81.0 billion. We evaluate goodwill for impairment at least annually and we conducted our most recent annual review during the fourth quarter of 2018. Our review includes determining the estimated fair values of our reporting units. There are several methods of estimating a reporting unit’s fair value, including market quotations, underlying asset and liability fair value determinations and other valuation techniques, such as discounted projected future net earnings or net cash flows and multiples of earnings. We primarily use discounted projected future earnings or cash flow methods. The key assumptions and inputs used in such methods may include forecasting revenues and expenses, operating cash flows and capital expenditures, as well as an appropriate discount rate and other inputs. A significant amount of judgment is required in estimating the fair value of a reporting unit and in performing goodwill impairment tests. Due to the inherent uncertainty in forecasting cash flows and earnings, actual results may vary significantly from the forecasts. If the carrying amount of a reporting unit, including goodwill, exceeds the estimated fair value, then, as required by GAAP, we estimate the fair values of the identifiable assets and liabilities of the reporting unit. The excess of the estimated fair value of the reporting unit over the estimated fair value of its net assets establishes the implied value of goodwill. The excess of the recorded amount of goodwill over the implied goodwill value is charged to earnings as an impairment loss.
Market Risk Disclosures
Our Consolidated Balance Sheets include substantial amounts of assets and liabilities whose fair values are subject to market risks. Our significant market risks are primarily associated with equity prices, interest rates, foreign currency exchange rates and commodity prices. The fair values of our investment portfolios and equity index put option contracts remain subject to considerable volatility. The following sections address the significant market risks associated with our business activities.
Equity Price Risk
Equity securities represent a significant portion of our investment portfolio. Strategically, we strive to invest in businesses that possess excellent economics and able and honest management, and we prefer to invest a meaningful amount in each investee. Consequently, equity investments are concentrated in relatively few issuers. At December 31, 2018, approximately 68% of the total fair value of equity securities was concentrated in five issuers.
We often hold our equity investments for long periods and short-term price volatility has occurred in the past and will occur in the future. We also strive to maintain significant levels of shareholder capital and ample liquidity to provide a margin of safety against short-term price volatility.
We are also subject to equity price risk with respect to our equity index put option contracts. While our ultimate liability with respect to these contracts is determined from the movement of the underlying stock index between the contract inception date and expiration date, fair values of these contracts are also affected by changes in other factors such as interest rates, expected dividend rates and the remaining duration of the contracts.
The following table summarizes our equity securities and derivative contract liabilities with significant equity price risk as of December 31, 2018 and 2017 and the estimated effects of a hypothetical 30% increase and a 30% decrease in market prices as of those dates. The selected 30% hypothetical increase and decrease does not reflect the best or worst case scenario. Indeed, results from declines could be far worse due both to the nature of equity markets and the aforementioned concentrations existing in our equity investment portfolio. Dollar amounts are in millions.
| Fair Value | Hypothetical Price Change |
Estimated Fair Value after Hypothetical Change in Prices |
Hypothetical Percentage Increase (Decrease) in Shareholders’ Equity (1) |
|||||||||||||
| December 31, 2018 |
||||||||||||||||
| Investments in equity securities |
$ | 172,757 | 30% increase | $ | 224,584 | 11.7% | ||||||||||
| 30% decrease | 120,930 | (11.7) | ||||||||||||||
| Equity index put option contract liabilities |
2,452 | 30% increase | 1,131 | 0.3 | ||||||||||||
| 30% decrease | 5,362 | (0.7) | ||||||||||||||
| December 31, 2017 |
||||||||||||||||
| Investments in equity securities |
$ | 170,540 | 30% increase | $ | 221,702 | 11.6% | ||||||||||
| 30% decrease | 119,378 | (11.6) | ||||||||||||||
| Equity index put option contract liabilities |
2,172 | 30% increase | 1,036 | 0.3 | ||||||||||||
| 30% decrease | 4,804 | (0.6) | ||||||||||||||
| (1) | The hypothetical percentage increase (decrease) is after income taxes at the statutory rate in effect as of the balance sheet date. |
K-59
Table of Contents
Management’s Discussion and Analysis (Continued)
Interest Rate Risk
We may also invest in bonds, loans or other interest rate sensitive instruments. Our strategy is to acquire or originate such instruments at prices considered appropriate relative to the perceived credit risk. We also issue debt in the ordinary course of business to fund business operations, business acquisitions and for other general purposes. We attempt to maintain high credit ratings, in order to minimize the cost of our debt. We infrequently utilize derivative products, such as interest rate swaps, to manage interest rate risks.
The fair values of our fixed maturity investments, loans and finance receivables, and notes payable and other borrowings will fluctuate in response to changes in market interest rates. In addition, changes in interest rate assumptions used in our equity index put option contract models cause changes in reported liabilities with respect to those contracts. Increases and decreases in interest rates generally translate into decreases and increases in fair values of these instruments. Additionally, fair values of interest rate sensitive instruments may be affected by the creditworthiness of the issuer, prepayment options, relative values of alternative investments, the liquidity of the instrument and other general market conditions.
The following table summarizes the estimated effects of hypothetical changes in interest rates on our significant assets and liabilities that are subject to significant interest rate risk at December 31, 2018 and 2017. We assumed that the interest rate changes occur immediately and uniformly to each category of instrument and that there were no significant changes to other factors used to determine the value of the instrument. The hypothetical changes in interest rates do not reflect the best or worst case scenarios. Actual results may differ from those reflected in the table. Dollars are in millions.
| Estimated Fair Value after Hypothetical Change in Interest Rates |
||||||||||||||||||||
| (bp=basis points) | ||||||||||||||||||||
| Fair Value | 100 bp decrease |
100 bp increase |
200 bp increase |
300 bp increase |
||||||||||||||||
| December 31, 2018 |
||||||||||||||||||||
| Assets: |
||||||||||||||||||||
| Investments in fixed maturity securities |
$ | 19,898 | $ | 20,260 | $ | 19,549 | $ | 19,214 | $ | 18,891 | ||||||||||
| Loans and finance receivables |
16,377 | 17,006 | 15,844 | 15,318 | 14,823 | |||||||||||||||
| Liabilities: |
||||||||||||||||||||
| Notes payable and other borrowings: |
||||||||||||||||||||
| Insurance and other |
35,361 | 37,559 | 33,380 | 31,691 | 30,208 | |||||||||||||||
| Railroad, utilities and energy |
66,422 | 73,063 | 60,840 | 56,107 | 52,063 | |||||||||||||||
| Equity index put option contracts |
2,452 | 2,669 | 2,249 | 2,057 | 1,877 | |||||||||||||||
| December 31, 2017 |
||||||||||||||||||||
| Assets: |
||||||||||||||||||||
| Investments in fixed maturity securities |
$ | 21,353 | $ | 22,053 | $ | 20,742 | $ | 20,200 | $ | 19,717 | ||||||||||
| Loans and finance receivables |
14,136 | 14,655 | 13,652 | 13,199 | 12,774 | |||||||||||||||
| Liabilities: |
||||||||||||||||||||
| Notes payable and other borrowings: |
||||||||||||||||||||
| Insurance and other |
41,762 | 43,937 | 39,844 | 38,140 | 36,619 | |||||||||||||||
| Railroad, utilities and energy |
70,538 | 77,091 | 64,582 | 59,730 | 55,581 | |||||||||||||||
| Equity index put option contracts |
2,172 | 2,460 | 1,911 | 1,676 | 1,465 | |||||||||||||||
K-60
Table of Contents
Management’s Discussion and Analysis (Continued)
Foreign Currency Risk
Certain of our subsidiaries operate in foreign jurisdictions and we transact business in foreign currencies. In addition, we hold investments in common stocks of major multinational companies, such as The Coca-Cola Company, who have significant foreign business and foreign currency risk of their own. We generally do not attempt to match assets and liabilities by currency and do not use derivative contracts to hedge or manage foreign currency price changes in any meaningful way.
Our net assets subject to financial statement translation into U.S. Dollars are primarily in our insurance, utilities and energy and certain manufacturing and services subsidiaries. This translation related impact may be offset by gains or losses included in net earnings related to net liabilities of Berkshire and certain of its U.S. subsidiaries that are denominated in foreign currencies, due to changes in exchange rates. A summary of these gains (losses), after-tax, for each of the years ending December 31, 2018 and 2017 follows (in millions).
| 2018 | 2017 | |||||||
| Euro-denominated debt included in net earnings |
$ | 289 | $ | (655) | ||||
| Net liabilities under certain reinsurance contracts included in net earnings |
207 | (295) | ||||||
| Foreign currency translation included in other comprehensive income |
(1,424) | 2,151 | ||||||
Commodity Price Risk
Our subsidiaries use commodities in various ways in manufacturing and providing services. As such, we are subject to price risks related to various commodities. In most instances, we attempt to manage these risks through the pricing of our products and services to customers. To the extent that we are unable to sustain price increases in response to commodity price increases, our operating results will likely be adversely affected. We may utilize derivative contracts to manage a portion of commodity price risks at BHE.
Item 7A. Quantitative and Qualitative Disclosures About Market Risk
See “Market Risk Disclosures” contained in Item 7 “Management’s Discussion and Analysis of Financial Condition and Results of Operations.”
Management’s Report on Internal Control Over Financial Reporting
Management of Berkshire Hathaway Inc. is responsible for establishing and maintaining adequate internal control over financial reporting, as such term is defined in the Securities Exchange Act of 1934 Rule 13a-15(f). Under the supervision and with the participation of our management, including our principal executive officer and principal financial officer, we conducted an evaluation of the effectiveness of the Company’s internal control over financial reporting as of December 31, 2018 as required by the Securities Exchange Act of 1934 Rule 13a-15(c). In making this assessment, we used the criteria set forth in the framework in Internal Control—Integrated Framework (2013) issued by the Committee of Sponsoring Organizations of the Treadway Commission. Based on our evaluation under the framework in Internal Control—Integrated Framework (2013), our management concluded that our internal control over financial reporting was effective as of December 31, 2018.
The effectiveness of our internal control over financial reporting as of December 31, 2018 has been audited by Deloitte & Touche LLP, an independent registered public accounting firm, as stated in their report which appears on page K-62.
Berkshire Hathaway Inc.
February 23, 2019
K-61
Table of Contents
| Item 8. | Financial Statements and Supplementary Data |
REPORT OF INDEPENDENT REGISTERED PUBLIC ACCOUNTING FIRM
To the Shareholders and the Board of Directors of
Berkshire Hathaway Inc.
Omaha, Nebraska
Opinions on the Financial Statements and Internal Control over Financial Reporting
We have audited the accompanying consolidated balance sheets of Berkshire Hathaway Inc. and subsidiaries (the “Company”) as of December 31, 2018 and 2017, the related consolidated statements of earnings, comprehensive income, changes in shareholders’ equity, and cash flows, for each of the three years in the period ended December 31, 2018, and the related notes (collectively referred to as the “financial statements”). We also have audited the Company’s internal control over financial reporting as of December 31, 2018, based on criteria established in Internal Control — Integrated Framework (2013) issued by the Committee of Sponsoring Organizations of the Treadway Commission (COSO).
In our opinion, the financial statements referred to above present fairly, in all material respects, the financial position of the Company as of December 31, 2018 and 2017, and the results of its operations and its cash flows for each of the three years in the period ended December 31, 2018, in conformity with accounting principles generally accepted in the United States of America. Also, in our opinion, the Company maintained, in all material respects, effective internal control over financial reporting as of December 31, 2018, based on criteria established in Internal Control — Integrated Framework (2013) issued by COSO.
Change in Accounting Principle
As discussed in Note 1 to the financial statements, the Company has changed its method of accounting for investments in equity securities (excluding equity method investments) in 2018 due to the adoption of ASU 2016-01 “Financial Instruments – Recognition and Measurement of Financial Assets and Financial Liabilities.”
Basis for Opinions
The Company’s management is responsible for these financial statements, for maintaining effective internal control over financial reporting, and for its assessment of the effectiveness of internal control over financial reporting, included in the accompanying Management’s Report on Internal Control Over Financial Reporting. Our responsibility is to express an opinion on these financial statements and an opinion on the Company’s internal control over financial reporting based on our audits. We are a public accounting firm registered with the Public Company Accounting Oversight Board (United States) (PCAOB) and are required to be independent with respect to the Company in accordance with the U.S. federal securities laws and the applicable rules and regulations of the Securities and Exchange Commission and the PCAOB.
We conducted our audits in accordance with the standards of the PCAOB. Those standards require that we plan and perform the audits to obtain reasonable assurance about whether the financial statements are free of material misstatement, whether due to error or fraud, and whether effective internal control over financial reporting was maintained in all material respects.
Our audits of the financial statements included performing procedures to assess the risks of material misstatement of the financial statements, whether due to error or fraud, and performing procedures to respond to those risks. Such procedures included examining, on a test basis, evidence regarding the amounts and disclosures in the financial statements. Our audits also included evaluating the accounting principles used and significant estimates made by management, as well as evaluating the overall presentation of the financial statements. Our audit of internal control over financial reporting included obtaining an understanding of internal control over financial reporting, assessing the risk that a material weakness exists, and testing and evaluating the design and operating effectiveness of internal control based on the assessed risk. Our audits also included performing such other procedures as we considered necessary in the circumstances. We believe that our audits provide a reasonable basis for our opinions.
K-62
Table of Contents
REPORT OF INDEPENDENT REGISTERED PUBLIC ACCOUNTING FIRM (Continued)
Definition and Limitations of Internal Control over Financial Reporting
A company’s internal control over financial reporting is a process designed to provide reasonable assurance regarding the reliability of financial reporting and the preparation of financial statements for external purposes in accordance with generally accepted accounting principles. A company’s internal control over financial reporting includes those policies and procedures that (1) pertain to the maintenance of records that, in reasonable detail, accurately and fairly reflect the transactions and dispositions of the assets of the company; (2) provide reasonable assurance that transactions are recorded as necessary to permit preparation of financial statements in accordance with generally accepted accounting principles, and that receipts and expenditures of the company are being made only in accordance with authorizations of management and directors of the company; and (3) provide reasonable assurance regarding prevention or timely detection of unauthorized acquisition, use, or disposition of the company’s assets that could have a material effect on the financial statements.
Because of its inherent limitations, internal control over financial reporting may not prevent or detect misstatements. Also, projections of any evaluation of effectiveness to future periods are subject to the risk that controls may become inadequate because of changes in conditions, or that the degree of compliance with the policies or procedures may deteriorate.
/s/ Deloitte & Touche LLP
Omaha, Nebraska
February 23, 2019
We have served as the Company’s auditor since 1985.
K-63
Table of Contents
BERKSHIRE HATHAWAY INC.
and Subsidiaries
CONSOLIDATED BALANCE SHEETS
(dollars in millions)
| December 31, | ||||||||
| 2018 | 2017 | |||||||
| ASSETS |
||||||||
| Insurance and Other: |
||||||||
| Cash and cash equivalents* |
$ | 27,749 | $ | 28,673 | ||||
| Short-term investments in U.S. Treasury Bills |
81,506 | 84,371 | ||||||
| Investments in fixed maturity securities |
19,898 | 21,353 | ||||||
| Investments in equity securities |
172,757 | 170,540 | ||||||
| Equity method investments |
17,325 | 21,024 | ||||||
| Loans and finance receivables |
16,280 | 13,748 | ||||||
| Other receivables |
31,564 | 29,392 | ||||||
| Inventories |
19,069 | 17,366 | ||||||
| Property, plant and equipment |
20,628 | 19,868 | ||||||
| Equipment held for lease |
14,298 | 10,167 | ||||||
| Goodwill |
56,323 | 56,478 | ||||||
| Other intangible assets |
31,499 | 32,518 | ||||||
| Deferred charges under retroactive reinsurance contracts |
14,104 | 15,278 | ||||||
| Other |
9,307 | 9,391 | ||||||
|
|
|
|
|
|||||
| 532,307 | 530,167 | |||||||
|
|
|
|
|
|||||
| Railroad, Utilities and Energy: |
||||||||
| Cash and cash equivalents* |
2,612 | 2,910 | ||||||
| Receivables |
3,666 | 3,531 | ||||||
| Property, plant and equipment |
131,780 | 128,184 | ||||||
| Goodwill |
24,702 | 24,780 | ||||||
| Regulatory assets |
3,067 | 2,950 | ||||||
| Other |
9,660 | 9,573 | ||||||
|
|
|
|
|
|||||
| 175,487 | 171,928 | |||||||
|
|
|
|
|
|||||
| $ | 707,794 | $ | 702,095 | |||||
|
|
|
|
|
|||||
| * | Cash and cash equivalents includes U.S. Treasury Bills with maturities of three months or less when purchased of $3.9 billion at December 31, 2018 and $5.7 billion at December 31, 2017. |
See accompanying Notes to Consolidated Financial Statements
K-64
Table of Contents
BERKSHIRE HATHAWAY INC.
and Subsidiaries
CONSOLIDATED BALANCE SHEETS
(dollars in millions)
| December 31, | ||||||||
| 2018 | 2017 | |||||||
| LIABILITIES AND SHAREHOLDERS’ EQUITY |
||||||||
| Insurance and Other: |
||||||||
| Unpaid losses and loss adjustment expenses |
$ | 68,458 | $ | 61,122 | ||||
| Unpaid losses and loss adjustment expenses under retroactive reinsurance contracts |
41,834 | 42,937 | ||||||
| Unearned premiums |
18,093 | 16,040 | ||||||
| Life, annuity and health insurance benefits |
18,632 | 17,608 | ||||||
| Other policyholder liabilities |
7,675 | 7,654 | ||||||
| Accounts payable, accruals and other liabilities |
25,776 | 24,569 | ||||||
| Derivative contract liabilities |
2,452 | 2,172 | ||||||
| Aircraft repurchase liabilities and unearned lease revenues |
4,593 | — | ||||||
| Notes payable and other borrowings |
34,975 | 40,409 | ||||||
|
|
|
|
|
|||||
| 222,488 | 212,511 | |||||||
|
|
|
|
|
|||||
| Railroad, Utilities and Energy: |
||||||||
| Accounts payable, accruals and other liabilities |
11,410 | 11,334 | ||||||
| Regulatory liabilities |
7,506 | 7,511 | ||||||
| Notes payable and other borrowings |
62,515 | 62,178 | ||||||
|
|
|
|
|
|||||
| 81,431 | 81,023 | |||||||
|
|
|
|
|
|||||
| Income taxes, principally deferred |
51,375 | 56,607 | ||||||
|
|
|
|
|
|||||
| Total liabilities |
355,294 | 350,141 | ||||||
|
|
|
|
|
|||||
| Shareholders’ equity: |
||||||||
| Common stock |
8 | 8 | ||||||
| Capital in excess of par value |
35,707 | 35,694 | ||||||
| Accumulated other comprehensive income |
(5,015 | ) | 58,571 | |||||
| Retained earnings |
321,112 | 255,786 | ||||||
| Treasury stock, at cost |
(3,109 | ) | (1,763 | ) | ||||
|
|
|
|
|
|||||
| Berkshire Hathaway shareholders’ equity |
348,703 | 348,296 | ||||||
| Noncontrolling interests |
3,797 | 3,658 | ||||||
|
|
|
|
|
|||||
| Total shareholders’ equity |
352,500 | 351,954 | ||||||
|
|
|
|
|
|||||
| $ | 707,794 | $ | 702,095 | |||||
|
|
|
|
|
|||||
See accompanying Notes to Consolidated Financial Statements
K-65
Table of Contents
BERKSHIRE HATHAWAY INC.
and Subsidiaries
CONSOLIDATED STATEMENTS OF EARNINGS
(dollars in millions except per share amounts)
| Year Ended December 31, | ||||||||||||
| 2018 | 2017 | 2016 | ||||||||||
| Revenues: |
||||||||||||
| Insurance and Other: |
||||||||||||
| Insurance premiums earned |
$ | 57,418 | $ | 60,597 | $ | 45,881 | ||||||
| Sales and service revenues |
133,336 | 130,343 | 123,053 | |||||||||
| Leasing revenues |
5,732 | 2,452 | 2,553 | |||||||||
| Interest, dividend and other investment income |
7,678 | 6,536 | 6,180 | |||||||||
|
|
|
|
|
|
|
|||||||
| 204,164 | 199,928 | 177,667 | ||||||||||
|
|
|
|
|
|
|
|||||||
| Railroad, Utilities and Energy: |
||||||||||||
| Freight rail transportation revenues |
23,703 | 21,080 | 19,683 | |||||||||
| Energy operating revenues |
15,555 | 15,155 | 14,621 | |||||||||
| Service revenues and other income |
4,415 | 3,770 | 3,143 | |||||||||
|
|
|
|
|
|
|
|||||||
| 43,673 | 40,005 | 37,447 | ||||||||||
|
|
|
|
|
|
|
|||||||
| Total revenues |
247,837 | 239,933 | 215,114 | |||||||||
|
|
|
|
|
|
|
|||||||
| Investment and derivative contract gains (losses): |
||||||||||||
| Investment gains (losses) |
(22,155) | 1,410 | 7,553 | |||||||||
| Derivative contract gains (losses) |
(300) | 718 | 751 | |||||||||
|
|
|
|
|
|
|
|||||||
| (22,455) | 2,128 | 8,304 | ||||||||||
|
|
|
|
|
|
|
|||||||
| Costs and expenses: |
||||||||||||
| Insurance and Other: |
||||||||||||
| Insurance losses and loss adjustment expenses |
39,906 | 48,891 | 30,906 | |||||||||
| Life, annuity and health insurance benefits |
5,699 | 5,618 | 5,131 | |||||||||
| Insurance underwriting expenses |
9,793 | 9,321 | 7,713 | |||||||||
| Cost of sales and services |
106,083 | 104,343 | 97,867 | |||||||||
| Cost of leasing |
4,061 | 1,455 | 1,335 | |||||||||
| Selling, general and administrative expenses |
18,238 | 19,189 | 17,973 | |||||||||
| Interest expense |
1,035 | 1,132 | 1,099 | |||||||||
|
|
|
|
|
|
|
|||||||
| 184,815 | 189,949 | 162,024 | ||||||||||
|
|
|
|
|
|
|
|||||||
| Railroad, Utilities and Energy: |
||||||||||||
| Freight rail transportation expenses |
16,045 | 14,031 | 13,134 | |||||||||
| Utilities and energy cost of sales and other expenses |
11,641 | 10,772 | 10,471 | |||||||||
| Other expenses |
3,895 | 3,231 | 2,589 | |||||||||
| Interest expense |
2,818 | 3,254 | 2,642 | |||||||||
|
|
|
|
|
|
|
|||||||
| 34,399 | 31,288 | 28,836 | ||||||||||
|
|
|
|
|
|
|
|||||||
| Total costs and expenses |
219,214 | 221,237 | 190,860 | |||||||||
|
|
|
|
|
|
|
|||||||
| Earnings before income taxes and equity method earnings (losses) |
6,168 | 20,824 | 32,558 | |||||||||
| Equity method earnings (losses) |
(2,167) | 3,014 | 1,109 | |||||||||
|
|
|
|
|
|
|
|||||||
| Earnings before income taxes |
4,001 | 23,838 | 33,667 | |||||||||
| Income tax expense (benefit) |
(321) | (21,515) | 9,240 | |||||||||
|
|
|
|
|
|
|
|||||||
| Net earnings |
4,322 | 45,353 | 24,427 | |||||||||
| Earnings attributable to noncontrolling interests |
301 | 413 | 353 | |||||||||
|
|
|
|
|
|
|
|||||||
| Net earnings attributable to Berkshire Hathaway shareholders |
$ | 4,021 | $ | 44,940 | $ | 24,074 | ||||||
|
|
|
|
|
|
|
|||||||
| Net earnings per average equivalent Class A share |
$ | 2,446 | $ | 27,326 | $ | 14,645 | ||||||
| Net earnings per average equivalent Class B share* |
$ | 1.63 | $ | 18.22 | $ | 9.76 | ||||||
| Average equivalent Class A shares outstanding |
1,643,795 | 1,644,615 | 1,643,826 | |||||||||
| Average equivalent Class B shares outstanding |
2,465,692,368 | 2,466,923,163 | 2,465,739,654 | |||||||||
| * | Class B shares are economically equivalent to one-fifteen-hundredth of a Class A share. Accordingly, net earnings per average equivalent Class B share outstanding is equal to one-fifteen-hundredth of the equivalent Class A amount. See Note 21. |
See accompanying Notes to Consolidated Financial Statements
K-66
Table of Contents
BERKSHIRE HATHAWAY INC.
and Subsidiaries
CONSOLIDATED STATEMENTS OF COMPREHENSIVE INCOME
(dollars in millions)
| Year Ended December 31, | ||||||||||||
| 2018 | 2017 | 2016 | ||||||||||
| Net earnings |
$ | 4,322 | $ | 45,353 | $ | 24,427 | ||||||
|
|
|
|
|
|
|
|||||||
| Other comprehensive income: |
||||||||||||
| Net change in unrealized appreciation of investments |
(185 | ) | 30,450 | 13,858 | ||||||||
| Applicable income taxes |
31 | (10,566 | ) | (4,846 | ) | |||||||
| Reclassification of investment appreciation in net earnings |
(253 | ) | (1,399 | ) | (6,820 | ) | ||||||
| Applicable income taxes |
53 | 490 | 2,387 | |||||||||
| Foreign currency translation |
(1,531 | ) | 2,364 | (1,541 | ) | |||||||
| Applicable income taxes |
62 | (95 | ) | 66 | ||||||||
| Prior service cost and actuarial gains/losses of defined benefit pension plans |
(571 | ) | 225 | 354 | ||||||||
| Applicable income taxes |
143 | (45 | ) | (187 | ) | |||||||
| Other, net |
(12 | ) | (9 | ) | (17 | ) | ||||||
|
|
|
|
|
|
|
|||||||
| Other comprehensive income, net |
(2,263 | ) | 21,415 | 3,254 | ||||||||
|
|
|
|
|
|
|
|||||||
| Comprehensive income |
2,059 | 66,768 | 27,681 | |||||||||
| Comprehensive income attributable to noncontrolling interests |
249 | 555 | 291 | |||||||||
|
|
|
|
|
|
|
|||||||
| Comprehensive income attributable to Berkshire Hathaway shareholders |
$ | 1,810 | $ | 66,213 | $ | 27,390 | ||||||
|
|
|
|
|
|
|
|||||||
BERKSHIRE HATHAWAY INC.
and Subsidiaries
CONSOLIDATED STATEMENTS OF CHANGES IN SHAREHOLDERS’ EQUITY
(dollars in millions)
| Berkshire Hathaway shareholders’ equity | Total | |||||||||||||||||||||||
| Common stock and capital in excess of par value |
Accumulated other comprehensive income |
Retained earnings |
Treasury stock |
Non- controlling interests |
||||||||||||||||||||
| Balance December 31, 2015 |
$ | 35,628 | $ | 33,982 | $ | 186,772 | $ | (1,763) | $ | 3,077 | $ | 257,696 | ||||||||||||
| Net earnings |
— | — | 24,074 | — | 353 | 24,427 | ||||||||||||||||||
| Other comprehensive income, net |
— | 3,316 | — | — | (62) | 3,254 | ||||||||||||||||||
| Issuance of common stock |
119 | — | — | — | — | 119 | ||||||||||||||||||
| Transactions with noncontrolling interests |
(58 | ) | — | — | — | (10) | (68) | |||||||||||||||||
|
|
|
|
|
|
|
|
|
|
|
|
|
|||||||||||||
| Balance December 31, 2016 |
35,689 | 37,298 | 210,846 | (1,763) | 3,358 | 285,428 | ||||||||||||||||||
| Net earnings |
— | — | 44,940 | — | 413 | 45,353 | ||||||||||||||||||
| Other comprehensive income, net |
— | 21,273 | — | — | 142 | 21,415 | ||||||||||||||||||
| Issuance of common stock |
76 | — | — | — | — | 76 | ||||||||||||||||||
| Transactions with noncontrolling interests |
(63 | ) | — | — | — | (255) | (318) | |||||||||||||||||
|
|
|
|
|
|
|
|
|
|
|
|
|
|||||||||||||
| Balance December 31, 2017 |
35,702 | 58,571 | 255,786 | (1,763) | 3,658 | 351,954 | ||||||||||||||||||
| Adoption of new accounting pronouncements |
— | (61,375) | 61,305 | — | — | (70) | ||||||||||||||||||
| Net earnings |
— | — | 4,021 | — | 301 | 4,322 | ||||||||||||||||||
| Other comprehensive income, net |
— | (2,211) | — | — | (52) | (2,263) | ||||||||||||||||||
| Issuance (acquisition) of common stock |
59 | — | — | (1,346) | — | (1,287) | ||||||||||||||||||
| Transactions with noncontrolling interests |
(46 | ) | — | — | — | (110) | (156) | |||||||||||||||||
|
|
|
|
|
|
|
|
|
|
|
|
|
|||||||||||||
| Balance December 31, 2018 |
$ | 35,715 | $ | (5,015) | $ | 321,112 | $ | (3,109) | $ | 3,797 | $ | 352,500 | ||||||||||||
|
|
|
|
|
|
|
|
|
|
|
|
|
|||||||||||||
See accompanying Notes to Consolidated Financial Statements
K-67
Table of Contents
BERKSHIRE HATHAWAY INC.
and Subsidiaries
CONSOLIDATED STATEMENTS OF CASH FLOWS
(dollars in millions)
| Year Ended December 31, | ||||||||||||
| 2018 | 2017 | 2016 | ||||||||||
| Cash flows from operating activities: |
||||||||||||
| Net earnings |
$ | 4,322 | $ | 45,353 | $ | 24,427 | ||||||
| Adjustments to reconcile net earnings to operating cash flows: |
||||||||||||
| Investment gains/losses |
22,155 | (1,410 | ) | (7,553) | ||||||||
| Depreciation and amortization |
9,779 | 9,188 | 8,901 | |||||||||
| Other |
2,957 | 458 | (161) | |||||||||
| Changes in operating assets and liabilities: |
||||||||||||
| Losses and loss adjustment expenses |
3,449 | 25,027 | 4,372 | |||||||||
| Deferred charges reinsurance assumed |
1,174 | (7,231 | ) | (360) | ||||||||
| Unearned premiums |
1,794 | 1,761 | 968 | |||||||||
| Receivables and originated loans |
(3,443 | ) | (1,990 | ) | (3,302) | |||||||
| Other assets |
(1,832 | ) | (1,665 | ) | (373) | |||||||
| Other liabilities |
2,002 | 1,194 | 1,684 | |||||||||
| Income taxes |
(4,957 | ) | (24,957 | ) | 4,044 | |||||||
|
|
|
|
|
|
|
|||||||
| Net cash flows from operating activities |
37,400 | 45,728 | 32,647 | |||||||||
|
|
|
|
|
|
|
|||||||
| Cash flows from investing activities: |
||||||||||||
| Purchases of U.S. Treasury Bills and fixed maturity securities |
(141,844 | ) | (158,492 | ) | (96,568) | |||||||