What Is Fear And Greed Index?
Fear and Greed index, or FGI, is a financial market-timing strategy introduced by Cable News Network (CNN) Money to understand how investor emotions influence investment decisions. The index is one of the most critical components in determining whether the market is bullish or bearish.
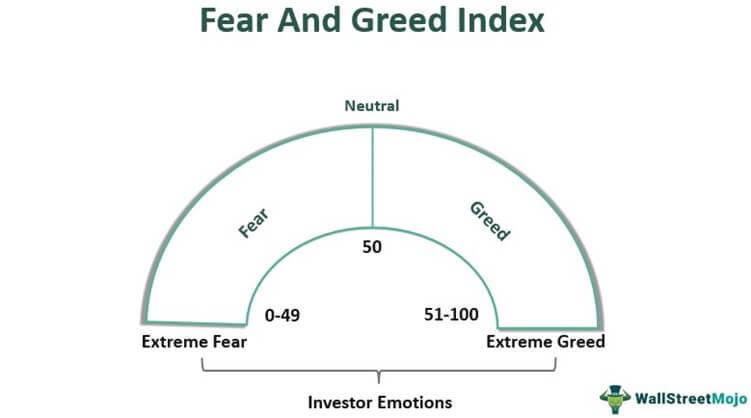
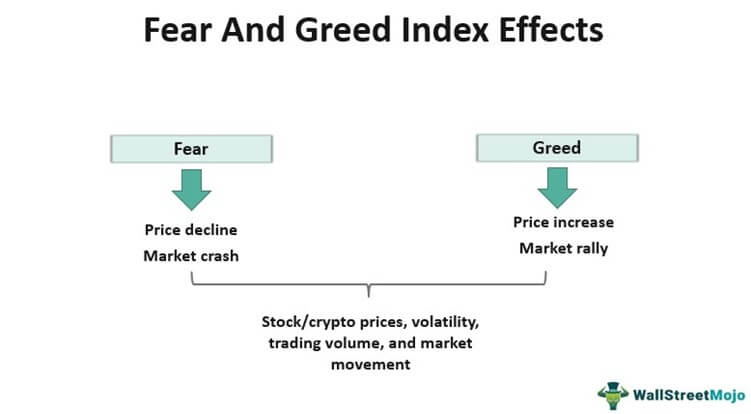
Fear and greed, the two primary emotions, have considerable effects on share prices, volatility, volume, and direction. The index calculates investor sentiment on a scale of 0 (extreme fear) to 100 (extreme greed) by tracking market price variations daily, weekly, monthly, and annually. Excessive fear tends to pull down stock values, whereas excessive greed has the reverse effect.
Table of contents
You are free to use this image on your website, templates, etc, Please provide us with an attribution linkHow to Provide Attribution?Article Link to be Hyperlinked
For eg:
Source: Fear And Greed Index (wallstreetmojo.com)
Key Takeaways
- The fear and greed index (FGI) is a timing strategy introduced by CNNMoney in financial markets, including stocks and cryptocurrencies, to understand how investor emotions affect investment decisions.
- The two human emotions, i.e., fear and greed, significantly affect stock prices, volatility, volume, and direction. While fear leads to price decreases, greed shows the opposite effect.
- It calculates investor sentiment on a scale of 0 (extreme fear) to 100 (extreme greed) and allows investors to make calculated investment decisions.
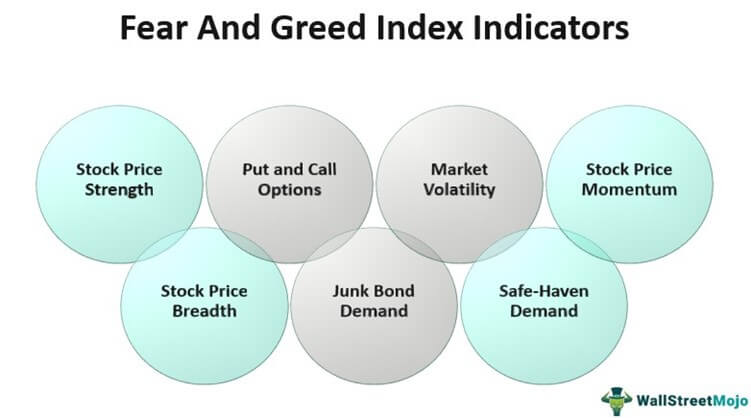
- Stock price momentum, stock price strength, stock price breadth, put and call ratio, market volatility, junk bond demand, and safe-haven demand are seven indicators that help calculate FGI.
How Does CNN Fear And Greed Index Work?
The CNN Fear and Greed Index lets speculatorsSpeculatorsA speculator is an individual or financial institution that places short-term bets on securities based on speculations. For example, rather than focusing on the long-term growth prospects of a particular company, they would take calculated risks on a stock with the potential of yielding a higher return.read more gauge the impact of investor sentiment on changes in equity marketsEquity MarketsAn equity market is a platform that enables the companies to issue their securities to the investors; it also facilitates the further exchange of these stocks between the buyers and sellers. It comprises various stock exchanges like New York Stock Exchange (NYSE).read more and stock prices. Investor emotions drive financial marketFinancial MarketThe term "financial market" refers to the marketplace where activities such as the creation and trading of various financial assets such as bonds, stocks, commodities, currencies, and derivatives take place. It provides a platform for sellers and buyers to interact and trade at a price determined by market forces.read more movements, including stocks and cryptocurrenciesCryptocurrenciesCryptocurrency refers to a technology that acts as a medium for facilitating the conduct of different financial transactions which are safe and secure. It is one of the tradable digital forms of money, allowing the person to send or receive the money from the other party without any help of the third party service.read more, and influence investment and trading decisions. While fear can result in stock market crashesStock Market CrashesA stock market crash occurs when stock prices in all sectors begin to fall rapidly. It is often the result of global factors such as war, scam, or the collapse of a certain industry. In such a crash, panic acts as a catalyst.read more, greed can lead to market rallies. Therefore, it is essential to track investor sentiments and develop a market-timing strategy before making investments.
You are free to use this image on your website, templates, etc, Please provide us with an attribution linkHow to Provide Attribution?Article Link to be Hyperlinked
For eg:
Source: Fear And Greed Index (wallstreetmojo.com)
Financial Modeling & Valuation Courses Bundle (25+ Hours Video Series)
–>> If you want to learn Financial Modeling & Valuation professionally , then do check this Financial Modeling & Valuation Course Bundle (25+ hours of video tutorials with step by step McDonald’s Financial Model). Unlock the art of financial modeling and valuation with a comprehensive course covering McDonald’s forecast methodologies, advanced valuation techniques, and financial statements.
The index looks at several indicators to determine how fearful or greedy investors are at a given moment. It calculates results on a 0-100 scale, with 0-49 showing fear and 51-100 showing greed. The pointer on 50 means a neutral sentiment to the market behavior. If investors are greedy enough, stock prices will rise, and more people will buy stocks (sell indicator). On the other hand, if investors are fearful, share prices will fall even below the intrinsic value, and more people will sell their stocks (buy indicator).
Some self-imposed restrictions should be in place to ensure that fear and greed situations do not affect investment decisions:
- Develop and follow a trading strategy
- Set an amount for trading daily, weekly, monthly, or annually
- Fix the number of trades and stick to it to avoid being hit by greed
- Avoid trading on the same script out of greed
- Have a positive attitude toward losses
- Control anxiety to avoid investing in a more drastic deal
You are free to use this image on your website, templates, etc, Please provide us with an attribution linkHow to Provide Attribution?Article Link to be Hyperlinked
For eg:
Source: Fear And Greed Index (wallstreetmojo.com)
The tool offers an insight into whether the stock market is undervalued or overvalued. Since the fear of missing out (FOMO) signals a buying opportunity and vice-versa, this index saves investors from making emotional decisions.
Video Explanation of the Fear And Greed Index
Calculate Fear And Greed Index
CNNMoney measures seven distinct indicators on a scale of 0 to 100 and averages them equally to calculate FGI. These include:
You are free to use this image on your website, templates, etc, Please provide us with an attribution linkHow to Provide Attribution?Article Link to be Hyperlinked
For eg:
Source: Fear And Greed Index (wallstreetmojo.com)
#1 – Stock Price Momentum
This indicator looks at the performance of the Standard & Poor’s 500 Index and then compares it to their 125-day moving averageMoving AverageMoving Average (MA), commonly used in capital markets, can be defined as a succession of mean that is derived from a successive period of numbers or values and the same would be calculated continually as the new data is available. This can be lagging or trend-following indicator as this would be based on previous numbers.read more. If stocks perform above average, the market represents a bullish scenario, letting investors expect better results and making them greedy.
#2 – Stock Price Strength
This indicator looks through the New York Stock Exchange. It compares the number of stocks in the market hitting 52-week all-time highs with those reaching 52-week all-time lows. If the price strength is positive, i.e., more companies reaching higher highs, it suggests a bullish marketBullish MarketA bull market occurs when many stock prices rise 20% from a recent low, with the price climb spanning for an extended period.read more, i.e., greedy investors and vice versa.
#3 – Stock Price Breadth
The third indicator measures volumes of stocks trading on the New York Stock Exchange. Whether the market is bullish or bearishBearishBearish market refers to an opinion where the stock market is likely to go down or correct shortly. It is predicted in consideration of events that are happening or are bound to happen which would drag down the prices of the stocks in the market.read more, this indicator emphasizes the proportion of the stock market participating. Rising stocks trading higher than declining stocks indicate a greedy scenario and vice versa.
#4 – Put and Call Options
The next indicator on the list calculates the 5-day average of the put and call options. Put is the market situation where the stock value tends to move downward, while a call is a situation when the stock prices are likely to go upward. It determines whether the number of investors expecting low stock value is more or vice-versa. If the put/call ratio is lower, it signals greed and vice versa.
#5 – Junk Bond Demand
This indicator assesses the higher-risk strategies by measuring the spread between yields on junk bonds and investment-grade bonds. The lower the gap, the more would be the greed. Investment-grade bonds are relatively safer, and hence, most investors opt for them (signals fear). On the contrary, increased investments in junk bonds are signs of a stable economy (signals greed).
#6 – Market Volatility
This indicator measures the Volatility IndexVolatility IndexVolatility Index, abbreviated as VIX, gives an indication of the expected volatility in the stock market and is based on S&P 500 index options based on 30 days forward period.read more (VIX) from the Chicago Board Options Exchange on a 50-day moving average. VIX estimates market volatility in the next 30 days. The higher the value, the more volatile the market would be. It, thus, indicates a bearish market and creates fear among investors and vice versa.
#7 – Safe-Haven Demand
This indicator computes the difference in returns for stocks versus Treasury bondsTreasury BondsA Treasury Bond (or T-bond) is a government debt security with a fixed rate of return and relatively low risk, as issued by the US government. You can buy treasury bonds directly from the US Treasury or through a bank, broker, or mutual fund company.read more based on the performances over the past 20 days. When stock prices move downward, investors rush towards purchasing bonds. This preference of bonds over stocks implies the weak stock market, signaling fear, and vice versa.
Examples
Let us consider the below-mentioned FGI examples to understand the concept better:
Example #1
Wilson studied the crypto fear and greed index recently to understand investor behavior. He observed that the market tends to be extremely greedy, with a score of 80 on the FGI scale. It could potentially lead to FOMO.
His financial advisor Lisa warned him not to invest in cryptos as digital currenciesDigital CurrenciesDigital currency is a currency found only in an electronic form as it is used for trading over the internet. They are famous for allowing transparent and secured digital payments. Although their popularity is constantly growing, their adoption as a reliable alternative to physical money is nowhere close. Some of the popular digital currencies are Ethereum, Bitcoin, and Litecoin.read more are prone to bear trapsBear TrapsA bear trap is a technical stock trading pattern reflecting a misleading reversal of an upward trend in the financial market.read more. Also, virtual coins often falsify the entire market scenario as fruitful for short positionsShort PositionsA short position is a practice where the investors sell stocks that they don't own at the time of selling; the investors do so by borrowing the shares from some other investors to promise that the former will return the stocks to the latter on a later date.read more. However, Wilson ignored Lisa’s advice and traded in cryptos only to incur a huge loss.
Example #2
Since the beginning of 2021, investors have been losing their investments in the U.S. stock market. The most significant of these was the loss of $ 11.5 trillion on February 19. Also, the top 20 wealthiest people in the world lost $293 billion in a month between mid-February and mid-March. It implies a fear-driven stock marketStock MarketStock Market works on the basic principle of matching supply and demand through an auction process where investors are willing to pay a certain amount for an asset, and they are willing to sell off something they have at a specific price.read more due to an increase in sell-offs.
The CBOE Volatility IndexCBOE Volatility IndexVXN, or the CBOE Nasdaq Volatility Index, predicts the future volatility of the market based on data of the Nasdaq-100 index. Essentially, it takes data from the Nasdaq-100 options to gauge the expected volatility of the upcoming 30 days.read more and the CNNMoney FGI also showed a high degree of fear among investors in the stock market. While there are many reasons behind FOMO or the bearish market, the COVID-19 outbreak and rising oil prices led to the turbulent stock market.
Uses
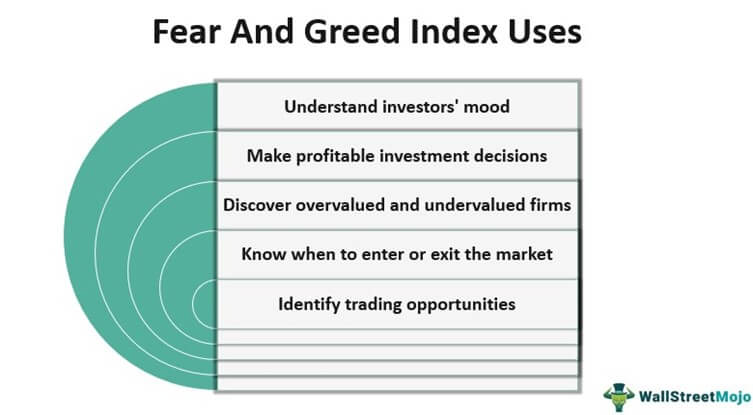
FGI can be useful for investors and traders in several ways, such as:
- Find out the mood of investors at any given time
- Make profitable investment decisions
- Know whether it is the right time to trade
- Identify the best time to enter or exit the market
- Discover firms that are undervalued or overvalued
Frequently Asked Questions (FAQs)
FGI is a tool that gauges the impact of investor sentiment, i.e., fear and greed, on changes in financial markets, including stocks and cryptocurrencies. Thus, it enables investors to develop an effective market-timing strategy. It also measures share prices and stock market movements daily, weekly, monthly, and annually.
FGI calculates results on a 0-100 scale, with 0 showing extreme fear and 100 showing extreme greed. If investors are greedy, it attracts more buyers and acts as a sell indicator. On the other hand, if investors are under fear, it forces more people to sell their stocks and signals a buy indicator.
Seven indicators that help calculate FGI in crypto trading and stock investments are – stock price momentum, stock price strength, stock price breadth, put and call ratio, market volatility, junk bond demand, and safe-haven demand.
Recommended Articles
This has been a guide to Fear and Greed Index and its definition. Here we discuss how CNN fear and greed index works along with its seven indicators and examples. You can learn more from the following articles –

Leave a Reply