
In this tutorial, I will talk about Prometheus and Grafana. You will learn to install both on CentOS/RHEL and understand how to use Prometheus and Grafana to monitor the Linux server.
Introduction
Grafana is a leading time-series, an open-source platform for visualization and monitoring. It allows you to query, visualize, set alerts, and understand metrics no matter where they are stored. You can create amazing dashboards in Grafana to visualize and monitor the metrics.

Prometheus is an open-source time-series monitoring system for machine-centric and highly dynamic service-oriented architectures. It can literally monitor everything. It integrates with Grafana very smoothly as Grafana also offers Prometheus as one of its data sources.
If you are a newbie, I would suggest checking out an introduction to Prometheus and Grafana article.
Let me show you how to install them on CentOS. You should have at least 2GB of RAM. You can get a cloud server from DigitalOcean to try out.
Installing Prometheus
Step 1: Download Prometheus
Download the latest Prometheus Linux package from the official page.
Check the official release page to obtain latest release.
[centos@geekflare ~]$ wget https://github.com/prometheus/prometheus/releases/download/v2.18.1/prometheus-2.18.1.linux-amd64.tar.gz
--2020-05-20 10:06:22--
https://github.com/prometheus/prometheus/releases/download/v2.18.1/prometheus-2.18.1.linux-amd64.tar.gz
Resolving github.com (github.com)... 13.234.176.102
Connecting to github.com (github.com)|13.234.176.102|:443... connected.
HTTP request sent, awaiting response... 302 Found
Location: https://github-production-release-asset-2e65be.s3.amazonaws.com/6838921/2f454700-90ae-11ea-89e1-3aeb351fdfa5?X-Amz-Algorithm=AWS4-HMAC-SHA256&X-Amz-Credential=AKIAIWNJYAX4CSVEH53A%2F20200520%2Fus-east-1%2Fs3%2Faws4_request&X-Amz-Date=20200520T140622Z&X-Amz-Expires=300&X-Amz-Signature=53d5c6a02e8eeee82f380c4d1edf62a7adfb2b38f2b173059852040b14ddb19c&X-Amz-SignedHeaders=host&actor_id=0&repo_id=6838921&response-content-disposition=attachment%3B%20filename%3Dprometheus-2.18.1.linux-amd64.tar.gz&response-content-type=application%2Foctet-stream [following]
--2020-05-20 10:06:22--
https://github-production-release-asset-2e65be.s3.amazonaws.com/6838921/2f454700-90ae-11ea-89e1-3aeb351fdfa5?X-Amz-Algorithm=AWS4-HMAC-SHA256&X-Amz-Credential=AKIAIWNJYAX4CSVEH53A%2F20200520%2Fus-east-1%2Fs3%2Faws4_request&X-Amz-Date=20200520T140622Z&X-Amz-Expires=300&X-Amz-Signature=53d5c6a02e8eeee82f380c4d1edf62a7adfb2b38f2b173059852040b14ddb19c&X-Amz-SignedHeaders=host&actor_id=0&repo_id=6838921&response-content-disposition=attachment%3B%20filename%3Dprometheus-2.18.1.linux-amd64.tar.gz&response-content-type=application%2Foctet-stream
Resolving github-production-release-asset-2e65be.s3.amazonaws.com (github-production-release-asset-2e65be.s3.amazonaws.com)... 52.216.24.236
Connecting to github-production-release-asset-2e65be.s3.amazonaws.com (github-production-release-asset-2e65be.s3.amazonaws.com)|52.216.24.236|:443... connected.
HTTP request sent, awaiting response... 200 OK
Length: 63373350 (60M) [application/octet-stream]
Saving to: ‘prometheus-2.18.1.linux-amd64.tar.gz’

100%[============================================================================================================>] 63,373,350 2.09MB/s in 50s

2020-05-20 10:07:13 (1.21 MB/s) - ‘prometheus-2.18.1.linux-amd64.tar.gz’ saved [63373350/63373350]
Extract the package which you downloaded.
[centos@geekflare ~]$ tar -xzf prometheus-2.18.1.linux-amd64.tar.gz
[centos@geekflare ~]$ ls
Desktop
Documents Downloads Music
Pictures
prometheus-2.18.1.linux-amd64
prometheus-2.18.1.linux-amd64.tar.gz
Public Templates Videos
Step 2: Configure Prometheus
Create a new user Prometheus using the below command.
[centos@geekflare ~]$ sudo useradd -s /sbin/false prometheusGive all the Prometheus file ownership to Prometheus user. Make all the files executable in the path mentioned.
[centos@geekflare ~]$ sudo chmod 755 prometheus-2.18.1.linux-amd64 -R
[centos@geekflare ~]$ sudo chown prometheus:prometheus prometheus-2.18.1.linux-amd64 -R
It is time to configure Prometheus as a service inside the systemd. Create a file prometheus.service and put the lines mentioned below in the file and save it.
[centos@geekflare ~]$ sudo gedit /etc/systemd/system/prometheus.service
[Unit]
Description=Prometheus Server
Wants=network-online.target
After=network-online.target

[Service]
User=prometheus
Group=prometheus
Type=simple
ExecStart= /home/centos/prometheus-2.18.1.linux-amd64/prometheus \
--config.file= /home/centos/prometheus-2.18.1.linux-amd64/prometheus.yml \
--storage.tsdb.path=/home/centos/prometheus-2.18.1.linux-amd64/ \
--web.console.templates= /home/centos/prometheus-2.18.1.linux-amd64/consoles \
--web.console.libraries= /home/centos/prometheus-2.18.1.linux-amd64/console_libraries

[Install]
WantedBy=multi-user.target
Step 3: Start Prometheus
Using systemctl, reload the systemd system, and start the Prometheus service. Its status should show the service is running if you have followed all the steps correctly.
[centos@geekflare prometheus]$ sudo systemctl daemon-reload
[centos@geekflare prometheus]$ sudo systemctl start prometheus.service
[centos@geekflare prometheus]$ sudo systemctl enable prometheus.service
[centos@geekflare prometheus]$ sudo systemctl status prometheus.service -l
● prometheus.service - Prometheus Server
Loaded: loaded (/etc/systemd/system/prometheus.service; enabled; vendor preset: disabled)
Active: active (running) since Wed 2020-05-20 14:18:47 EDT; 5s ago
Main PID: 23924 (prometheus)
CGroup: /system.slice/prometheus.service
└─23924 /home/centos/prometheus-2.18.1.linux-amd64/prometheus --config.file=/home/centos/prometheus-2.18.1.linux-amd64/prometheus.yml --storage.tsdb.path=/home/centos/prometheus-2.18.1.linux-amd64/ --web.console.templates=/home/centos/prometheus-2.18.1.linux-amd64/consoles --web.console.libraries=/home/centos/prometheus-2.18.1.linux-amd64/console_libraries

May 20 14:18:47 geekflare.linuxvmimages.com prometheus[23924]: level=info ts=2020-05-20T18:18:47.885Z caller=web.go:523 component=web msg="Start listening for connections" address=0.0.0.0:9090
May 20 14:18:47 geekflare.linuxvmimages.com prometheus[23924]: level=info ts=2020-05-20T18:18:47.888Z caller=head.go:624 component=tsdb msg="WAL segment loaded" segment=0 maxSegment=2
May 20 14:18:47 geekflare.linuxvmimages.com prometheus[23924]: level=info ts=2020-05-20T18:18:47.889Z caller=head.go:624 component=tsdb msg="WAL segment loaded" segment=1 maxSegment=2
May 20 14:18:47 geekflare.linuxvmimages.com prometheus[23924]: level=info ts=2020-05-20T18:18:47.889Z caller=head.go:624 component=tsdb msg="WAL segment loaded" segment=2 maxSegment=2
May 20 14:18:47 geekflare.linuxvmimages.com prometheus[23924]: level=info ts=2020-05-20T18:18:47.889Z caller=head.go:627 component=tsdb msg="WAL replay completed" duration=4.498147ms
May 20 14:18:47 geekflare.linuxvmimages.com prometheus[23924]: level=info ts=2020-05-20T18:18:47.909Z caller=main.go:694 fs_type=XFS_SUPER_MAGIC
May 20 14:18:47 geekflare.linuxvmimages.com prometheus[23924]: level=info ts=2020-05-20T18:18:47.909Z caller=main.go:695 msg="TSDB started"
May 20 14:18:47 geekflare.linuxvmimages.com prometheus[23924]: level=info ts=2020-05-20T18:18:47.909Z caller=main.go:799 msg="Loading configuration file" filename=/home/centos/prometheus-2.18.1.linux-amd64/prometheus.yml
May 20 14:18:47 geekflare.linuxvmimages.com prometheus[23924]: level=info ts=2020-05-20T18:18:47.936Z caller=main.go:827 msg="Completed loading of configuration file" filename=/home/centos/prometheus-2.18.1.linux-amd64/prometheus.yml
May 20 14:18:47 geekflare.linuxvmimages.com prometheus[23924]: level=info ts=2020-05-20T18:18:47.936Z caller=main.go:646 msg="Server is ready to receive web requests."
Step 4: Access Prometheus Web UI
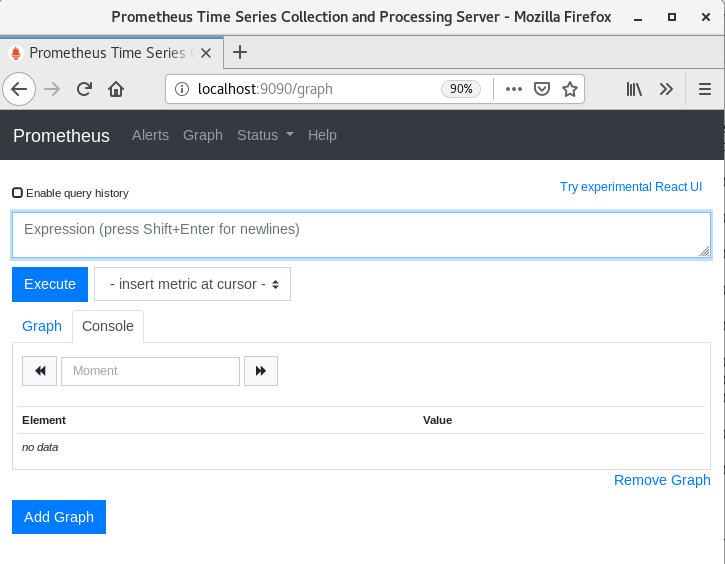
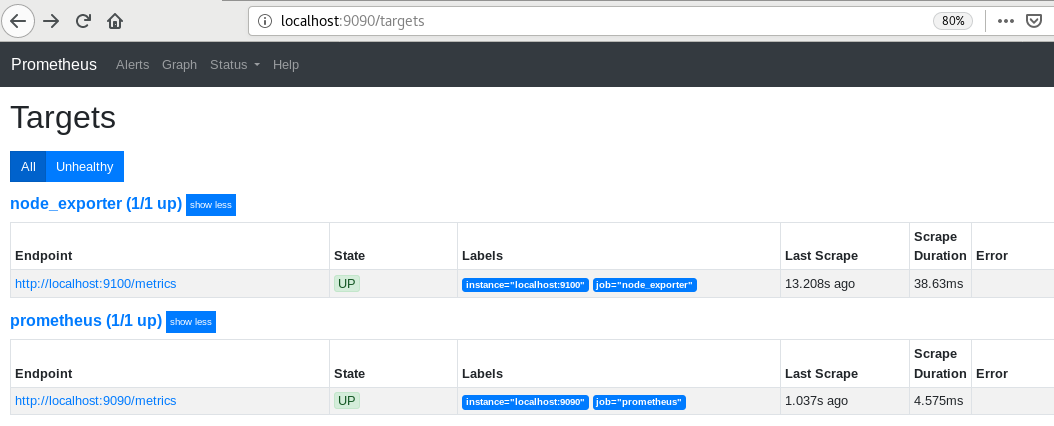
Open the browser and access to server’s IP with port 9090 to access the web interface of Prometheus.
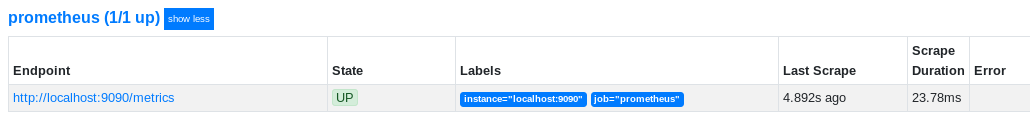
Go to Status>>Targets to see what all and where Prometheus is currently running.
Installing Grafana
Step 1: Add Grafana Repo
By default, the Grafana repository is not present in CentOS repositories, so you need to add it. Create a file grafana.repo inside /etc/yum.repos.d/ and add the lines mentioned below.
[centos@geekflare ~]$ sudo gedit /etc/yum.repos.d/grafana.repo

[grafana]
name=grafana
baseurl=https://packages.grafana.com/oss/rpm
repo_gpgcheck=1
enabled=1
gpgcheck=1
gpgkey=https://packages.grafana.com/gpg.key
sslverify=1
sslcacert=/etc/pki/tls/certs/ca-bundle.crt
Step 2: Install Grafana
Update CentOS and install the Grafana package.
[centos@geekflare ~]$ sudo yum update -y

[centos@geekflare ~]$ sudo yum install grafana
Loaded plugins: fastestmirror, langpacks
Loading mirror speeds from cached hostfile
* base: mirrors.piconets.webwerks.in
* extras: mirrors.piconets.webwerks.in
* updates: mirrors.piconets.webwerks.in
Resolving Dependencies
--> Running transaction check
---> Package grafana.x86_64 0:7.0.0-1 will be installed
--> Finished Dependency Resolution

Dependencies Resolved

======================================================================================================================================================
Package Arch Version Repository Size
======================================================================================================================================================
Installing:
grafana x86_64 7.0.0-1 grafana 46 M

Transaction Summary
======================================================================================================================================================
Install 1 Package

Total download size: 46 M
Installed size: 141 M
Is this ok [y/d/N]: y
Downloading packages:
No Presto metadata available for grafana
warning: /var/cache/yum/x86_64/7/grafana/packages/grafana-7.0.0-2.x86_64.rpm: Header V4 RSA/SHA512 Signature, key ID 24098cb6: NOKEY MB 00:00:00 ETA
Public key for grafana-7.0.0-2.x86_64.rpm is not installed
grafana-7.0.0-2.x86_64.rpm | 46 MB
00:00:07
Retrieving key from https://packages.grafana.com/gpg.key
Importing GPG key 0x24098CB6:
Userid : "Grafana <info@grafana.com>"
Fingerprint: 4e40 ddf6 d76e 284a 4a67 80e4 8c8c 34c5 2409 8cb6
From : https://packages.grafana.com/gpg.key
Is this ok [y/N]: y
Running transaction check
Running transaction test
Transaction test succeeded
Running transaction
Installing : grafana-7.0.0-1.x86_64 1/1
### NOT starting on installation, please execute the following statements to configure grafana to start automatically using systemd
sudo /bin/systemctl daemon-reload
sudo /bin/systemctl enable grafana-server.service
### You can start grafana-server by executing
sudo /bin/systemctl start grafana-server.service
POSTTRANS: Running script
Verifying : grafana-7.0.0-1.x86_64
1/1

Installed:
grafana.x86_64 0:7.0.0-1

Complete!
Step 3: Start Grafana
Start grafana server and check the status if its running or not.
[centos@geekflare ~]$ sudo systemctl start grafana-server
[centos@geekflare ~]$ sudo systemctl status grafana-server
● grafana-server.service - Grafana instance
Loaded: loaded (/usr/lib/systemd/system/grafana-server.service; disabled; vendor preset: disabled)
Active: active (running) since Wed 2020-05-20 07:04:32 EDT; 6s ago
Docs: http://docs.grafana.org
Main PID: 7672 (grafana-server)
Tasks: 9
CGroup: /system.slice/grafana-server.service
└─7672 /usr/sbin/grafana-server --config=/etc/grafana/grafana.ini --pidfile=/var/run/grafana/grafana-server.pid --packaging=rpm cfg:defa...

May 20 07:04:32 geekflare.linuxvmimages.com grafana-server[7672]: t=2020-05-20T07:04:32-0400 lvl=info msg="Executing migration" logger=migrator...token"
May 20 07:04:32 geekflare.linuxvmimages.com grafana-server[7672]: t=2020-05-20T07:04:32-0400 lvl=info msg="Executing migration" logger=migrator...token"
May 20 07:04:32 geekflare.linuxvmimages.com grafana-server[7672]: t=2020-05-20T07:04:32-0400 lvl=info msg="Executing migration" logger=migrator...table"
May 20 07:04:32 geekflare.linuxvmimages.com grafana-server[7672]: t=2020-05-20T07:04:32-0400 lvl=info msg="Executing migration" logger=migrator...e_key"
May 20 07:04:32 geekflare.linuxvmimages.com grafana-server[7672]: t=2020-05-20T07:04:32-0400 lvl=info msg="Created default admin" logger=sqlsto...=admin
May 20 07:04:32 geekflare.linuxvmimages.com grafana-server[7672]: t=2020-05-20T07:04:32-0400 lvl=info msg="Starting plugin search" logger=plugins
May 20 07:04:32 geekflare.linuxvmimages.com grafana-server[7672]: t=2020-05-20T07:04:32-0400 lvl=info msg="Registering plugin" logger=plugins n...Input"
May 20 07:04:32 geekflare.linuxvmimages.com grafana-server[7672]: t=2020-05-20T07:04:32-0400 lvl=info msg="External plugins directory created" ...lugins
May 20 07:04:32 geekflare.linuxvmimages.com systemd[1]: Started Grafana instance.
May 20 07:04:32 geekflare.linuxvmimages.com grafana-server[7672]: t=2020-05-20T07:04:32-0400 lvl=info msg="HTTP Server Listen" logger=http.serv...ocket=
Hint: Some lines were ellipsized, use -l to show in full.
Step 4: Access Grafana Web UI
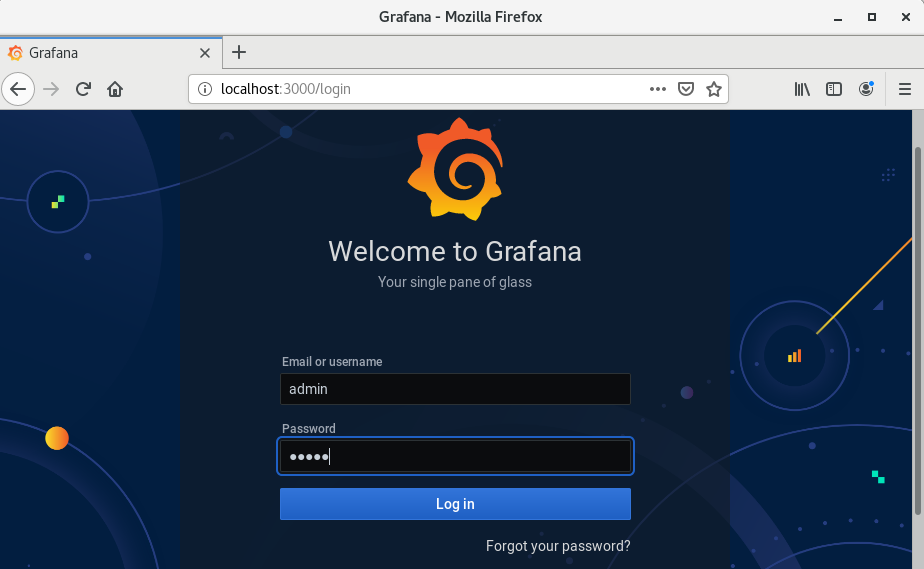
Once the service is up and running, access to server’s IP with port 3000 to access the web interface of Grafana. For the first time, you need to use admin as bother username and password; then you will be asked to set your own password.
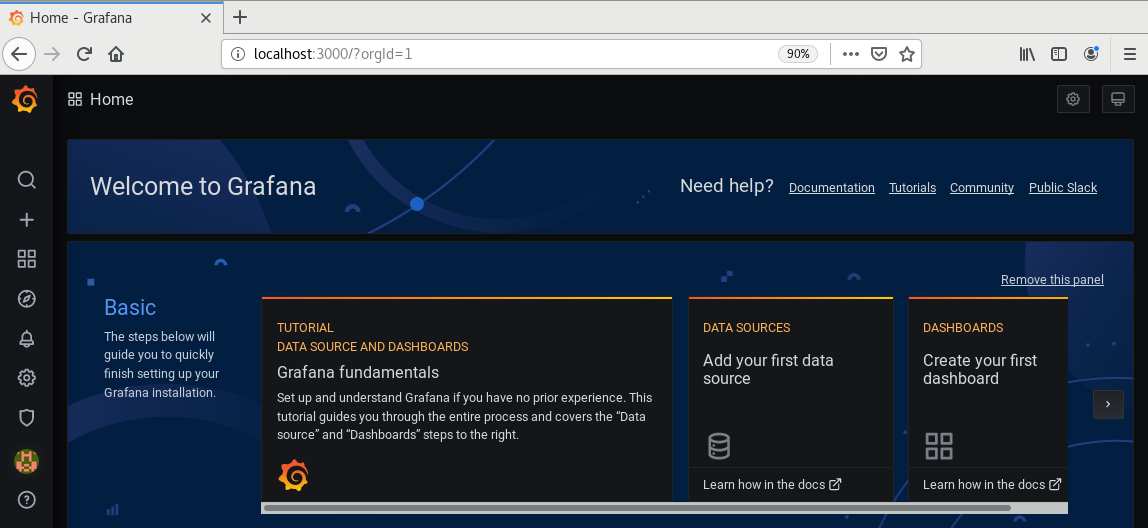
This is how the Home of Grafana looks like.
Installing Node Exporter
node_exporter is an official package that should be installed on Linux servers to be monitored. It exposes multiple hardware and OS metrics, which will be pulled by Prometheus and eventually visualized on Grafana.
Step 1: Download Node Exporter
Use wget to download the node exporter package on your server.
Check out the release page to get the latest version
[centos@geekflare ~]$ wget https://github.com/prometheus/node_exporter/releases/download/v1.0.0-rc.1/node_exporter-1.0.0-rc.1.linux-amd64.tar.gz
--2020-05-20 15:56:13--
https://github.com/prometheus/node_exporter/releases/download/v1.0.0-rc.1/node_exporter-1.0.0-rc.1.linux-amd64.tar.gz
Resolving github.com (github.com)... 13.234.176.102
Connecting to github.com (github.com)|13.234.176.102|:443... connected.
HTTP request sent, awaiting response... 302 Found
Location: https://github-production-release-asset-2e65be.s3.amazonaws.com/9524057/b34b8180-960e-11ea-8df0-39a17445b82f?X-Amz-Algorithm=AWS4-HMAC-SHA256&X-Amz-Credential=AKIAIWNJYAX4CSVEH53A%2F20200520%2Fus-east-1%2Fs3%2Faws4_request&X-Amz-Date=20200520T195614Z&X-Amz-Expires=300&X-Amz-Signature=7f4d746946569dbe71bba5785fb4947348e5e0de1c2e8516b2390a2df2eda801&X-Amz-SignedHeaders=host&actor_id=0&repo_id=9524057&response-content-disposition=attachment%3B%20filename%3Dnode_exporter-1.0.0-rc.1.linux-amd64.tar.gz&response-content-type=application%2Foctet-stream [following]
--2020-05-20 15:56:14--
https://github-production-release-asset-2e65be.s3.amazonaws.com/9524057/b34b8180-960e-11ea-8df0-39a17445b82f?X-Amz-Algorithm=AWS4-HMAC-SHA256&X-Amz-Credential=AKIAIWNJYAX4CSVEH53A%2F20200520%2Fus-east-1%2Fs3%2Faws4_request&X-Amz-Date=20200520T195614Z&X-Amz-Expires=300&X-Amz-Signature=7f4d746946569dbe71bba5785fb4947348e5e0de1c2e8516b2390a2df2eda801&X-Amz-SignedHeaders=host&actor_id=0&repo_id=9524057&response-content-disposition=attachment%3B%20filename%3Dnode_exporter-1.0.0-rc.1.linux-amd64.tar.gz&response-content-type=application%2Foctet-stream
Resolving github-production-release-asset-2e65be.s3.amazonaws.com (github-production-release-asset-2e65be.s3.amazonaws.com)... 52.216.95.83
Connecting to github-production-release-asset-2e65be.s3.amazonaws.com (github-production-release-asset-2e65be.s3.amazonaws.com)|52.216.95.83|:443... connected.
HTTP request sent, awaiting response... 200 OK
Length: 8734373 (8.3M) [application/octet-stream]
Saving to: ‘node_exporter-1.0.0-rc.1.linux-amd64.tar.gz’

100%[============================================================================================================>] 8,734,373 755KB/s in 11s

2020-05-20 15:56:26 (769 KB/s) - ‘node_exporter-1.0.0-rc.1.linux-amd64.tar.gz’ saved [8734373/8734373]
Extract the downloaded file.
[centos@geekflare ~]$ tar -xzf node_exporter-1.0.0-rc.1.linux-amd64.tar.gzStep 2: Configure Node Exporter
It is time to configure Node Exporter as a service inside systemd. Create a file node_exporter.service and put the lines mentioned below in the file and save it.
[centos@geekflare ~]$ sudo gedit /etc/systemd/system/node_exporter.service

[Unit]

Description=node_exporter
Wants=network-online.target
After=network-online.target

[Service]

User=prometheus
Group=prometheus
Type=simple
ExecStart=/home/centos/node_exporter-1.0.0-rc.1.linux-amd64/node_exporter

[Install]

WantedBy=multi-user.target
Step 3: Start Node Exporter
[centos@geekflare ~]$ sudo systemctl daemon-reload
[centos@geekflare ~]$ sudo systemctl start node_exporter
[centos@geekflare ~]$ sudo systemctl status node_exporter
● node_exporter.service - node_exporter
   Loaded: loaded (/etc/systemd/system/node_exporter.service; enabled; vendor preset: disabled)
   Active: active (running) since Wed 2020-05-27 03:42:54 EDT; 2s ago
 Main PID: 9658 (node_exporter)
    Tasks: 3
   CGroup: /system.slice/node_exporter.service
           └─9658 /home/centos/node_exporter-1.0.0-rc.1.linux-amd64/node_exporter

May 27 03:42:54 geekflare.linuxvmimages.com node_exporter[9658]: level=info ts=2020-05-27T07:42:54.870Z caller=node_exporter.go:112 collector=t...l_zone
May 27 03:42:54 geekflare.linuxvmimages.com node_exporter[9658]: level=info ts=2020-05-27T07:42:54.870Z caller=node_exporter.go:112 collector=time
May 27 03:42:54 geekflare.linuxvmimages.com node_exporter[9658]: level=info ts=2020-05-27T07:42:54.870Z caller=node_exporter.go:112 collector=timex
May 27 03:42:54 geekflare.linuxvmimages.com node_exporter[9658]: level=info ts=2020-05-27T07:42:54.870Z caller=node_exporter.go:112 collector=udp_queues
May 27 03:42:54 geekflare.linuxvmimages.com node_exporter[9658]: level=info ts=2020-05-27T07:42:54.870Z caller=node_exporter.go:112 collector=uname
May 27 03:42:54 geekflare.linuxvmimages.com node_exporter[9658]: level=info ts=2020-05-27T07:42:54.870Z caller=node_exporter.go:112 collector=vmstat
May 27 03:42:54 geekflare.linuxvmimages.com node_exporter[9658]: level=info ts=2020-05-27T07:42:54.870Z caller=node_exporter.go:112 collector=xfs
May 27 03:42:54 geekflare.linuxvmimages.com node_exporter[9658]: level=info ts=2020-05-27T07:42:54.870Z caller=node_exporter.go:112 collector=zfs
May 27 03:42:54 geekflare.linuxvmimages.com node_exporter[9658]: level=info ts=2020-05-27T07:42:54.870Z caller=node_exporter.go:191 msg="Listen...=:9100
May 27 03:42:54 geekflare.linuxvmimages.com node_exporter[9658]: level=info ts=2020-05-27T07:42:54.870Z caller=tls_config.go:170 msg="TLS is di...=false
Adding Server to Prometheus
Step 1: Edit prometheus.yml
You need to add a new job in the prometheus.yml file. Open a new tab in the terminal and edit the file as mentioned below.
[centos@geekflare ~]$ sudo gedit prometheus.yml

- job_name: 'node_exporter'
static_configs:
- targets: ['localhost:9100']
Note: Above, I have configured the localhost in the target as I would like to monitor the Prometheus server itself. You can change this to the actual Linux server’s IP. Port 9100 is the default port of node_exporter.
Step 2: Stop and Start Prometheus
[centos@geekflare]$ sudo systemctl stop prometheus.service
[centos@geekflare]$ sudo systemctl start prometheus.service
Step 3: Check Targets
Go to https://localhost:9090/targets; you will find targets running, one will be node exporter.
Integrating Prometheus to Grafana
Now that Grafana and Prometheus are installed. let us use them for monitoring servers.
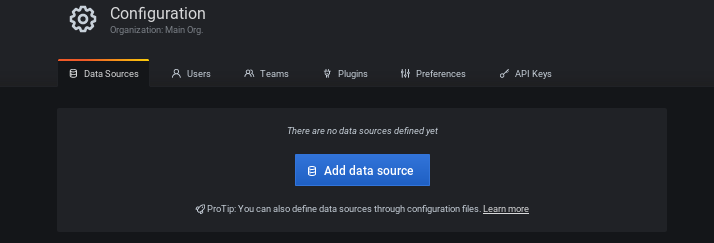
- Go to Grafana home and click on the setting sign on the left. Then click on “Data Sources”.
- Click on Add data source and select Prometheus.
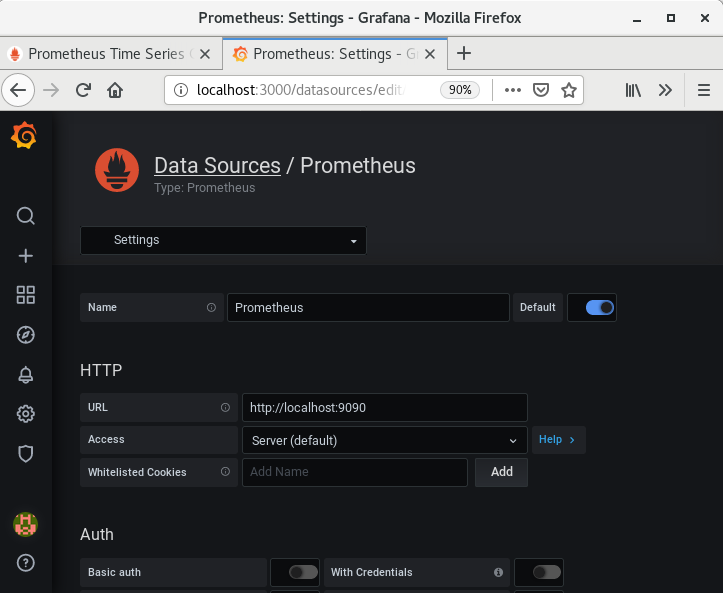
- Set the URL as Prometheus server’s IP with port 9090. In this example, I am running Prometheus and Grafana on the same server so it would be http://localhost:9090
- Click on Save & Test. You will get a success message of data source getting added.
Great!
Grafana is successfully connected to Prometheus. Its time to create a dashboard. To make it easy, I will use the existing node exporter dashboard, which is present on Grafana’s official website to monitor Linux server metrics.
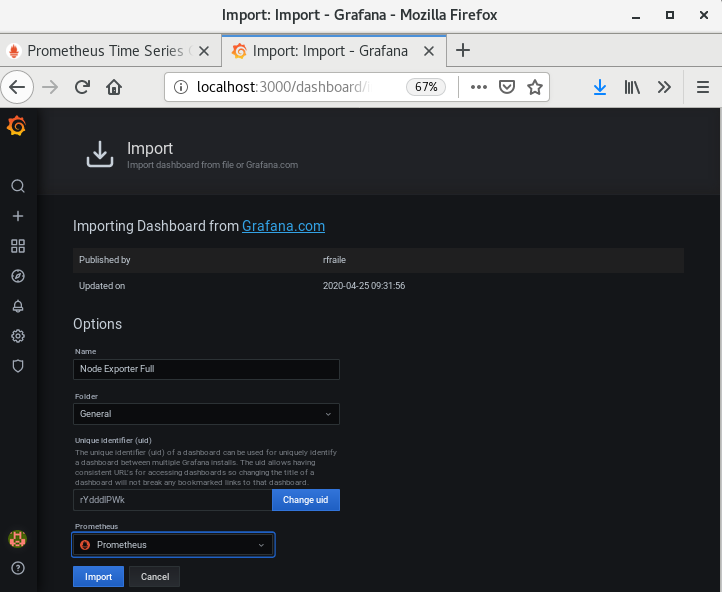
- Go to the Grafana home dashboard, click on + sign and click on Import.
- In Import via grafana.com, put the dashboard id 1860 and click on Load.
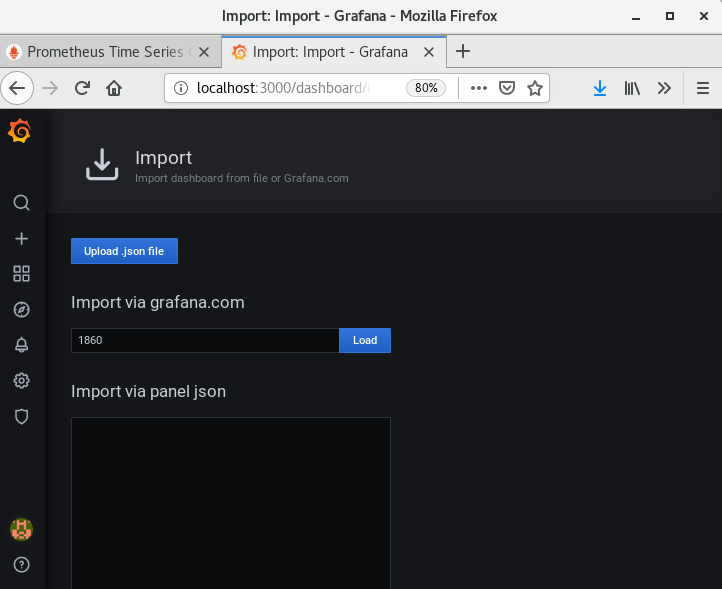
- Then select the Prometheus data source and click on Import.
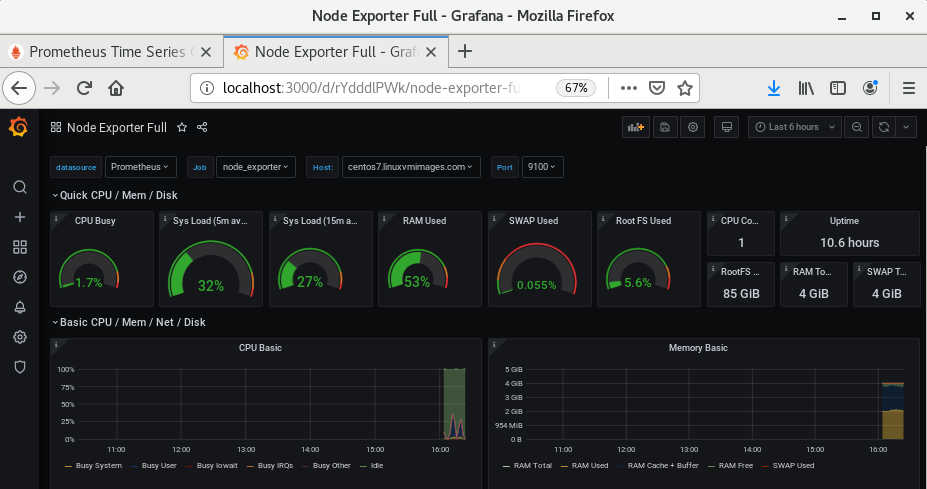
- The complete node exporter dashboard will get imported. You can see all the metrics like system load, ram used, CPU busy, etc. are getting monitored on Grafana successfully.
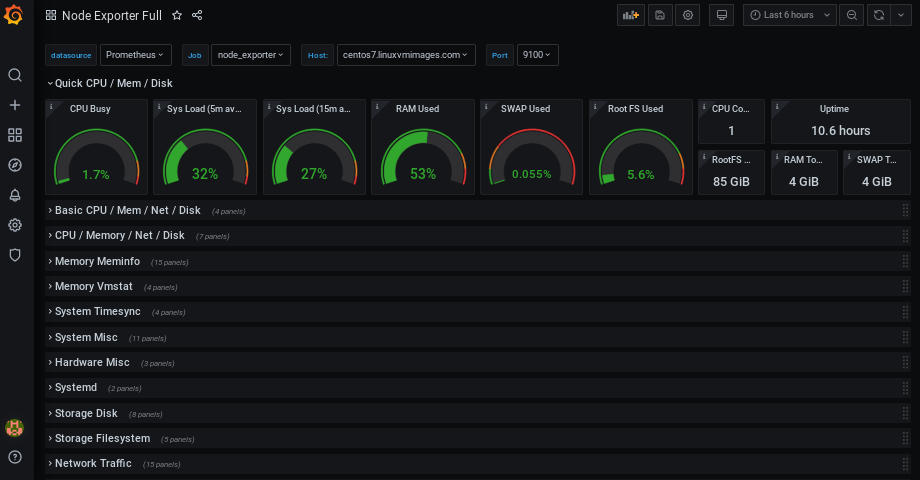
- If you scroll down, you can see Grafana is able to visualize plenty of metrics.
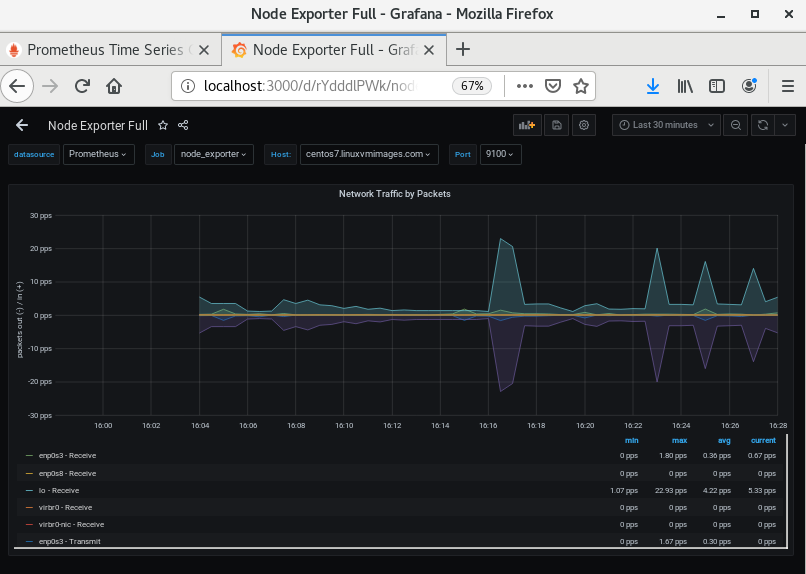
- If you want to get more information, you can click on the particular metric visualization and look at it in detail. Here, I am checking Network Traffic by Packets visualization for the last 30 minutes.
Conclusion
I hope this gives you an idea of how to set up Grafana and Prometheus for server metrics. There are more ways to monitor servers – you can try cloud-based server monitoring or self-hosted lightweight software.
If you are interested in learning Grafana, then I would suggest checking out this Udemy hands-on course.