Demographics
Ranked: The Most Populous Cities in the World


Ranked: The Most Populous Cities in the World
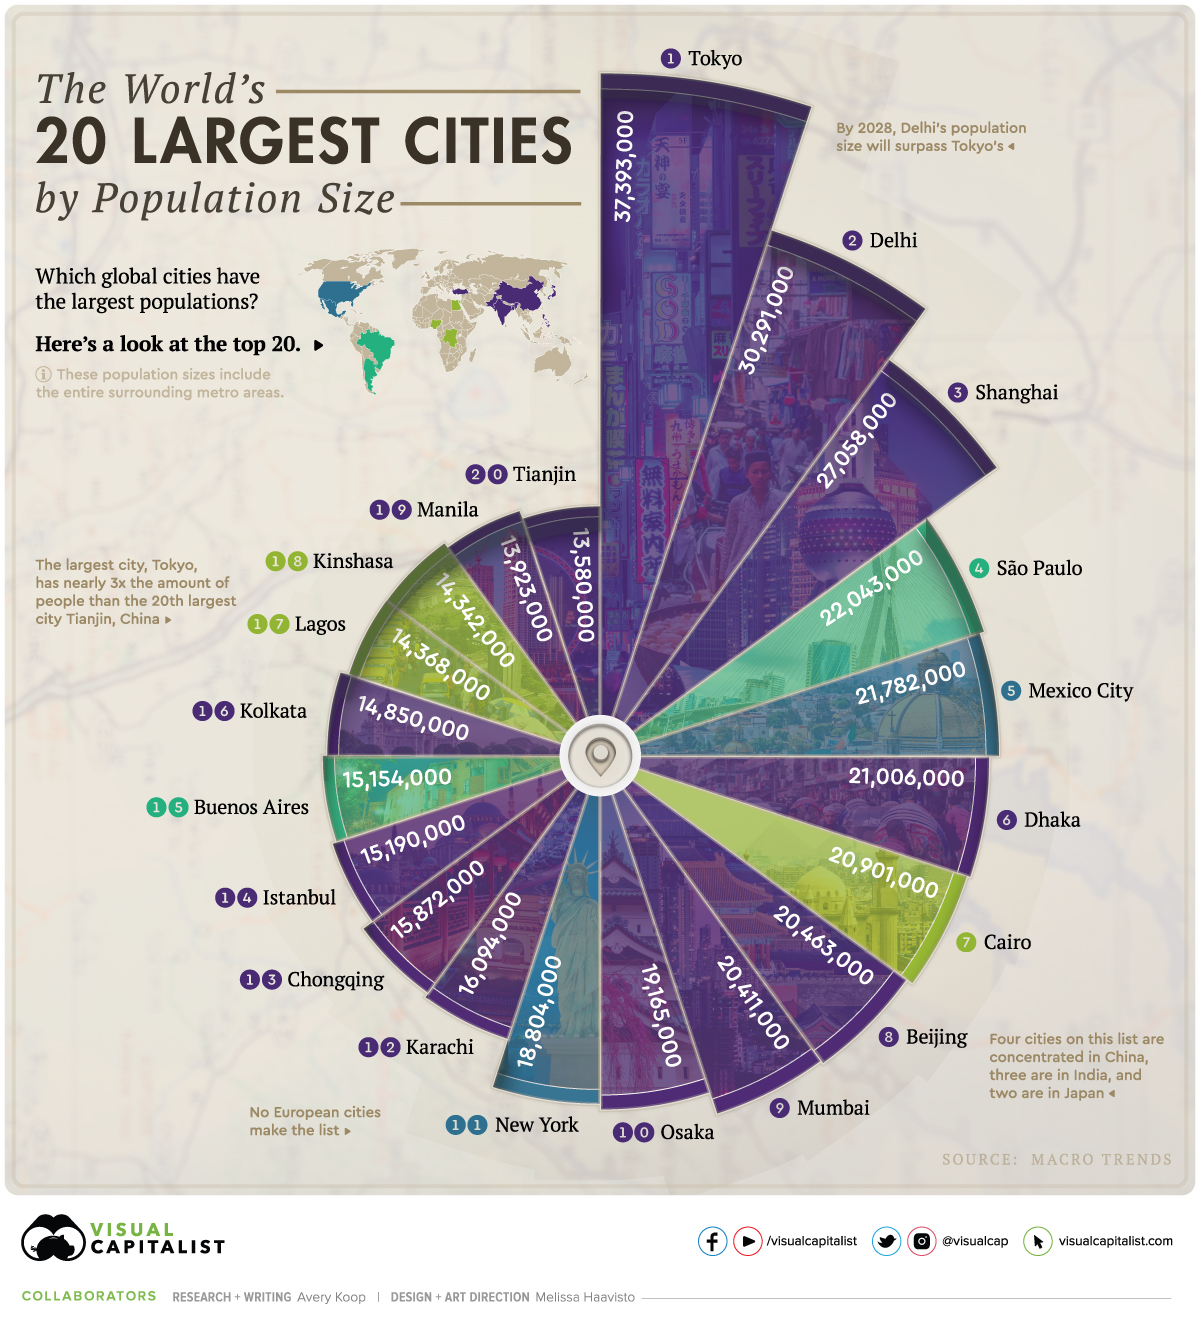
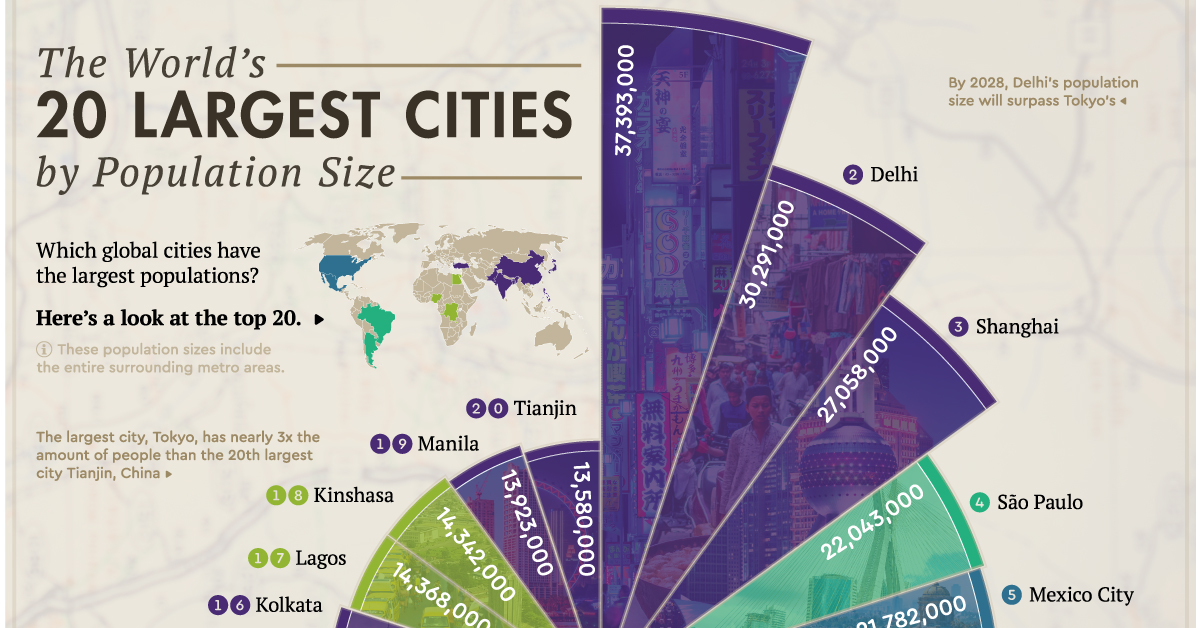
More than half of the world’s population currently lives in cities—and as time goes on, it’s clear that more urban dwellers will find themselves living in megacities.
Megacities are defined as urban areas with a population of more than 10 million people. This means that the world’s top 20 most populous cities are all megacities.
This visualization, using data from Macrotrends, shows the 20 most populous cities in the world.
Rapid Urbanization
Today, more than 80% of people in higher income countries find themselves living in urban areas, and in upper-middle income countries the number lies between 50-80%.
Rural-to-urban migration is an increasingly relevant trend in the 21st century. Prospects of better job opportunities and higher wages, along with shifts from agrarian to industrial and service-based economies, are causing mass movement to cities.
How much have the world’s five most populous cities grown in just the last decade?
| Rank | City | 2010 Population | 2020 Population | Percentage Change |
|---|---|---|---|---|
| #1 | 🇯🇵 Tokyo | 36,834,000 | 37,393,000 | +1.5% |
| #2 | 🇮🇳 Delhi | 21,935,000 | 30,291,000 | +38.1% |
| #3 | 🇨🇳 Shanghai | 19,980,000 | 27,058,000 | +35.4% |
| #4 | 🇧🇷 São Paulo | 19,660,000 | 22,043,000 | +12.1% |
| #5 | 🇲🇽 Mexico City | 20,132,000 | 21,782,000 | +8.2% |
While Tokyo only gained 559,000 people between 2010 and 2020, Delhi gained over 8 million people in the same time frame.
Shanghai grew by over 7 million people. Meanwhile, São Paulo grew by more than 2 million, and Mexico City gained just over 1.6 million people.
Interestingly, Mexico City placed third on the top largest cities list in 2010, but has since experienced slower growth compared to its competitors, Shanghai and São Paulo.
The Most Populous Cities Today
While Tokyo is the world’s most populous city with 37,393,000 people, this number is leveling out due to declining birth rates and an aging population.
Indian and Chinese cities, on the other hand, will continue to grow rapidly in the coming years. In fact, it’s expected that Delhi’s population could surpass Tokyo’s by 2028.
Here’s a closer look at the top 20 most populous cities.
| Rank | City | Population |
|---|---|---|
| 1 | 🇯🇵 Tokyo | 37,393,000 |
| 2 | 🇮🇳 Delhi | 30,291,000 |
| 3 | 🇨🇳 Shanghai | 27,058,000 |
| 4 | 🇧🇷 São Paulo | 22,043,000 |
| 5 | 🇲🇽 Mexico City | 21,782,000 |
| 6 | 🇧🇩 Dhaka | 21,006,000 |
| 7 | 🇪🇬 Cairo | 20,901,000 |
| 8 | 🇨🇳 Beijing | 20,463,000 |
| 9 | 🇮🇳 Mumbai | 20,411,000 |
| 10 | 🇯🇵 Osaka | 19,165,000 |
| 11 | 🇺🇸 New York City | 18,804,000 |
| 12 | 🇵🇰 Karachi | 16,094,000 |
| 13 | 🇨🇳 Chongqing | 15,872,000 |
| 14 | 🇹🇷 Istanbul | 15,190,000 |
| 15 | 🇦🇷 Buenos Aires | 15,154,000 |
| 16 | 🇮🇳 Kolkata | 14,850,000 |
| 17 | 🇳🇬 Lagos | 14,368,000 |
| 18 | 🇨🇩 Kinshasa | 14,342,000 |
| 19 | 🇵🇭 Manila | 13,923,000 |
| 20 | 🇨🇳 Tianjin | 13,580,000 |
By 2035, two new cities are expected to crack the top 20 list. Specifically, it’s projected that Bangalore (India) and Lahore (Pakistan) will boot out Tianjin and Buenos Aires. In addition, Guangzhou, Shenzhen, and Chennai are all expected to meet the megacity definition by 2035.
Urban growth will continue mainly in Asia and Africa, as some cities in regions such as Europe actually begin to shrink in population due to aging citizens and declining birth rates. Since 2012, deaths in the EU have actually been outpacing births—and in 2019, there were 4.7 million deaths compared to 4.2 million births, though net migration kept population numbers from falling.
Life in the City
While there are certainly downsides to mass urbanization, like pollution and overcrowding, the upsides clearly outweigh the negatives for most people. Convenience, better jobs, easier access to social services, and higher wages are among the many reasons people are likely to continue to move to cities, even in the post-COVID era.
With the emergence of smart and green cities, the quality of life for many urban dwellers will likely continue to improve, and more large urban areas will morph into megacities.


Maps
Which Countries Have the Most and Least Women in the Workforce?
More women in the workforce can indicate a shift towards women having more economic opportunities and facing fewer barriers to working outside the home.
Countries With the Most and Least Women in the Workforce
This was originally posted on our Voronoi app. Download the app for free on iOS or Android and discover incredible data-driven charts from a variety of trusted sources.
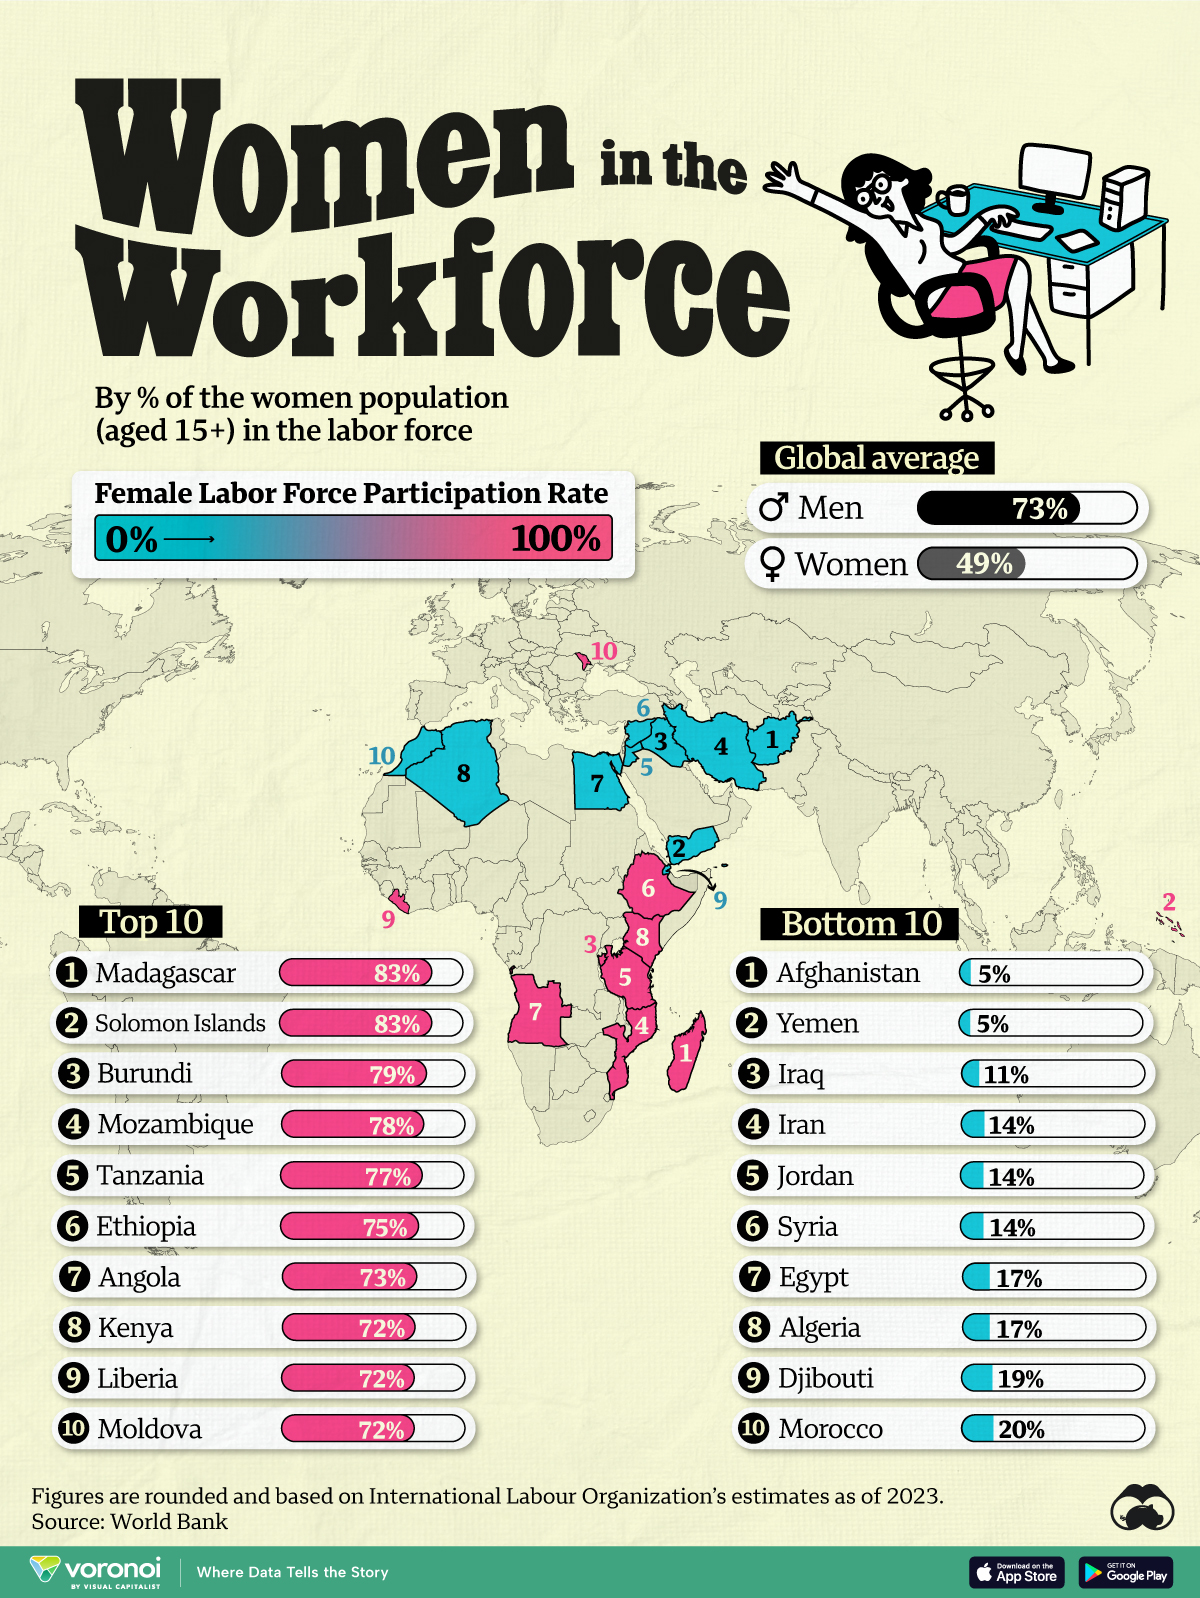
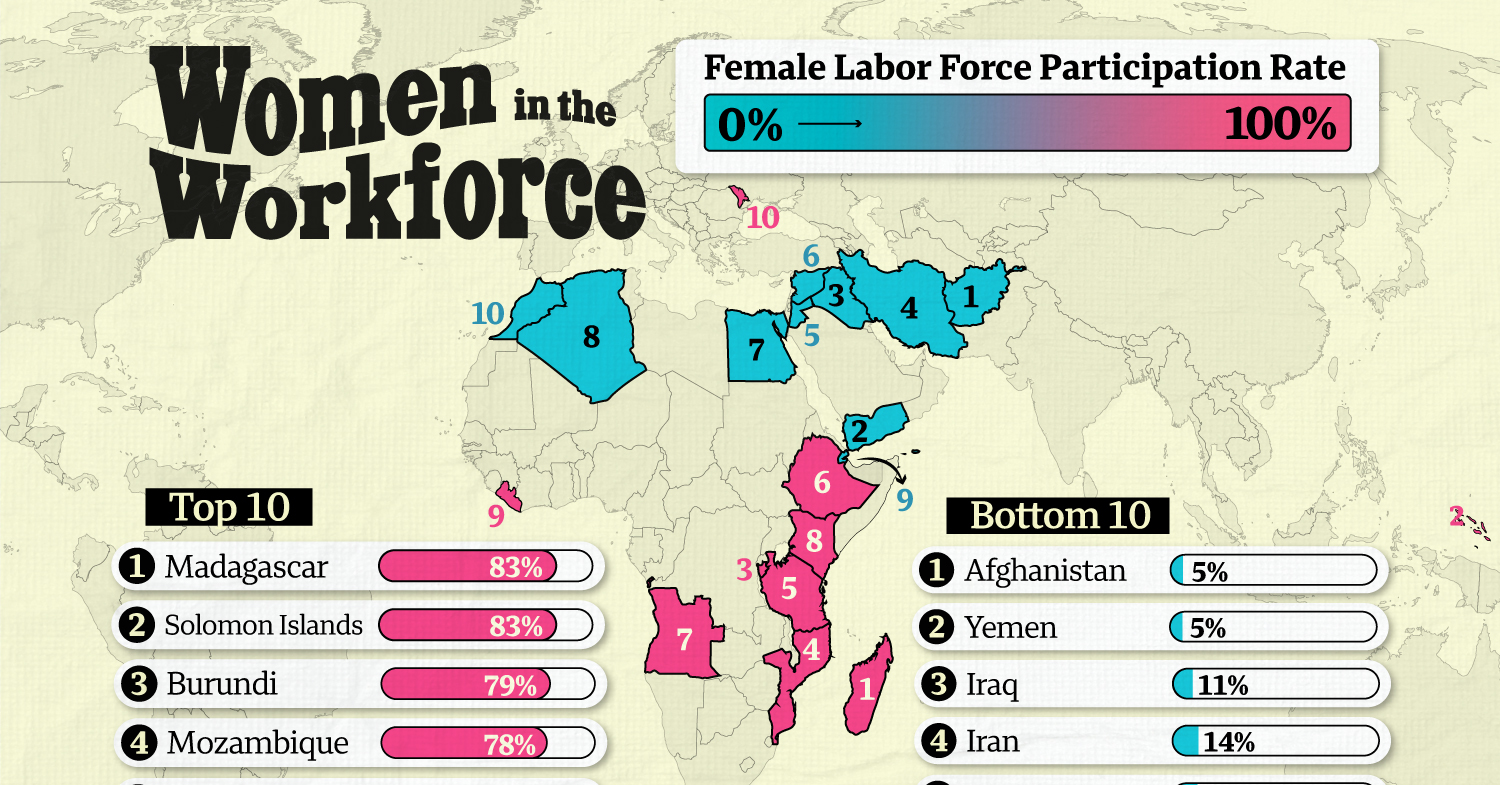
This map shows the top and bottom 10 countries by the percentage of their women population (aged 15+) in the labor force. This is also called the female workforce participation rate.
Data for this graphic is sourced from the World Bank, which aggregates International Labour Organization estimates from 2023.
Ranked: Countries By Rate of Women in the Workforce
Madagascar, Burundi, and Mozambique have some of the highest women workforce participation rates in the world (near 80%).
Here’s a full ranking of countries by their female workforce participation rate.
| Rank | Country | Female Labor Force Participation Rate (2023) |
|---|---|---|
| 1 | 🇲🇬 Madagascar | 83% |
| 2 | 🇸🇧 Solomon Islands | 83% |
| 3 | 🇧🇮 Burundi | 79% |
| 4 | 🇲🇿 Mozambique | 78% |
| 5 | 🇹🇿 Tanzania | 77% |
| 6 | 🇪🇹 Ethiopia | 75% |
| 7 | 🇦🇴 Angola | 73% |
| 8 | 🇱🇷 Liberia | 72% |
| 9 | 🇰🇪 Kenya | 72% |
| 10 | 🇲🇩 Moldova | 72% |
| 11 | 🇪🇷 Eritrea | 71% |
| 12 | 🇸🇸 South Sudan | 70% |
| 13 | 🇮🇸 Iceland | 70% |
| 14 | 🇰🇵 North Korea | 70% |
| 15 | 🇰🇭 Cambodia | 70% |
| 16 | 🇻🇳 Viet Nam | 69% |
| 17 | 🇳🇿 New Zealand | 68% |
| 18 | 🇺🇬 Uganda | 68% |
| 19 | 🇦🇿 Azerbaijan | 67% |
| 20 | 🇨🇲 Cameroon | 67% |
| 21 | 🇨🇩 Congo | 67% |
| 22 | 🇵🇪 Peru | 66% |
| 23 | 🇧🇸 Bahamas | 65% |
| 24 | 🇬🇭 Ghana | 65% |
| 25 | 🇧🇹 Bhutan | 65% |
| 26 | 🇶🇦 Qatar | 64% |
| 27 | 🇲🇼 Malawi | 64% |
| 28 | 🇨🇫 Central African Republic | 63% |
| 29 | 🇸🇪 Sweden | 63% |
| 30 | 🇰🇿 Kazakhstan | 63% |
| 31 | 🇲🇴 Macao | 63% |
| 32 | 🇨🇩 DRC | 63% |
| 33 | 🇱🇨 St. Lucia | 63% |
| 34 | 🇳🇪 Niger | 62% |
| 35 | 🇳🇴 Norway | 62% |
| 36 | 🇳🇱 Netherlands | 62% |
| 37 | 🇸🇬 Singapore | 62% |
| 38 | 🇦🇺 Australia | 62% |
| 39 | 🇯🇲 Jamaica | 61% |
| 40 | 🇨🇭 Switzerland | 61% |
| 41 | 🇨🇦 Canada | 61% |
| 42 | 🇪🇪 Estonia | 61% |
| 43 | 🇹🇱 Timor-Leste | 61% |
| 44 | 🇭🇹 Haiti | 61% |
| 45 | 🇮🇱 Israel | 61% |
| 46 | 🇻🇺 Vanuatu | 61% |
| 47 | 🇨🇳 China | 61% |
| 48 | 🇿🇼 Zimbabwe | 60% |
| 49 | 🇨🇾 Cyprus | 60% |
| 50 | 🇧🇴 Bolivia | 60% |
| 51 | 🇧🇼 Botswana | 60% |
| 52 | 🇮🇪 Ireland | 60% |
| 53 | 🇩🇰 Denmark | 60% |
| 54 | 🇵🇾 Paraguay | 60% |
| 55 | 🇧🇾 Belarus | 59% |
| 56 | 🇹🇭 Thailand | 59% |
| 57 | 🇧🇧 Barbados | 59% |
| 58 | 🇬🇧 UK | 58% |
| 59 | 🇱🇺 Luxembourg | 58% |
| 60 | 🇫🇮 Finland | 58% |
| 61 | 🇧🇫 Burkina Faso | 58% |
| 62 | 🇱🇸 Lesotho | 58% |
| 63 | 🇱🇹 Lithuania | 57% |
| 64 | 🇲🇹 Malta | 57% |
| 65 | 🇦🇹 Austria | 57% |
| 66 | 🇧🇯 Benin | 57% |
| 67 | 🇨🇮 Cote d'Ivoire | 57% |
| 68 | 🇺🇸 U.S. | 57% |
| 69 | 🇩🇪 Germany | 56% |
| 70 | 🇬🇲 Gambia | 56% |
| 71 | 🇬🇺 Guam | 56% |
| 72 | 🇸🇰 Slovakia | 56% |
| 73 | 🇹🇬 Togo | 56% |
| 74 | 🇦🇲 Armenia | 56% |
| 75 | 🇱🇦 Laos | 56% |
| 76 | 🇰🇷 South Korea | 56% |
| 77 | 🇳🇦 Namibia | 56% |
| 78 | 🇺🇾 Uruguay | 56% |
| 79 | 🇱🇻 Latvia | 56% |
| 80 | 🇧🇳 Brunei | 55% |
| 81 | 🇦🇪 UAE | 55% |
| 82 | 🇵🇹 Portugal | 55% |
| 83 | 🇷🇼 Rwanda | 55% |
| 84 | 🇻🇨 St. Vincent & the Grenadines | 55% |
| 85 | 🇯🇵 Japan | 55% |
| 86 | 🇷🇺 Russia | 55% |
| 87 | 🇬🇪 Georgia | 54% |
| 88 | 🇭🇺 Hungary | 54% |
| 89 | 🇸🇮 Slovenia | 54% |
| 90 | 🇰🇬 Kyrgyz Republic | 54% |
| 91 | 🇮🇩 Indonesia | 53% |
| 92 | 🇪🇨 Ecuador | 53% |
| 93 | 🇧🇷 Brazil | 53% |
| 94 | 🇦🇱 Albania | 53% |
| 95 | 🇫🇷 France | 53% |
| 96 | 🇲🇳 Mongolia | 53% |
| 97 | 🇳🇨 New Caledonia | 53% |
| 98 | 🇪🇸 Spain | 53% |
| 99 | 🇿🇦 South Africa | 52% |
| 100 | 🇭🇰 Hong Kong | 52% |
| 101 | 🇳🇬 Nigeria | 52% |
| 102 | 🇿🇲 Zambia | 52% |
| 103 | 🇨🇿 Czechia | 52% |
| 104 | 🇨🇱 Chile | 52% |
| 105 | 🇩🇴 Dominican Republic | 52% |
| 106 | 🇬🇶 Equatorial Guinea | 52% |
| 107 | 🇲🇾 Malaysia | 52% |
| 108 | 🇲🇱 Mali | 52% |
| 109 | 🇵🇱 Poland | 52% |
| 110 | 🇸🇱 Sierra Leone | 52% |
| 111 | 🇨🇴 Colombia | 51% |
| 112 | 🇨🇻 Cabo Verde | 51% |
| 113 | 🇬🇬 Channel Islands | 51% |
| 114 | 🇷🇸 Serbia | 51% |
| 115 | 🇦🇷 Argentina | 51% |
| 116 | 🇧🇪 Belgium | 51% |
| 117 | 🇵🇦 Panama | 50% |
| 118 | 🇧🇿 Belize | 50% |
| 119 | 🇧🇬 Bulgaria | 50% |
| 120 | 🇭🇳 Honduras | 50% |
| 121 | 🇵🇫 French Polynesia | 49% |
| 122 | 🇲🇪 Montenegro | 49% |
| 123 | 🇳🇮 Nicaragua | 49% |
| 124 | 🇹🇲 Turkmenistan | 49% |
| 125 | 🇬🇼 Guinea-Bissau | 49% |
| 126 | 🇹🇩 Chad | 49% |
| 127 | 🇭🇷 Croatia | 48% |
| 128 | 🇰🇼 Kuwait | 48% |
| 129 | 🇸🇿 Eswatini | 47% |
| 130 | 🇵🇭 Philippines | 47% |
| 131 | 🇲🇽 Mexico | 47% |
| 132 | 🇵🇬 Papua New Guinea | 46% |
| 133 | 🇸🇻 El Salvador | 46% |
| 134 | 🇹🇹 Trinidad and Tobago | 46% |
| 135 | 🇬🇷 Greece | 45% |
| 136 | 🇻🇮 U.S. Virgin Islands | 45% |
| 137 | 🇨🇷 Costa Rica | 45% |
| 138 | 🇸🇷 Suriname | 45% |
| 139 | 🇧🇭 Bahrain | 44% |
| 140 | 🇲🇺 Mauritius | 43% |
| 141 | 🇹🇴 Tonga | 43% |
| 142 | 🇲🇻 Maldives | 43% |
| 143 | 🇲🇰 North Macedonia | 43% |
| 144 | 🇬🇳 Guinea | 42% |
| 145 | 🇷🇴 Romania | 42% |
| 146 | 🇨🇺 Cuba | 42% |
| 147 | 🇲🇲 Myanmar | 42% |
| 148 | 🇼🇸 Samoa | 41% |
| 149 | 🇮🇹 Italy | 41% |
| 150 | 🇬🇹 Guatemala | 41% |
| 151 | 🇧🇦 Bosnia & Herzegovina | 41% |
| 152 | 🇬🇦 Gabon | 40% |
| 153 | 🇺🇿 Uzbekistan | 40% |
| 154 | 🇬🇾 Guyana | 40% |
| 155 | 🇻🇪 Venezuela | 39% |
| 156 | 🇫🇯 Fiji | 39% |
| 157 | 🇸🇹 Sao Tome & Principe | 38% |
| 158 | 🇸🇳 Senegal | 38% |
| 159 | 🇧🇩 Bangladesh | 37% |
| 160 | 🇹🇷 Türkiye | 35% |
| 161 | 🇱🇾 Libya | 35% |
| 162 | 🇸🇦 Saudi Arabia | 35% |
| 163 | 🇰🇲 Comoros | 33% |
| 164 | 🇮🇳 India | 33% |
| 165 | 🇱🇰 Sri Lanka | 32% |
| 166 | 🇴🇲 Oman | 32% |
| 167 | 🇵🇷 Puerto Rico | 32% |
| 168 | 🇹🇯 Tajikistan | 32% |
| 169 | 🇳🇵 Nepal | 29% |
| 170 | 🇸🇩 Sudan | 28% |
| 171 | 🇱🇧 Lebanon | 28% |
| 172 | 🇹🇳 Tunisia | 27% |
| 173 | 🇲🇷 Mauritania | 26% |
| 174 | 🇵🇰 Pakistan | 25% |
| 175 | 🇸🇴 Somalia | 21% |
| 176 | 🇲🇦 Morocco | 20% |
| 177 | 🇩🇯 Djibouti | 19% |
| 178 | 🇩🇿 Algeria | 17% |
| 179 | 🇪🇬 Egypt | 17% |
| 180 | 🇸🇾 Syria | 14% |
| 181 | 🇯🇴 Jordan | 14% |
| 182 | 🇮🇷 Iran | 14% |
| 183 | 🇮🇶 Iraq | 11% |
| 184 | 🇾🇪 Yemen | 5% |
| 185 | 🇦🇫 Afghanistan | 5% |
Note: Figures rounded and based on International Labour Organization’s estimates as of 2023.
On the other hand, Afghanistan and Yemen are currently estimated to have the lowest percentage of working-aged women in their workforce at 5%.
By glancing through the bottom 20, it’s apparent that countries in the Middle East, North Africa, and South Asia exhibit notably lower rates of women in the workforce.
As Our World in Data points out, female labor force participation peaks in some of the richest and poorest countries in the world. But is lowest in countries with average national incomes.
More people in the workforce can contribute to economic growth and productivity. As women make up roughly half the population, their participation can be a major driver of economic expansion.

-
 Mining6 days ago
Visualizing Cobalt Production by Country in 2023
-

 Personal Finance2 weeks ago
Mapped: The Income a Family Needs to Live Comfortably in Every U.S. State
-

 Energy2 weeks ago
Ranked: The World’s Largest Lithium Producers in 2023
-
 Maps2 weeks ago
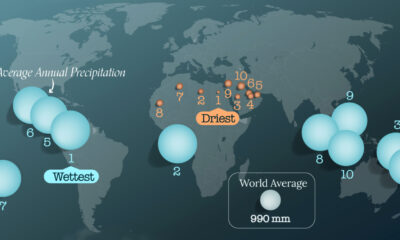
Mapped: The World’s Wettest and Driest Countries
-
 Healthcare2 weeks ago
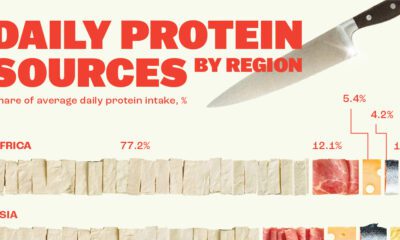
Visualizing Daily Protein Sources by Region
-

 Maps2 weeks ago
Map: Where Are America’s Largest Landfills?
-

 AI1 week ago
Nvidia is Worth More Than All of These Companies Combined
-

 Stocks1 week ago
Visualizing Berkshire Hathaway’s Stock Portfolio (Q1 2024)