The driving mechanism and path selection of green development in Chinese cities
 Wang Xisha*
  Li Jinye*
- School of Economics and Management, Xinjiang University, Urumqi, Xinjiang, China
Green is the background color of high-quality development of Chinese cities. By constructing a theoretical model of the driving force and driving mechanism of China’s urban green development, this paper simulates the green development path of Chinese cities based on the panel data of Chinese cities from 2010 to 2020. The empirical results show that, firstly, the driven force formed by scientific and technological in novation, the action force formed by structural adjustment and the driven force formed by environmental regulation can drive Chinese cities to achieve green development. Secondly, the pressure of different paths on the ecological environment showed a gradual downward trend, the ecological environment pressure under the baseline scenario was the highest, and the ecological environment pressure driven by single factors may be lower than that driven by two factors. Finally, the comprehensive driven path formed by the combination of innovation driven, structure driven and environment a driven is a better path for China’s urban green development. Therefore, the green development of Chinese cities requires policy intervention, different cities need to formulate green development plans according to local conditions, and should consider the combination of policies. In the future, Chinese cities need to increase investment in science and technology, guide all entities to develop in the direction of resource conservation and pollution reduction, adjust the industrial structure, promote their development in the direction of cleanliness, increase environmental protection investment, standardize the development of all entities in the direction of environmental protection, and give full play to the synergy of the three major policies to achieve green development.
1 Introduction
Since the reform and opening up, China has achieved world-renownde economic achievements, but the unsustainable development has brought increasingly serious environmental problems. China urgently needs to change its economic development model, and green development has emerged as the times require. Green is the background color of high-quality urban development (Wang et al., 2023). Promoting green development is the only way to improve China’s urban competitiveness and achieve high-quality development transformation. The path of green development has become the focus of scholars’ attention, the current research focuses on the system construction, the promotion of values and the improvement of technology. First of all, the study focused on the level of system construction. The green procurement strategies of local governments in Northern Ireland can significantly influence the development of green cities (Murray, 2000). The path of green urbanization should combine the intensive development of cities and towns with the green development (Wei, 2012). The green urbanization requires the joint promotion of industy, financial, fiscal and social policies (Feng and Jia, 2016). The carbon market can promote the technological innovation of participants, and ultimately improve the level of urban green development through energy conservation and emission reduction (Liang et al., 2023). Green development should be achieved by improving the institutional system and improving the green and low-carbon constraints and incentive mechanisms (Huang and Lou, 2023). Secondly, the study focused on the promotion of values. The improvement of the urban environment should consider raising public attention and prompting the government to introduce corresponding measures (Zheng et al., 2013). The decision-making and implementation of green thinking is a fundamental requirement for green development (Kim et al., 2014). China should choose an appropriate urbanization model to achieve green urbanization through institutional reform (Li and Sheng, 2014). The green living should become a new fashion and advocate a green and low-carbon lifestyle (Guo, 2023). Finally, the study focused on technological improvement. The establishment of ecological cities should use green technology to develop compact urban forms (Kenworthy, 2006). The development of cities should consider two aspects: energy supply and building energy efficiency (Carter and Culp, 2010). The green industry can promote the development of green urbanization (Zhang, 2018). The innovative city pilot policy has a spillover effect on urban green development, which can promote urban emission reduction and pollution reduction, and contribute to the realization of green development (Zhang and Fan, 2023).
Regarding the research on the realization mechanism of green development, scholars mainly focus on two aspects. First, the study focused on the mechanism of action of one aspect. Based on ecological economics and systematic analysis methods, the concept of establishing and improving the operation mechanism of ecological capital was discussed, it should include the accumulation mechanism, conversion mechanism, compensation mechanism and incentive mechanism of ecological capital operation mechanism (Deng et al., 2012). Green development is achieved through the promotion mechanism of capital logic, the guarantee mechanism of controlling capital logic, and the leading mechanism that transcends capital logic (Yu, 2018). According to the panel regression model, the innovation driving mechanism of green development should take into account both technical innovation and institutional innovation (Feng, 2017). Using the double difference model and the mediation effect model, it is found that the innovative city pilot policy can significantly promote the green development of Chinese cities, but there is a lag, and its performance is more significant in megacities, eastern cities and resource-based cities (Liu et al., 2022). Through testing that under the path of technology introduction and imitation innovation, the impact of environmental regulation on industrial green transformation was first promoted and then suppressed, and under the path of independent innovation, the impact was first suppressed and then promoted (Song et al., 2020). By drawing on the environmental impact assessment model of scalable randomness, it is found that there is an inverted “U” relationship between environmental regulation and urban green development, and it mainly promotes the transformation of urban green development through the intermediary path of technological innovation (Hu et al., 2022). By using the B-K mediation effect model to analyze the transmission mechanism of environmental regulation, it is found that environmental regulation indirectly promotes the green development of resource-based cities through technological innovation and upgrading, industrial structure adjustment, foreign investment guidance, and human capital accumulation, and its transmission paths are quite different in geographical location (Xue and Zhang, 2023). Based on the mediating effect of technological innovation and industrial upgrading, the role path of digital economy on regional green development level was empirically studied. Second, the study focused on the mechanism of action in terms of integration (Zhao and Wei, 2023). The theoretical premise of green development is to realize the symbiosis of economic system, social system and natural system, thus forming the coupling of green growth, green wealth and green welfare (Hu and Zhou, 2014). The realization mechanism of green transformation includes five aspects: regional structure, input structure, industrial structure, emission structure and institutional structure (Fu, 2019). Through the use of linear regression, decoupling and LMDI methods, it is found that there is an inverted “U" shape between urban green development level and resource consumption, resource intensity is the main driving force for decoupling resource consumption and environmental quality, and economic intensity, spatial structure and population size are the main resistances (Chen et al., 2023).
It can be seen that scholars’ research on green development is relatively comprehensive, and the research results are very rich. However, there are not many general discussions on the driving force and driving mechanism of the realization path of urban green development, the scenario simulation analysis of the realization path of green development, and the realization of green development of cities based on different development foundations and characteristics. Therefore, the paper attempts to discuss the driving force and driving mechanism of China’s urban green development. On this basis, it conducts scenario simulations on the future urban green development path to find out a more suitable path for Chinese cities to achieve green development.
The possible marginal contributions of this paper are as follow: first, the paper constructs a theoretical model based on the “three forces” of pulling force, action force, and propulsive force, and forms the content of the “three drivens” of innovation driven, structure driven, and environment driven, and analysis the driven forces and driven mechanisms. Second, based on the PSR model, the paper constructs three scenarios of baseline scenario, single factor driven scenario and multi factor driven scenario, and eight driven paths of innovation driven path, structure driven path, and environment driven path. The green development path of Chinese cities system dynamics model and empirical analysis of the driving path of green development in Chinese cities. Third, considering the development characteristics of Chinese cities, the paper selects three typical cities: the eastern coastal city with strong economic strength—Guangzhou, the central riverside city with strong economic development potential—Wuhan, and the western city with relatively good late-mover advantages in economic development—Urumqi, to simulate the urban green development path from 2021 to 2035, conducts specific analysis on cities with different development foundations and characteristics, and make general research conclusions.
2 Mechanism and hypothesis
The remainder of the article is organized as follows. Section 2 introduces the driving mechanism of China’s urban green development and establishes research hypotheses. Section 3 presents the research methodology and data. Section 4 presents the empirical results and discussion. Section 5 presents conclusions and policy recommendations (Figure 1).
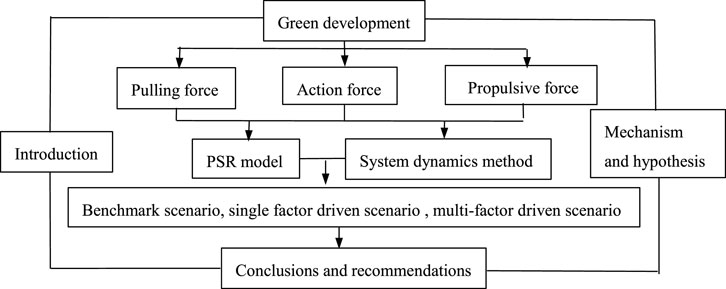
FIGURE 1. Research framework.
2.1 Pulling force: technological innovation
Both the neoclassical growth theory represented by Solow and the endogenous growth theory represented by Romer and Lucas believed that technological progress is an important factor in promoting economic growth. Technological progress is affected by innovation ability, which depends on a large number of knowledgeable and skilled labor force and a large amount of R&D investment. Technological progress enters the green R&D department of the city, which brings about the improvement of energy saving and emission reduction technology, and the level of undesired output can be improved. Reduce Technological progress enters the production sector of the city, bringing about a reduction in production costs and an increase in labor productivity, and the expected output level increases accordingly. To a certain extent, it promotes the improvement of the efficiency of urban green development.
In addition, technological progress will also be affected by the ability to introduce technology, and the level of opening up reflects the ability to introduce technology. A city’s high level of opening up to the outside world is often accompanied by the inflow of advanced technology and management experience. It can not only improve the level of resource allocation and utilization, but also deeply tap the potential of future green development and bring about an improvement in the efficiency of green development. However, it should also be noted that cities with a high level of opening up to the outside world may also bring high energy consumption and high pollution enterprises to settle in, forming a “pollution paradise”. Therefore, the level of opening to the outside world can affect the green development efficiency of cities.
The pulling force is mainly to increase green input and output through technological innovation, which mainly includes internal technological catch-up, internal technological leadership and external innovation spillover. Technology catch-up is concentrated in underdeveloped cities, where pollution emissions mainly come from industry. The government aims to achieve green development by increasing investment in science and technology, guiding enterprises to increase research and development, and improving product processes. The technological diffusion rate of underdeveloped cities is higher than that of developed cities. To achieve technological catch-up, both the technology diffusion theory and the late-comer advantage theory believe that technological progress is promoted through the late-comer advantage of technology diffusion and technological differences. The technological diffusion rate of underdeveloped cities is higher than that of developed cities. To achieve technological catch-up, technological innovation relying on human capital and foreign direct investment technology spillovers. The technology catch-up trajectory of underdeveloped cities presents a process of “technology introduction—technology digestion - technology re innovation,” which realizes the improvement of technology and product upgrades in underdeveloped cities, increases green output, and realizes green development.
Technology leadership is concentrated in developed cities and some underdeveloped cities. Technological leadership is different from general technological innovation. It is forward-looking and breakthrough and leads the future development direction of cities. Developed cities have strong economic strength, abundant talent reserves, and more financial resources and ability to carry out innovative activities. Some underdeveloped cities can conduct technological research and development in a certain field. The government can increase investment in science and technology to leverage the entry of social capital. This kind of innovation requires abandoning old technical specifications and re-selecting new ones. Therefore, the cooperation of relevant fields is needed to promote the realization of subversive changes. The technology-leading trajectory presents a process of “technology research and development-technological accumulation-technical breakthrough,” increasing the green output of developed cities and some underdeveloped cities and realizing green development.
Innovation spillovers are mainly reflected in the impact of foreign direct investment on the technological progress of host country enterprises. On the one hand, foreign direct investment can be used as a demonstration for host country enterprises, forcing local enterprises to learn and absorb advanced green technologies and improve their own production processes. On the other hand, foreign-funded enterprises attract a large number of technical personnel and management personnel to enhance the human capital of the host country and improve the level of green technology. However, its performance is staged. At the beginning of innovation, it forms a strong protective force, hindering innovation spillovers. When it reaches a certain stage of development, spillovers and diffusion will occur. The core technology of foreign-funded enterprises will be retained, and even directly transferred to low-end industries, causing the host country to become a “pollution haven”. Based on the above analysis, the paper puts forward the research hypothesis H1:
H1: The pulling force formed by scientific and technological innovation drives Chinese cities to achieve green development.
2.2 Action force: structural adjustment
In the 1950s, two economist began to pay attention to the relationship between economic growth and industrial structure (Clack, 1957; Kuznets, 1971), An American economist emphasized the important impact of structural change on productivity growth in his analysis of theoretical models of economic growth (Lucus, 1993). The “structural dividend hypothesis” was proposed, this theory argues that due to differences in productivity and growth rates among sectors, factors shift from lower to higher sectors, and this process also contributes to the growth of total productivity (Timmer and Szirmai, 2000). Similarly, the energy factor productivity of cities is also transferred due to differences, and this process can also promote the overall increase in energy productivity. Subsequently, scholars conducted verification from different perspectives, One of the more commonly used methods is to analyze from the perspective of industrial structure dividend, that is, in the early stage of economic development, industrial structure has a promoting effect on economic growth, and when the economy develops to a certain extent, this dividend will disappear. At this time, we should adjust the industrial structure and develop in the direction of industrial premiumization.
The action force is mainly achieved through structural adjustment to increase green input and output, mainly including adjustments in the structure of industries, energy, and products. Through market regulation and environmental regulation, the industry structure adjustment aims to achieve efficient, clean and advanced development of various industries. On the one hand, using modern technology and processes to carry out green transformation of traditional industries. On the other hand, we should vigorously develop strategic emerging industries to help them grow and become leading industries in cities.
Energy structure adjustment refers to the process of enterprises being constrained by environmental regulations and production costs, gradually reducing fossil energy consumption, improving the utilization of clean energy, and continuously improving energy utilization efficiency, reducing unit energy consumption, and achieving green production. China’s energy structure is characterized by “rich coal,” which is prone to path dependence on “strong coal” consumption. So we should strictly control the total coal consumption, make overall plans to promote the adjustment of the energy structure, and promote the construction of clean and low-carbon energy.
Product structure adjustment mainly accompanies the cultivation of the government’s and public’s green consumption concept, which will inevitably increase the demand for green, circular and economical products, and the change of demand structure forces the change of enterprise production structure, and enterprises will inevitably carry out green product production, thereby enhancing green development. Based on the above analysis, this paper proposes a research hypothesis H2:
H2: The action force formed by structural adjustment drives China’s cities to achieve green development.
2.3 Propulsive force: environmental regulation
Due to the limited carrying capacity of resources and the environment, the sewage wastes discharged from industrial production and daily life lead to endless resource and environmental problems, and due to the characteristics of public goods in the environment and the existence of “free rider” phenomenon, it will lead to market failure. At this time, the government can intervene in the destruction of the environment through environmental regulations to achieve the purpose of protecting the environment. Environmental regulation is a means of correcting negative environmental externalities in economic production (Wang, 2021). Environmental regulation can directly regulate the pollution discharge behavior of enterprises, force enterprises to carry out technological innovation, update production equipment and technological processes, and achieve the dual prongs of front-end prevention and end-of-line treatment, so as to achieve the purpose of solving environmental problems.
The propulsive force is mainly to force enterprises to innovate technology, reduce pollution, and achieve an increase in green input and output through environmental regulations, mainly including command and control, economic incentive, and informal environmental regulations. Command and control environmental regulation focuses on administrative legislation, the establishment of environmental standards and norms, and the technical requirements adopted by enterprises. Administrative legislation sets pollution thresholds through mandatory measures to limit environmental damage by enterprises and guide the upgrading of enterprise structures. The establishment of environmental protection standards and norms allows enterprises to perceive the benefits and environmental pressures they face, and guide them to carry out production and governance in a planned and step-by-step manner. Its role is immediate, but it requires higher government enforcement and regulation requirements, as well as higher enforcement costs, which can lead to a decrease in the enthusiasm of enterprises. Therefore, it needs to be coupled with other types of environmental regulations.
Economic incentive environmental regulation guides enterprises to discharge pollutants through market signals. Technological innovation is uncertain and requires large upfront investment. In order to mobilize the enthusiasm and initiative of enterprises in research and development, the government reduces their research and development costs through subsidies, and restricts their pollution emission behavior through fees and emission rights, forcing enterprises to form green production methods. In addition, in order to encourage green consumption, the government can expand the prospects of green consumption through deposit refund.
With the improvement of environmental protection organizations, industry associations, and public awareness, informal environmental regulations have emerged and gradually played a role, including environmental certification and environmental agreements. It is established on the voluntary basis of industries, organizations, and the public, forming a green atmosphere of production and consumption in the entire society. Based on the above analysis, the article proposes research hypothesis H3:
H3: The propulsive force formed by environmental regulations drives the green development of Chinese cities.
3 Methods and data
3.1 Model construction of system dynamics
3.1.1 System boundary construction model selection
The OECD and UNEP jointly proposed a Pressure State Response (PSR) model for policy analysis of sustainable development. Among them, pressure (P) represents a series of pressures brought on the environment by human beings in the process of economic and social development, including resource consumption, material consumption, and pollution emissions. State (S) represents the existing state after the impact of human activities on the environment, including natural ecology and the current situation of human life. Response (R) represents feedback from the environment, including human practices and remedial measures to reduce environmental loads. This model describes three basic issues: the causes of current changes, what changes are occurring, and how to respond to changes. Based on environmental pressures and existing conditions, humans decide how to take measures to reduce the pressure of economic activities on the environment, thereby improving the environment (Figure 2).
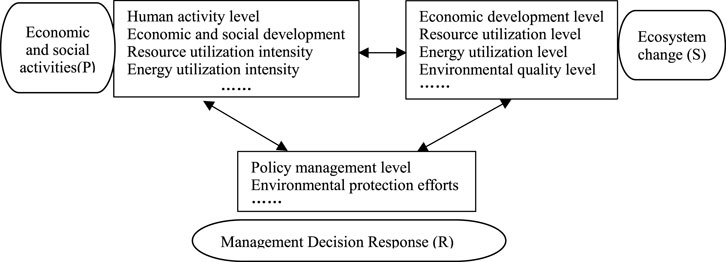
FIGURE 2. PSR model framework diagram.
In Figure 2, the level of human activity and economic and social development positively or negatively affect the level of economic development, while the intensity of resource and energy utilization positively or negatively affects the level of resource, energy utilization, and environmental quality. For positive impacts, the government can take complementary measures to coordinate and continuously improve policy management. For negative impacts, the government can adjust existing policies and improve the level of policy management.
The PSR model comprehensively summarizes the systematic process of urban green development. The premise of green development is development, but it emphasizes the development of harmonious coexistence between human beings and nature. Human economic and social development is bound to draw production factors from nature, while discharging pollutants and wastes, affecting the original natural environment and ecological balance. If human beings want to maintain better development, they will take various mitigation measures against the pressure on the ecological environment, so that the urban green development system forms a closed virtuous cycle system.
The indicators of the PSR model comprehensively reflect the entire system structure of urban green development. The pressure (P) reflects the negative impact of urban economic and social development on the natural environment and ecological balance, the state (S) reflects the current state of the natural environment and ecological balance, and the response (R) reflects various measures taken by humans to reduce the negative impact. This model comprehensively reflects the indicators at various levels in the simulation of urban green development, and constructs a relatively comprehensive urban green development system.
The PSR model puts urban green development within the framework of system science, deeply studying the interaction between human economic and social activities and the ecological environment from the perspective of system analysis, and providing a scientific and systematic research method for urban green development.
3.1.2 System boundary determination
According to the framework of the PSR model, the system boundary is determined, reflecting the effects of human activities on the natural environment and change strategies, including the stress subsystem, the state subsystem and the response subsystem.
3.1.2.1 Pressure subsystem
Various resource consumption, energy consumption, and pollutant emissions generated in the process of economic development are the direct causes of negative changes in the natural environment. This paper selects variables from the development and utilization intensity of various economic and social activities in the city, as well as the carrying capacity of the ecological environment to the economic and social development of the city. The electricity consumption of the whole society reflects the intensity of the development of resources and energy by economic and social activities. The industrial electricity consumption and domestic electricity consumption reflect the intensity of the development of resources and energy by industrial production and human life, as well as the discharge of industrial wastewater, industrial sulfur dioxide, industrial smoke and dust emissions reflect the carrying degree of the environment to the economic and social development of the city.
3.1.2.2 Status subsystem
Combined with the development status of resources and environment, variables such as forest coverage, green space area, comprehensive utilization rate of general industrial solid waste, centralized treatment rate of sewage treatment plants, harmless treatment rate of domestic waste, and unit energy consumption are selected to reflect the state of the natural environment.
3.1.2.3 Response subsystem
Various policies and measures taken to reduce the continuous deterioration of the ecological environment. Select variables such as general public budget revenue, general public budget expenditure, general public service investment, science and technology investment, environmental protection investment, the number of scientific research personnel, and the proportion of industrial GDP to reflect various policy measures.
3.1.3 Causal loop diagram
The Causal Loop Diagram (CLD) is constructed from the system framework, which intuitively expressing positive and negative causal loops within the system, and reflecting the causal relationship between various variables. A positive feedback loop indicates that if the cause increases, the result will be higher than previously achieved, and vice versa. A negative feedback loop indicates that if the cause increases, the result will be lower than previously achieved, and vice versa.
The increase of economic output, while meeting various material needs of mankind, consumes a large amount of resources and energy, increasing the bearing pressure on resources and the environment, and breaking the original balance of the ecosystem. Due to the characteristics of the current production mode of human beings and the promotion of scientific and technological forces, the consumption of resources and energy is bound to produce a large amount of pollution, which in turn affects the improvement of human living standards and sustainable development ability. Therefore, human beings urgently need to increase investment in science and technology and environmental protection that are biased towards energy conservation and emission reduction, reduce unit energy consumption and pollution emissions, and achieve a complete improvement in resources and the environment in a better direction (Figure 3).
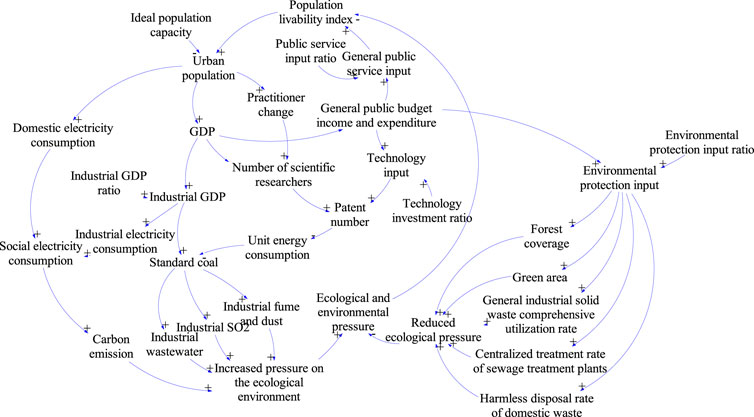
FIGURE 3. Causal loop diagram of green development in Chinese cities.
(1) Urban population→+ domestic electricity consumption→+ social electricity consumption →+ carbon emissions→+ ecological environment pressure→- livability index→- urban population
(2) Urban population→+ GDP→+ Industrial GDP→+ Industrial electricity consumption→+ Social electricity consumption→+ Carbon emissions→+ Ecological environment pressure→- Population livability index →- Urban population
(3) Urban population→+ GDP→+ Industrial GDP→+ Standard coal→+ Industrial wastewater emissions, industrial sulfur dioxide emissions, industrial smoke emissions→+ Ecological environmental pressure→- Population livability index→- Urban population
(4) Urban population→+ GDP→+ general public budget revenue and expenditure→+ general public service expenditure→+ livability index→+ urban population
(5) Urban population→+ GDP→+ general public budget revenue and expenditure→+ environmental protection investment→+ forest coverage rate, green space area, comprehensive utilization rate of general industrial solid waste, centralized treatment rate of sewage treatment plants, harmless treatment rate of domestic waste→- ecological environmental pressure→ + livability index→+ urban population
(6) Urban population→+ GDP→+ general public budget revenue and expenditure→+ science and technology investment→+ number of patents→- unit energy consumption→- standard coal→- industrial wastewater emissions, industrial sulfur dioxide emissions, industrial smoke emissions→- ecological environment pressure→+ livability index→+ urban population
(7) Urban population→+ GDP→+ Number of scientific research personnel→+ Number of patents→- Unit energy consumption→- Standard coal→- Industrial wastewater emissions, industrial sulfur dioxide emissions, industrial smoke emissions→- Ecological environmental pressure→+ Population livability index→+ Urban population
(8) Urban population→+ Changes in employees→+ Number of scientific research personnel→+ Number of patents→- Unit energy consumption→- Standard coal→- Industrial wastewater emissions, industrial sulfur dioxide emissions, industrial smoke emissions→- Ecological environmental pressure→+ Population livability index→+ Urban population
3.1.4 System dynamics flow diagram
The system dynamics flow diagram is a description of the properties of variables added to the causal loop diagram, including rate variables, state variables, auxiliary variables, and constants. The state variable represents the cumulative state, the rate variable represents the rate of increase or decrease, and the auxiliary variable represents the auxiliary description function relationship. According to the system dynamics causal loop diagram, use functions to express the relationship between variables, and draw a system dynamics flow diagram (Figure 4).
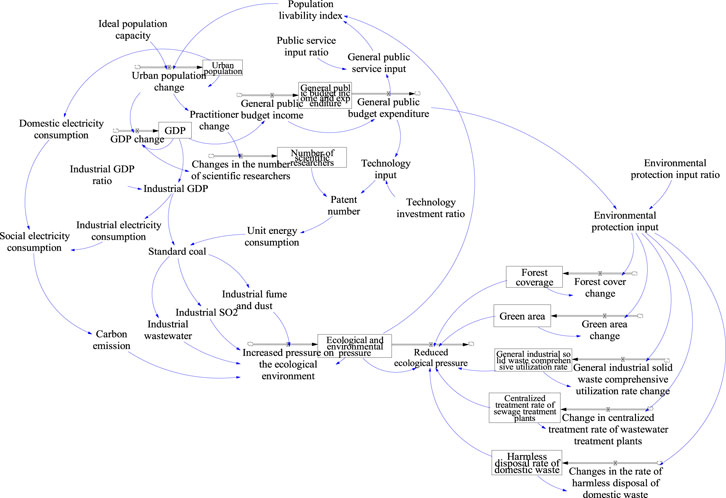
FIGURE 4. System dynamics flow diagram of urban green development.
3.2 Data
3.2.1 Data source
The main variable data of the paper are derived from the China Statistical Yearbook, China Urban Statistical Yearbook, relevant provincial and municipal statistical yearbooks and statistical bulletins, and the missing data in individual years is uniformly completed by using the data smoothing method.
3.2.2 Model equation
The modeling run time of the system dynamics model is 2010–2035, and the simulation step value is 1 year. Based on the base period of 2010, the data from 2010 to 2020 are used for fitting. The following main equations are written1:
(1) GDP = INETG (GDP * GDP growth rate, initial value)
(2) Urban population = INETG (urban population * population growth, initial value)
(3) General public budget revenue and expenditure = General public budget revenue - General public budget expenditure
(4) Science and technology investment = general public budget expenditure * proportion of science and technology investment
(5) Number of patents = a * Technology investment + b * Number of scientific research personnel
(6) Environmental protection investment = general public budget expenditure * proportion of environmental protection investment
(7) General public budget expenditure = c * General public budget revenue
(8) General public budget revenue = d * GDP
(9) Total social electricity consumption = industrial electricity consumption + domestic electricity consumption
(10) Industrial electricity consumption = e * Industrial GDP
(11) Domestic electricity consumption = f * urban population
(12) Standard coal = industrial GDP * unit energy consumption
(13) Unit energy consumption = g * (1 - h * patent number)
(14) Industrial GDP = Proportion of industrial GDP * GDP
(15) Industrial wastewater discharge = i * standard coal
(16) Industrial smoke emission = j * standard coal
(17) Industrial sulfur dioxide emissions = k * standard coal
(18) Carbon emissions = total social electricity consumption *l
(19) Ecological environment pressure = increased ecological environment pressure - decreased ecological environment pressure
(20) Ecological environmental pressure reduction = m * (comprehensive utilization rate of general industrial fixed waste/n + green area/o + forest coverage rate/p + centralized treatment rate of sewage treatment plants/q + harmless treatment rate of domestic waste/r) * Ecological environmental pressure
(21) Ecological environment pressure increase = m * (industrial sulfur dioxide emissions/s + industrial wastewater emissions/t + industrial smoke emissions/u + carbon emissions/v) * (1 - ecological environment pressure)
4 Results and discussion
4.1 Model inspection
Due to the large number of research cities, the overall scale, economic strength, development stage and administrative level of the city are different, the positioning and promotion process of green development are also different, resulting in differences in its ability to control resource allocation and resource utilization, If only a simple mean treatment is done on it, it is bound to ignore the heterogeneity of the city, cover up its differences, and the conclusions drawn are inevitably biased, even if a more rigorous empirical analysis is done, the guiding significance of the results is not strong. Taking into account comprehensively, this paper selects Guangzhou City, a coastal city in eastern China with strong economic strength, Wuhan City, a city along the river in central China with strong economic development stamina, and Urumqi City, a western inland city with better economic development advantages, as typical cities for in-depth research, and the three cities are representative to a certain extent, which is helpful to provide value reference for policy choices.
4.1.1 Operation inspection
The variables influencing green development are numerous and complex. In order to test the applicability of the model, select three different time steps of year, half year and quarter, three different time steps, select four key variables, including GDP, urban population, forest cover and concentrated treatment rate of sewage treatment plants for simulation. Figures 5–7 shows the simulation results of the four main variables in Guangzhou, Wuhan and Urumqi, the simulation results of the three time steps show the same development trend, and the values are very close, this also shows that the system dynamics model of the urban green development path constructed in this paper is not sensitive to step size. The system operation conforms to the actual situation, which has passed the test.
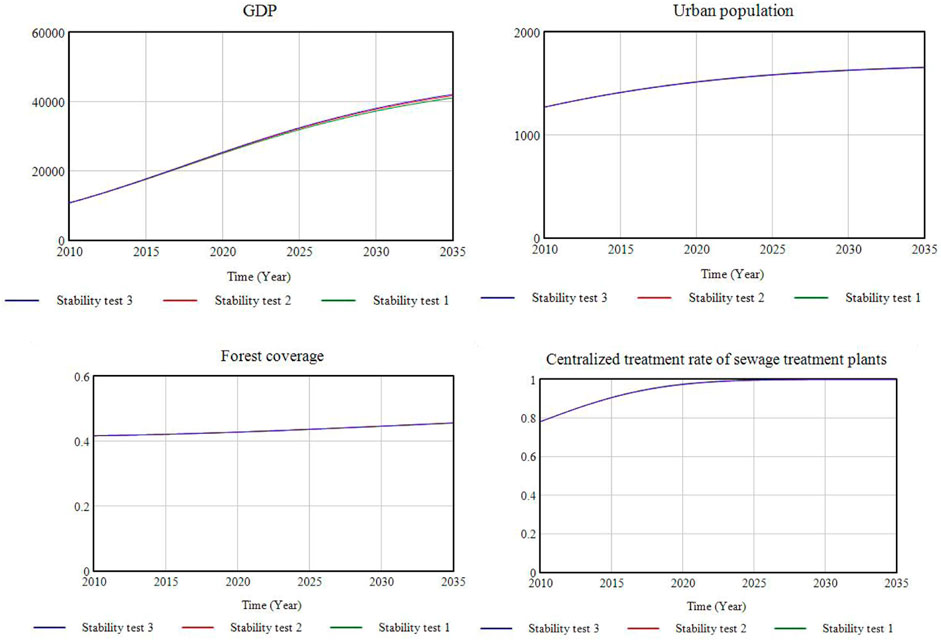
FIGURE 5. Simulation of main variables in Guangzhou.
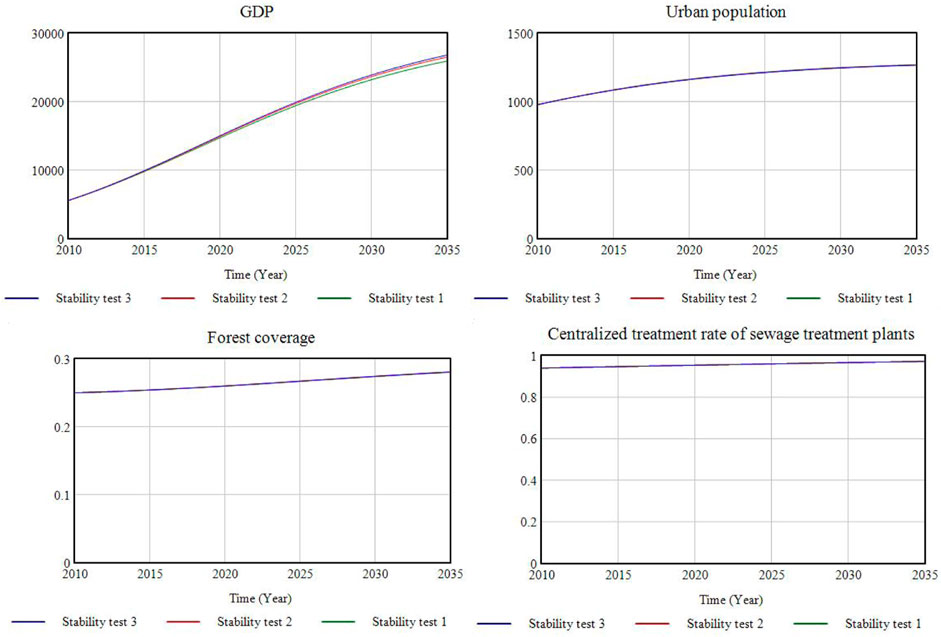
FIGURE 6. Simulation of main variables in Wuhan.
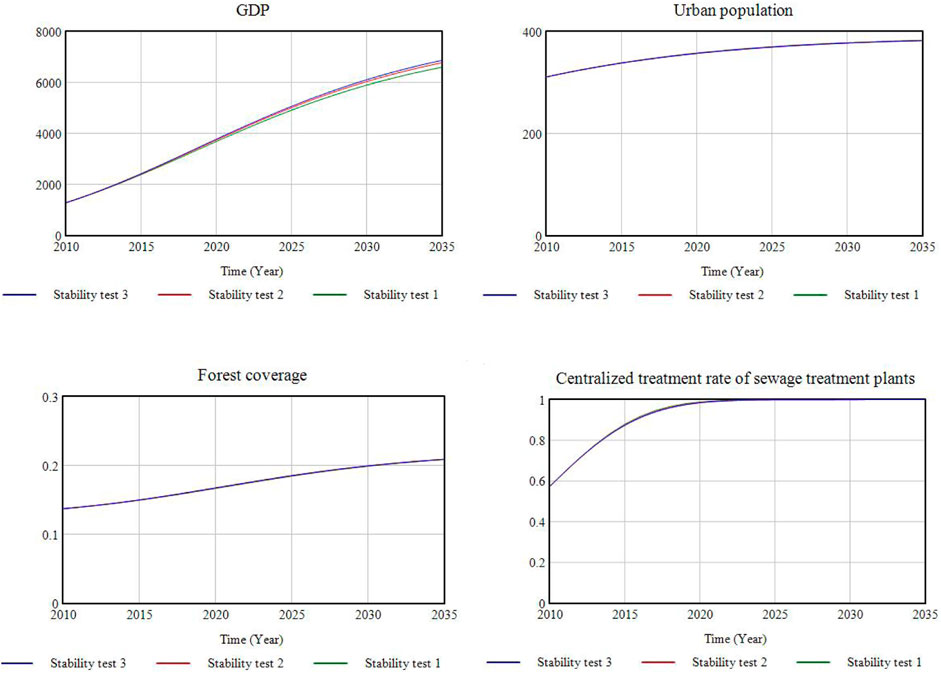
FIGURE 7. Simulation of main variables in Urumqi.
4.1.2 Historical inspection
In order to make the constructed model more scientific and reasonable, the paper further conducts historical testing, which is to compare the simulated value of the variable with the actual value, the error rate within plus or minus 20% is acceptable, within 10% indicates that the fit is good, and 5% indicates that the fit is very good (Liu et al., 2015). In this paper, four representative variables, including GDP, urban population, green space area and household waste harmless treatment rate, were selected for historical testing, and the test period was from 2010 to 2020.
Supplementary Appendix SA1 shows the historical data test error value of Guangzhou city, it can be seen that except for the error rate of 5.19% in 2013, the error rate of the GDP variable in other years is less than 5%, which indicates that the fitting accuracy of this variable is very good and passed the test. In 2020, the error rate of urban population variables was 23.4%, mainly due to the relatively developed economy of Guangzhou itself, the number and the scale of enterprises was large, there are more employment opportunities, and its policy effect of attracting population is prominent, coupled with the impact of the epidemic in 2020, other cities employment opportunities were frustrated, migrant workers increased, but the permanent population of Guangzhou increased by 3.43 million compared with the previous year, in addition, the fitting accuracy of other years is very high. The fitting accuracy of forest cover variables was very good. In 2013, the error rate of the centralized treatment rate of sewage treatment plants was 6.05%, in 2014, it was 11.49%, except for that, the fit in other years was very good. On the whole, the system was basically consistent with the actual situation in Guangzhou, the fitting accuracy of the model is relatively high, and it passes the test.
Supplementary Appendix SA2 shows the historical data test error values of Wuhan city. It can be seen that the error rate between the actual value and the simulated value of the GDP variable in each year is less than 20%, indicating that the fitting accuracy of the variable is acceptable. In 2020, the error rate of the urban population variable was 5.93%, the rest of the years were within 5%, indicating that the fitting accuracy was very good. The error rate of the forest cover variable fluctuated around 10% in most years, indicating that the fitting accuracy was relatively good. The error rate of the centralized treatment rate variable of sewage treatment plant was within 5% in all years, indicating that the fitting accuracy was very good. Overall, the system is basically consistent with the actual situation in Wuhan, the fitting accuracy of the model is relatively high, and it passes the test.
Supplementary Appendix SA3 shows the historical data test error values of Urumqi City. It can be seen that the error rate between the actual value and the simulated value of the GDP variable in 2012 is 10.55%, the rest of the years are within 10%, indicating that the fitting accuracy is very good. The error rate of urban population variables in 2020 was 13.13%, and the rest of the years were within 10%, indicating that the fitting accuracy was very good. The error rate of the forest cover variable fluctuated around 5%, indicating that the fitting accuracy was very good. In 2011, the error rate of the centralized treatment rate variable of sewage treatment plant was 19.02%, in 2012 it was 14.63%, and the rest of the years were within 10%, indicating that the fitting accuracy was relatively good. On the whole, the system is basically consistent with the actual situation of Urumqi, the fitting accuracy of the model is relatively high, and it passes the test.
In summary, the system constructed in the paper is basically consistent with the actual situation of the three cities, indicating that the fitting accuracy of the model is relatively high, and the next simulation can be carried out through the test.
4.2 Adjusting parameters and scenario settings
4.2.1 Adjusting parameters
Urban green development is a complex system, the rational and efficient input of factors require the promotion of science and technology, the reduction of pollution and waste also require the promotion of science and technology. Scientific and technological progress requires an increase in investment, but because the expected effect of scientific and technological investment is not achieved overnight, so it requires long-term continuous investment. The experience of developed countries has confirmed the role of scientific and technological investment in promoting green development. Chinese cities need to increase investment in science and technology for a long time, support technological innovation in energy conservation and emission reduction, and promote the efficient use of factors. The introduction of technology can also achieve scientific and technological progress, but because of its barriers, there will be unsatisfactory results. Therefore, the design of China’s urban green development path can consider increasing the proportion of science and technology investment, and the paper uses science and technology investment as the main adjustment parameter to simulate the path.
For a long time, the development of the secondary industry, especially industry, has promoted the prosperity and development of Chinese cities. However, a large amount of resources and energy consumption, as well as the generation of waste, have damaged the environment. The decrease in the proportion of the secondary industry and the increase in the proportion of the tertiary industry will make the factor input more reasonable and the output of waste will gradually decrease. Therefore, the design of China’s urban green development path can consider reducing the proportion of industry, and the paper uses structural adjustment as the main adjustment parameter to simulate the path.
The government should increase investment in environmental protection and proactively reduce the damage caused by pollution to the urban economy. For enterprises with good environmental awareness, the government encourages them in the form of tax exemptions and publicity reports to promote their “active energy conservation and emission reduction”. For enterprises with lack of environmental awareness, the government criticizes them in the form of administrative penalties and naming them to compel them to comply with the relevant standards. Make it produced and sold in accordance with green industry standards and technical requirements (Shen et al., 2023). Therefore, the design of China’s urban green development path can consider increasing the proportion of environmental protection investment, and the paper uses environmental protection investment as the main adjustment parameter to simulate the path.
The quantitative dividend of Chinese population is gradually declining, but the qualitative dividend of the population is gradually appearing. The number of people with university education per 100,000 people has increased from 8,930 in 2010 to 15,467 in 2020, which can be transformed into a technological driving force under certain conditions. Therefore, the paper does not simulate the path of labor input as a regulating parameter.
In summary, the paper selects scientific and technological investment, structural adjustment, and environmental protection investment as adjustment parameters. The transmission mechanism is that increasing scientific and technological investment helps to improve economic output, improve resource and energy utilization efficiency, reduce unit energy consumption, and then achieve the purpose of promoting green development; Structural adjustment helps to increase economic output, reduce the proportion of industry, optimize and upgrade the structure, and then achieve the purpose of promoting green development; The increase in environmental protection investment will help promote energy conservation and emission reduction, and then achieve the purpose of promoting green development.
4.2.2 Scenario settings
The scenario analysis mainly observes the variables according to the simulation objectives of the adjustment parameters, and then selects a relatively better development path through comprehensive evaluation, and puts forward relevant suggestions accordingly. Taking scientific and technological investment, structural adjustment and environmental protection investment as the adjustment parameters, taking innovation driven, structure driven and environment driven an driven modes, this paper constructs eight driving paths under three scenarios and simulates them.
Scenario 1: Baseline scenario. Taking the current level of scientific and technological investment, structural adjustment and environmental protection investment as a means of adjustment, including a path.
Scenario 2: Single factor driven scenario. Taking a single factor of scientific and technological investment, structural adjustment or environmental protection investment as a means of regulation, including three paths.
4.2.2.1 Innovation driven path
Taking scientific and technological investment as a means of adjustment, by increasing the level of scientific and technological investment, appropriately reducing the level of industrial structure and appropriately increasing the level of environmental protection investment, and examining its impact on the system, it is the development path of higher scientific and technological investment, moderate industrial structure, and moderate environmental protection investment.
4.2.2.2 Structure driven path
Taking structural adjustment as a means of adjustment, by reducing the proportion of industry, appropriately increasing the level of investment in science and technology, and appropriately increasing the level of investment in environmental protection, and examining its impact on the system, it is a development path for a lower industrial structure, moderate scientific and technological investment, and moderate environmental protection investment.
4.2.2.3 Environment driven path
Taking environmental protection investment as a means of adjustment, by increasing the level of environmental protection investment, appropriately increasing the level of scientific and technological investment, and appropriately reducing the level of industrial structure, and examining its impact on the system, it is the development path of higher environmental protection investment, moderate scientific and technological investment, and moderate industrial structure.
Scenario 3: Multi-factor driven scenario. Taking multiple factors such as scientific and technological investment, structural adjustment, and environmental protection as a means of adjustment, it includes four paths.
4.2.2.4 Innovation structure driven path
Taking the coordinated development of scientific and technological investment and structural adjustment as a means of adjustment, by significantly increasing the level of scientific and technological investment and significantly reducing the level of industrial structure, and examining the impact of the synergistic effect of scientific and technological investment and structural adjustment on the system, it is the development path for higher scientific and technological investment, higher structural adjustment, and moderate environmental protection investment.
4.2.2.5 Innovation environment driven path
Taking the coordinated development of scientific and technological investment and environmental protection investment as a means of adjustment, by significantly increasing the level of scientific and technological investment and environmental protection investment, and examining the impact of the synergistic effect of scientific and technological investment and environmental protection investment on the system, it is a development path for higher scientific and technological investment, higher environmental protection investment, and moderate industrial structure.
4.2.2.6 Environment structure driven path
Taking the coordinated development of environmental protection investment and structural adjustment as a means of adjustment, by significantly increasing the level of environmental protection investment and significantly reducing the level of industrial structure, and examining the impact of the synergistic effect of environmental protection investment and structural adjustment on the system, it is a development path for higher environmental protection investment, higher structural adjustment, and moderate scientific and technological investment.
4.2.2.7 Integreted driven path
Taking the coordinated development of scientific and technological investment, structural adjustment and environmental protection investment as a means of adjustment, by significantly increasing the level of scientific and technological investment, reducing the level of industrial structure, and increasing the level of environmental protection investment, and examining the impact of the synergistic effect of scientific and technological investment, structural adjustment, and environmental protection investment on the system, it is the development path for higher scientific and technological investment, higher structural adjustment, and higher environmental protection investment (Table 1).
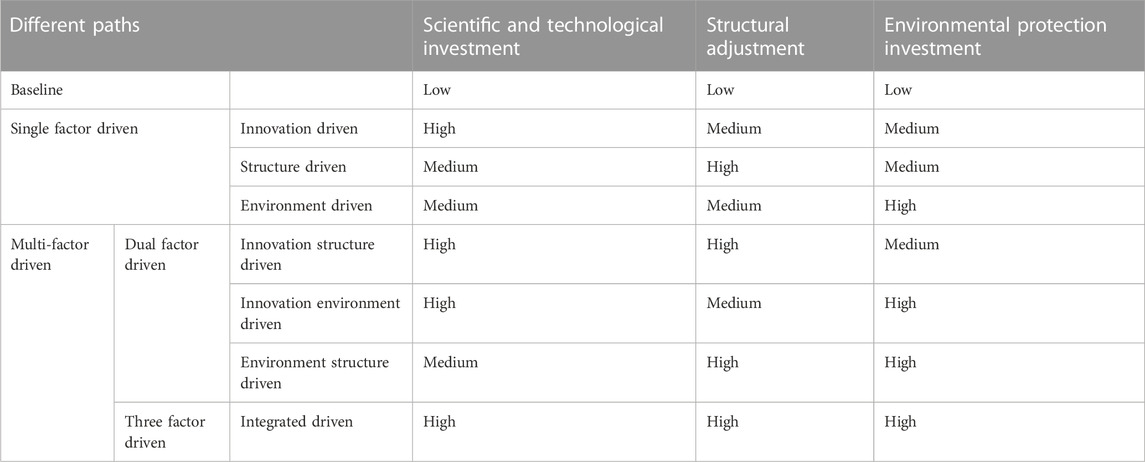
TABLE 1. Different path scenario settings.
4.2.3 Parameter setting
The Chinese government has always attached great importance to the development of science and technology, therefore, the government continuously increased its investment in science and technology. But it takes time for technology to translate into real productivity. The investment cycle of science and technology is long and the results are slow. Due to the constraints of various factors, small and medium-sized enterprises generally have low enthusiasm and initiative in science and technology investment. For this reason, the initia investment in science and technology should be mainly invested by the government, and it also needs the cooperation of government stimulus policies. Based on historical data on the proportion of scientific and technological investment in financial expenditure, and after debugging, the paper sets the current level of scientific and technological investment to 2% of financial expenditure. China clearly pointed out in the “14th Five Year Plan” that from 2021 to 2025, the average annual increase in R&D investment of the whole society is more than 7%. According to the current actual data, the article set under certain policy intervention, science and technology investment is 4% of fiscal expenditure, and strong policy intervention is 6%.
The development of urban industry has improved economic production capacity and output level, compared with the early stage of reform and opening up, the proportion of industry in GDP has declined, which also confirms the strong correlation between industrial development and economic growth. With the slowdown of China’s economic growth, the pace of industrial growth has slowed down. According to the historical data of the industrial structure, the article is debugged and set the industrial structure at the current level to 50% of the higher level, 40% under certain policy intervention, and 30% under strong policy intervention.
Environmental protection investment can effectively promote the process of green development of cities. According to the actual situation of fixed asset investment in urban municipal public facilities construction, the article is debugged and set the environmental protection investment at the current level to 10% of the lower level, 20% under certain policy intervention, and 30% under strong policy intervention (Table 2).
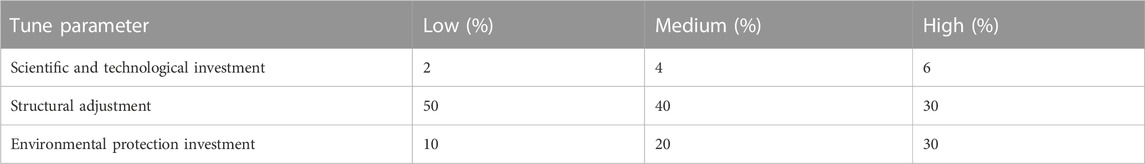
TABLE 2. Adjustment parameter settings.
4.3 Simulation and comparison of different paths
With the help of Vensim PLE software, This paper simulates the different paths of three typical cities in Guangzhou, Wuhan and Urumqi from 2020 to 2035, compares the dynamic changes of the pressure on the ecological environment, compares the future development trends under different scenarios, and compares the paths of three typical cities to realize green development, so as to provide a policy basis for Chinese cities to achieve green development.
Economic development and population gathering have brought about an increase in economic output, as well as brought about an increase in ecological environment pressure, which bringing challenges to green development. Chinese urban green development needs to pay attention to the sustained output of the economy, as well as the continuous reduction of ecological environment pressure. Due to the different pressures brought by certain economic outputs on the ecological environment, this paper compares the degree of green development in Guangzhou under different scenarios and paths, and the ecological environment pressure restricts the progress and duration of green development, so this indicator can characterize green development. Figure 8 is the simulation of different paths of the ecological environment pressure in Guangzhou, it can be seen that the ecological environment pressure under the eight driving paths shows a trend of decreasing year by year, but the magnitude of decline varies between different driving paths.
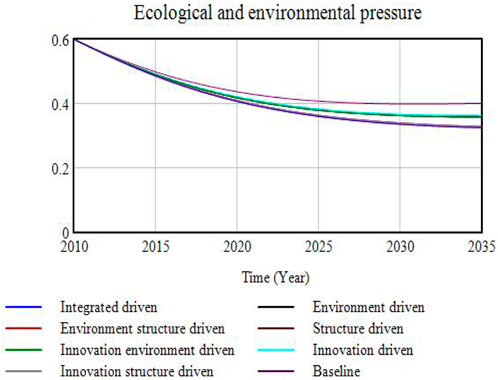
FIGURE 8. Simulation of different paths of the ecological environment pressure in Guangzhou.
Supplementary Appendix SA4 is the simulation results of ecological environment pressure in Guangzhou. It can be seen that all eight paths show a downward trend. But over time, the magnitude of the decline varies.
First of all, the ecological environment pressure under the baseline scenario shows a trend of first decreasing and then increasing, that is, according to the current level of 2% scientific and technological investment, 50% structural adjustment and 10% environmental protection investment, the ecological environment pressure can be reduced in the short term, but it cannot be sustained in the long term, and the prospects are not optimistic. The reason is that the investment in science and technology and environmental protection is low, which makes the enthusiasm of market players to carry out green innovation is not high. The industrial structure level is relatively high, so that the market entities have more factor inputs and waste output. In the end, the utilization rate of energy resources of market entities is low, the application of green technology and equipment is still insufficient, and the green transformation of production methods is still insufficient, which ultimately affects green development.
What’s more, under the single factor driven scenario, the pressure on the ecological environment shows a trend of decreasing year by year. That is, a major adjustment of one of Guangzhou’s current levels of investment in science and technology, structural adjustment or environmental protection, supplemented by appropriate adjustment of the other two, will help alleviate the pressure on the ecological environment. Compared with the path under the baseline scenario, the three driving paths in the single factor scenario have lower pressure on the ecological environment, which once again shows the need to appropriately adjust the current relevant policies in Guangzhou. In addition, the pressure of the three driven paths on the ecological environment shows differentiated results, the structure driven can reduce the pressure on the ecological environment, the environment driven is second, and the innovation driven is smaller, that is, the policy implementation effect of structural adjustment is more significant. Analyzing its internal reasons, on the one hand, as the economic center of southern China, Guangzhou has strong economic strength, larger industrial scale, more emissions per unit output value, coupled with a large population base and more energy demand, so appropriate adjustment of its industrial structure can significantly improve the ecological environment. On the other hand, economic development has accumulated certain funds for environmental protection and pollution control, but the flow of personnel, energy and goods is more frequent, which aggravates the environmental load and brings environmental pollution, even if the industrial technology structure continues to improve, but the speed of improvement is still slow. Comprehensive judgment shows that urban green development requires certain policy interventions, and the effects of different policies are slightly different, which confirms hypothesis 1, hypothesis 2 and hypothesis 3.
Finally, under the multi-factor driven scenario, the ecological and environmental pressure shows a trend of decreasing year by year, that is, two of the current scientific and technological investment, structural adjustment and environmental protection investment levels in Guangzhou are greatly adjusted, supplemented by appropriate adjustment of the other, which will help alleviate the ecological and environmental pressure. Compared with the paths under the baseline scenario, the four driven paths under the multi-factor driven scenario have lower pressure on the ecological environment, which once again indicates the need to adjust the current relevant policies in Guangzhou. Compared with the paths in the single factor driven scenario, the three paths in the multi-factor driven scenario have lower pressure on the ecological environment, indicating that the relevant policies are more conducive to alleviating the pressure on the ecological environment at the same time. But it should also be noted that the pressure of the innovation environment driven path on the ecological environment is higher than that of the structure driven path, that is, the large adjustment of Guangzhou’s industrial structure during this period has a greater impact on the ecological environment, and even exceeds the combined force of the other two policy adjustments.
The reason is that, on the one hand, Guangzhou continues to promote structural optimization and upgrading. Accelerate the empowerment and upgrading of advantageous and characteristic industries, and promote the green development of traditional advantageous industries such as automobiles, electronics, and petrochemicals. Build a “3 + 5+X”2 strategic new industrial system, and vigorously develop strategic emerging industries such as biomedicine and health, new generation information technology, intelligent and new energy vehicles, and digital creativity. On the other hand, Guangzhou strictly controls the total coal consumption, accelerates the promotion and use of natural gas, actively develops new and renewable energy, and optimizes the transportation structure. These measures help to vigorously link the ecological and environmental pressures. In addition, the comprehensive driven path has the least pressure on the ecological environment in the multi-factor driven scenario, indicating that the policies involved in this path are more comprehensive, multi-pronged and effective. Guangzhou has greatly increased the level of investment in science and technology, indicating that it is focusing on building a market-oriented green technology innovation system, strengthening energy conservation, reducing pollution and reducing consumption and efficiency, and achieving good results. Guangzhou has significantly increased the level of environmental protection investment, indicating that its command and control environmental regulation and economic incentive environmental regulation has achieved good results. Comprehensive judgment shows that urban green development requires a variety of policy portfolio interventions to achieve better policy effects, which confirms hypothesis 1, hypothesis 2 and hypothesis 3.
Based on the comprehensive judgment, the ecological environment pressure under the multi-factor driven scenario is superior to the single factor driven scenario, and then superior to the benchmark scenario. Among the eight paths, comprehensive drive is the optimal path, which takes into account the coordination of economic development and resources and environment. Specifically, it is manifested in the increase of economic output, the reduction of resource consumption, the improvement of environmental pollution, the transformation of economic growth from scale, speed and quantity priority to environmental protection, efficiency and quality priority. Guangzhou’s green development path can consider the comprehensive driven path of policy synergy such as science and technology investment, structural adjustment and environmental protection investment as the priority development path, which confirms hypothesis 1, hypothesis 2 and hypothesis 3.
Figure 9 shows the simulation of different paths of ecological environmental pressure in Wuhan and Urumqi, similar to Guangzhou, the ecological environmental pressure of the two cities decreases year by year under the eight driving paths, but the decline of different driving paths is different. Supplementary Appendixs SA5, SA6 show the simulation results of ecological environment pressure in Wuhan and Urumqi, and the multi-factor driven scenario of ecological environment pressure in the two cities is better than the single factor driven scenario and then better than the baseline scenario, and the comprehensive driven path is the optimal path.
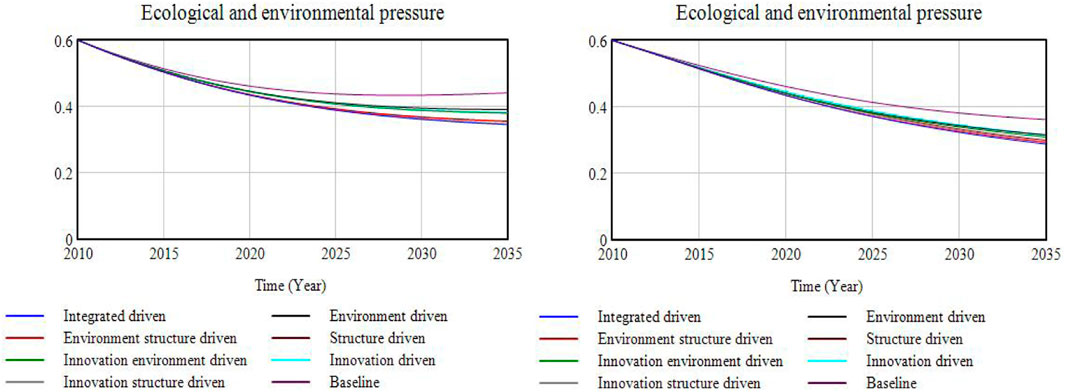
FIGURE 9. Simulation of different paths of ecological environment pressure in Wuhan and Urumqi.
The reason is that Wuhan strives to strengthen the R&D, manufacturing, industrialization and demonstration application of advanced green technologies and equipment, strives to build a modern industrial system, promote the green transformation of key industries and important fields, promote the high-end, intelligent and green transformation and upgrading of traditional industries such as steel, petrochemicals, building materials, and food, and vigorously develop green environmental protection pillar industries, strives to promote clean, low-carbon and efficient use of energy, strictly control coal consumption, and promote the application of solar photovoltaic power generation, strives to promote the construction of ecological and environmental protection think tanks. Urumqi strives to promote industrial green transformation and upgrading, and supports the R&D and production of environmental protection technology and equipment of enterprises, strives to optimize the structure of clean energy, classify the construction of wind power and photovoltaic power generation projects, and promote the energy storage industry and wind power hydrogen production pilots. Strictly control the total amount of coal consumption, encourage its efficient intensive and clean utilization, and promote key industries and key energy-using units such as iron and steel, building materials, petrochemicals, and chemicals to continue to carry out coal reduction, electricity instead of coal, and gas instead of coal. Strives to adjust the power supply structure and implement clean heating in winter.
In addition, in the single factor driven scenario, Wuhan’s structure driven path is better than the innovation driven path, and then better than the environment driven path, indicating that the adjustment of its industrial structure reduces the emission of sewage waste and significantly improves the ecological environment. The increase in investment in science and technology in the city, through the use of green technology and green technology, has significantly promoted the clean development of the economic structure. The structure driven path in Urumqi is better than the environment driven path, and then better than the innovation driven path, indicating that the industrial restructuring has significantly improved the ecological environment. Considering that Urumqi is in the process of industrialization, pollution emissions are still large, and it is necessary to improve the ecological environment with the help of the increase in environmental protection input. The pressure on the ecological environment of the innovation environment driven path in the multi-factor driven scenario of the two cities is higher than that of the structure driven path under the single factor driven scenario, indicating that their green development depends more on the adjustment of industrial structure (Supplementary Appendixs SA5, SA6), which reconfirms hypothesis 1, hypothesis 2 and hypothesis 3.
The above analysis shows that although the three cities of Guangzhou, Wuhan and Urumqi have different development foundations and development stages, the ecological environment pressures of the three cities have gradually decreased under three scenarios and eight paths, it indicating that the green development goals of Chinese cities in the future will definitely be achieved. The ecological environment pressure is highest under the baseline scenario, it indicating that policy intervention is necessary to promote green development. Due to the different development of cities themselves, the ecological environment pressure in the single factor driven scenario may be lower than that in the two factor driven scenario, it indicating that when a certain aspect of the city has a prominent problem, policy intervention can significantly reduce the ecological environment pressure. Therefore, urban green development path planning should respect its development reality and consider specific analysis of specific issues.
The ecological environment pressure under the multi-factor driven scenario is lower than that under the single factor driven scenario, it indicating that the promotion of green development requires policy coordination. The ecological environment pressure under the comprehensive driven path is the lowest, it indicating that the promotion of green development requires the coordination and cooperation of multiple policies to maximize the policy effect. This scenario takes into account the sustainable development of population, economy, resources and environment, while maintaining the increase in economic output, reducing environmental damage, improving environmental conditions, and helping cities achieve green development that focuses on quality, efficiency and appropriate scale.
In summary, in order to achieve the green development of Chinese cities, the government can consider increasing investment in science and technology, improving innovation driven policy effects, increasing the intensity of industrial restructuring, improving structure driven policy effects, increasing investment in environmental protection, and improving environment driven policy effects. The three policy effects work together, and the eventual realization of green development in Chinese cities can be realize soon.
5 Conclusion and recommendations
This paper constructs a theoretical model of the green development path of Chinese cities based on the “three forces” of pulling force, action force and propulsive force, and the “three driven” of innovation driven, structure driven and environment driven. According to the panel data of cities above the prefecture level in China from 2010 to 2020, based on the PSR model, this paper uses the analysis model of system dynamics to simulate the green development path of Chinese cities from 2021 to 2035. The results show that the pulling force formed by technological innovation, the action force formed by structural adjustment and the propulsive force formed by environmental regulation drive Chinese cities to achieve green development. Although the overall scale, economic strength, development stage and administrative level of Guangzhou, Wuhan and Urumqi are different, the simulation results indicate that the ecological environment pressure under the eight paths shows a gradual decline, moreover, the ecological environment pressure under the multi-factor driven scenario is lower than that in the single factor driven scenario. Based on the above conclusions, the following policy recommendations are put forward:
Firstly, the government considers adhering to the innovation drive and continuously increasing the level of innovation spillover. Due to the large investment, long cycle and slow effectiveness of technological research and development, the government needs to reduce the cost of technological innovation for enterprises through tax, subsidies, credit incentives, and other means. In view of the common characteristics of green technology innovation, it is possible to consider strengthening cooperation between cities and forming technological synergy. Because of the differences in urban development stages, cities in the eastern region have strengthened their research and development efforts in energy-saving and emission-reduction technologies to improve the utilization rate of clean energy. Cities in the central region are guided by green technology investment and continue to reduce pollution emissions. Cities in the western region have strengthened investment in science and technology, encouraged technological transformation of enterprises in the production process, and realized the recycling of sewage waste. When green and high-quality foreign-funded enterprises settle in, the government considers giving preferential policies to stimulate the spillover effect of green technologies and force local enterprises to innovate and develop.
Secondly, the government considers adhering to structural drive and continuously achieving low-carbon energy transformation. The government guides enterprises to gradually reduce the proportion of urban fossil energy consumption and improve energy utilization. Connecting cities and reducing the frequency of energy use. Increase production and consumption of green products. Considering the differences in urban development stages, cities in the eastern region have increased the proportion of green electricity and promoted low-carbon energy. Cities in the central region are considering promoting a clean transformation of industrial structures. Cities in the western region are considering green transformation of traditional industries and actively developing strategic emerging industries. Due to the influence of resource endowments, resource-based cities consider gradually reducing resource dependence, actively relying on energy-saving biased technological progress, empowering more industries and forming a green industry development pattern. Resource-scarce cities should cultivate and expand green industries and continuously improve their competitiveness.
Thirdly, the government considers adhering to the environmental protection drive and continuously strengthening environmental protection efforts. The government has formulated and taken the lead in completing various environmental regulatory measures, and the focus of environmental protection investment is tilted towards the resource recycling and recycling industry, the Internet of Things + environmental protection industry, and the gas, water, soil and solid waste treatment industry. Considering the differences in urban development stages, cities in the eastern region should strictly implement command-and-control environmental regulation policies, improve the enforcement of environmental regulations, and strive to effectively curb pollutant emissions from the source. At the same time, economic incentives-based environmental regulation policies are adopted to optimize the proportion of factor input and promote the development of high-tech industries. Cities in the central region mainly adopt command-and-control environmental regulation policies, strictly follow environmental protection standards and norms for production, increase government investment and supervision in environmental governance, and strictly screen foreign investment. Cities in the western region have increased investment in environmental pollution, and encouraged them to effectively reduce pollution discharge levels through taxes and subsidies.
At last, the government considers a combination of strategies to continuously reduce environmental pressures. Although the baseline scenario can reduce the pressure on the ecological environment, it still needs to consume certain resources and energy and produce pollution. Single factor driven scenarios can reduce ecological pressures, but their effect is limited. Multi-factor driven scenarios can reduce ecological pressures, but the implementation effect is different. The comprehensive driving path has the lowest ecological and environmental pressure, which takes into account the coordinated development of economy, society and resources and environment, ensures economic output while reducing unit energy consumption, curbing environmental pollution, and helping to promote green development. Therefore, the green development of Chinese cities needs to increase investment in science and technology, guide all entities to develop in the direction of resource conservation and pollution reduction, adjust the industrial structure, promote their development in the direction of cleanliness, increase environmental protection investment, standardize the development of all entities in the direction of environmental protection, and give full play to the synergy of the three major policies to achieve green development.
6 Shortcomings and prospects
The research on urban green development involves multi-theories, multi-disciplines and multi-fields, and in view of my theoretical level and time, the paper still has certain deficiencies, which is also the focus of future research. First of all, the promotion of green development is a complex system engineering, there are many cities in China, the development stage and level of cities are not the same, the paper theoretically deducts the driven mechanism of green development path, but it may not be suitable for specific cities with large differences, different development stages and outstanding characteristics. Therefore, in the future, it is considered to optimize the research method and further study the driving force and driving mechanism of cities with different characteristics. What’s more, the sample of this study mainly examines cities at the prefecture level and above, and selects three typical cities for simulation of green development paths, without taking into account the differences under different administrative divisions. In fact, different administrative divisions of cities will have different abilities to allocate and utilize resources. Therefore, in the future, consider dividing the city into different tiers to find a more realistic optimization path. At last, with the advent of the digital economy and the “Internet +” era, more and more cities use modern technology to build smart cities through information technologies such as the Internet of Things and cloud computing, and consider including them in the research in the future to realize the research of urban green development path with the times.
Data availability statement
The raw data supporting the conclusion of this article will be made available by the authors, without undue reservation.
Author contributions
All authors listed have made a substantial, direct, and intellectual contribution to the work and approved it for publication.
Funding
National Natural Science Foundation project “The impact of environmental regulations on the balanced development of China’s economy: a study based on the perspective of regions, industries, and urban and rural areas” (71964032).
Conflict of interest
The authors declare that the research was conducted in the absence of any commercial or financial relationships that could be construed as a potential conflict of interest.
Publisher’s note
All claims expressed in this article are solely those of the authors and do not necessarily represent those of their affiliated organizations, or those of the publisher, the editors and the reviewers. Any product that may be evaluated in this article, or claim that may be made by its manufacturer, is not guaranteed or endorsed by the publisher.
Supplementary material
The Supplementary Material for this article can be found online at: https://www.frontiersin.org/articles/10.3389/fenvs.2023.1198817/full#supplementary-material
Footnotes
1in the equations, a, b, v, are the fitting coefficients of variables.
2“3 + 5+X”: 3 refers to emerging pillar industries, namely, the new generation of information technology, intelligent and new energy vehicles, biomedicine and health industries. 5 refers to emerging advantageous industries, namely, intelligent equipment and robots, rail transit, new energy and energy conservation and environmental protection, new materials and fine chemicals, and digital creative industries; X refers to the industry of the future.
References
Carter, R., and Culp, S. (2010). Planning for climate change in the west. Cambridge, M. A.: Lincoln Institute of Land Policy, 113–125.
Chen, F., Li, Y. H., Yu, Y. T., and Shen, S. F. (2023). The effects and mechanism of resource consumption on the level of urban green development——a case study of shanghai. Soft Sci. (4), 136–144.
Deng, Y. J., Zhang, C. R., and Yuan, H. (2012). The mechanism of ecological capital operation: An analytical framework based on green development. China Popul. Resourses Environ. (4), 19–24.
Feng, J. F. (2017). Innovation driving mechanism of green development in China from the perspective of ecological welfare performance. Southeast University, 68–72.
Feng, K., and Jia, L. Y. (2016). Development direction and policy focus of green urbanization in China. Econ. Rev. (7), 27–32.
Fu, J. P. (2019). A study of the efficiency measurement and realization mechanism on the green transformation of coastal urban agglomerations. Dalian University of Technology, 121–128.
Guo, B. H. (2023). Research on the evolution, theoretical logic and practical path of China's green development under the goal of carbon peak and carbon neutralization. China Price (8), 12–19.
Hu, A. G., and Zhou, S. J. (2014). Green development: Functional definition, mechanism analysis and development strategy. China Popul. Resourses Environ. (1), 14–20.
Hu, S. L., Bao, H., Han, J., and Zeng, G. (2022). Research on the impact of environmental regulation on urban green development in the Yangtze River Delta: An analysis of intermediary mechanism based on technological innovation. J. Nat. Resour. 37 (6), 1572–1585. doi:10.31497/zrzyxb.20220614
Huang, Z. B., and Lou, B. H. (2023). Green transformation of development mode: Logical necessity, core, meaning and practical path. Jiang-huai Tribune., 5–13.2.
Kenworthy, J. (2006). The eco-city: Ten key transport and planning dimensions for sustainable city development. Environment and Urbanization, 67–85.1.
Kim, S. E., Kim, H., and Yeara, C. (2014). A new approach to measuring green growth: Application to the OECD and korea. Futures 63 (11), 37–48. doi:10.1016/j.futures.2014.08.002
Kuznets, S. (1971). Economic growth of nations: Total output and production structure. Cambridge: Belknap Press of Harvard University Press, 78–102.
Li, Z. J., and Sheng, S. H. (2014). Establishing an ecological civilization system to promote the process of green urbanization. Econ. Rev. (1), 39–43.
Liang, Q. L., Pan, X. C., and He, W. J. (2023). Mechanisms, pathways and countermeasures of carbon market impact on urban green development. Urban Development Studies, 104–112.6
Liu, S., G., Yang, B. J., and Song, L. (2022). Study on the influence mechanism of innovative cities pilot policy on green development in China. Soft Sci. (6), 1–12.
Liu, X., Ma, S. F., Tian, J., Jia, N., and Li, G. (2015). A system dynamics approach to scenario analysis for urban passenger transport energy consumption and CO2 emission: A case study of beijing. Energy Policy 85 (8), 253–270. doi:10.1016/j.enpol.2015.06.007
Murray, G. (2000). Effects of a green purchasing strategy: The case of belfast city council. Supply Chain Manag. 5 (1), 37–44. doi:10.1108/13598540010312954
Shen, X. Y., Pang, G. Q., and Ge, T. (2023). Does energy intensity target promote energy saving and consumption reduction? Soc. Sci. (3), 121–133.
Song, D., Song, P., and Chen, Z. (2020). The technological path choice of China’s industrial green transformation under environmental regulation: Indepent innavation or technology outsouring? Commer. Res. (2), 101–110.
Timmer, M., and Szirmai, A. (2000). Productivity growth in asian manufacturing: The structural bonus hypothesis examined. Struct. Change & Econ. Dyn. 11 (4), 371–392. doi:10.1016/s0954-349x(00)00023-0
Wang, H. R., Liu, Y. X., Li, Y., and Li, Y. K. (2023). The implementation path of green development and high-quality development of watershed eco-city under carbon peaking and carbon neutrality goals. Water Resources Protection, 1–12.4.
Wang, Y. (2021). Research on the influence mechanism of command-and-control and market-incentive environmental policies on economic green developmen, 36. Jilin University.
Wei, H. K. (2012). Taking the road of three modernizations coordination under double acceleration. Econ. J. (1), 1–2.
Xue, Y. W., and Zhang, N. (2023). Research on the transmission mechanism of the impact of environmental regulations on the green development of resource-based cities under multiple heterogeneity. J. China Univ. Petroleum Ed. Soc. Sci. (3), 18–26.
Yu, S. Q. (2018). Research on the realization mechanism of China’s green development under the perspective of the capital logic’s criticism. East China University of Science and Technology, 50–65.
Zhang, G. S. (2018). Green urbanization in China: Framework and path selection. J. Harbin Inst. Technol. Soc. Sci. Ed. (3), 123–131.
Zhang, J., and Fan, Y. T. (2023). Green development of innovative cities: Efficiency measurement, network externalities, and improvement paths. China Popul. Resourses Environ. (2), 102–112.
Zhao, X., and Wei, X. B. (2023). Effect and mechanism of digital economy empowering regional green development——based on the mesomeric effect of technological innovation and industrial upgrading. J. Southwest Univ. Nat. Sci. (8), 21–30.
Keywords: city, driven force, green development, path selection, scenario simulation
Citation: Xisha W and Jinye L (2023) The driving mechanism and path selection of green development in Chinese cities. Front. Environ. Sci. 11:1198817. doi: 10.3389/fenvs.2023.1198817
Received: 02 April 2023; Accepted: 15 August 2023;
Published: 31 August 2023.
Edited by:
Shazia Rehman, Central South University, ChinaCopyright © 2023 Xisha and Jinye. This is an open-access article distributed under the terms of the Creative Commons Attribution License (CC BY). The use, distribution or reproduction in other forums is permitted, provided the original author(s) and the copyright owner(s) are credited and that the original publication in this journal is cited, in accordance with accepted academic practice. No use, distribution or reproduction is permitted which does not comply with these terms.
*Correspondence: Wang Xisha, 375861210@qq.com; Li Jinye, 365954452@qq.com