Politics
Visualizing 200 Years of Systems of Government

Visualizing 200 Years of Systems of Government
Centuries ago, most of our ancestors were living under a different political paradigm.
Although democracy was starting to show signs of growth in some parts of the world, it was more of an idea, rather than an established or accepted system of government.
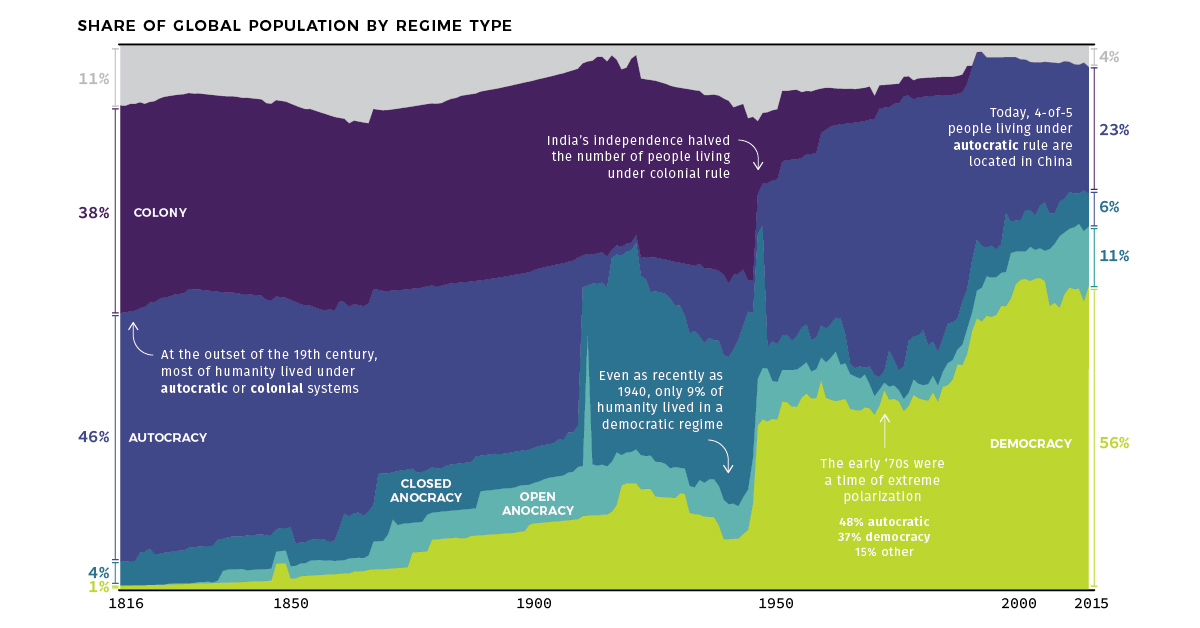
Even at the start of the 19th century, for example, it’s estimated that the vast majority of the global population — roughly 84% of all people — still lived under in autocratic regimes or colonies that lacked the authority to self-govern their own affairs.
The Evolution of Rule
Today’s set of charts look at global governance, and how it’s evolved over the last two centuries of human history.
Leveraging data from the widely-used Polity IV data set on political regimes, as well as the work done by economist Max Roser through Our World in Data, we’ve plotted an empirical view of how people are governed.
Specifically, our charts break down the global population by how they are governed (in absolute terms), as well as by the relative share of population living under those same systems of government (percentage terms).
Classifying Systems of Government
The Polity IV data series defines a state’s level of democracy by ranking it on several metrics, such as competitive and open elections, political participation, and checks on authority.
Polity scores are on a -10 to +10 scale, where the lower end (-10 to -6) corresponds with autocracies and the upper end (+6 to +10) corresponds to democracies. Below are five types of government that can be derived from the scale, and that are shown in the visualization.
- Colony
A territory under the political control of another country, and/or occupied by settlers from that country.
Examples: 🇬🇮 Gibraltar, 🇬🇺 Guam, 🇵🇫 French Polynesia - Autocracy
A single person (the autocrat) possesses supreme and absolute power.
Examples: 🇨🇳 China, 🇸🇦 Saudi Arabia, 🇰🇵 North Korea - Closed Anocracy
An anocracy is loosely defined as a regime that mixes democratic and autocratic features. In a closed anocracy, political competitors are drawn only from an elite and well-connected pool.
Examples: 🇹🇭 Thailand, 🇲🇦 Morocco, 🇸🇬 Singapore - Open Anocracy
Similar to a closed anocracy, an open anocracy draws political competitors from beyond elite groups.
Examples: 🇷🇺 Russia, 🇲🇾 Malaysia, 🇧🇩 Bangladesh - Democracy
Citizens exercise power by voting for their leaders in elections.
Examples: 🇺🇸 United States, 🇩🇪 Germany, 🇮🇳 India
A Long-Term Trend in Question
In the early 19th century, less than 1% of the global population could be found in democracies.
In more recent decades, however, the dominoes have fallen — and today, it’s estimated that 56% of the world population lives in societies that can be considered democratic, at least according to the Polity IV data series highlighted above.
While there are questions regarding a recent decline in freedom around the world, it’s worth considering that democratic governance is still a relatively new tradition within a much broader historical context.
Will the long-term trend of democracy prevail, or are the more recent indications of populism a sign of reversion?


Public Opinion
Charted: How Democrats and Republicans View Government Agencies
Predictably, results diverge when both Democrats and Republicans are asked to rate key government agencies in the United States.

How Democrats and Republicans View Government Agencies
This was originally posted on our Voronoi app. Download the app for free on iOS or Android and discover incredible data-driven charts from a variety of trusted sources.
Forget the presidential race, the partisan divide in America can also be seen by how Democrats and Republicans feel about key government agencies.
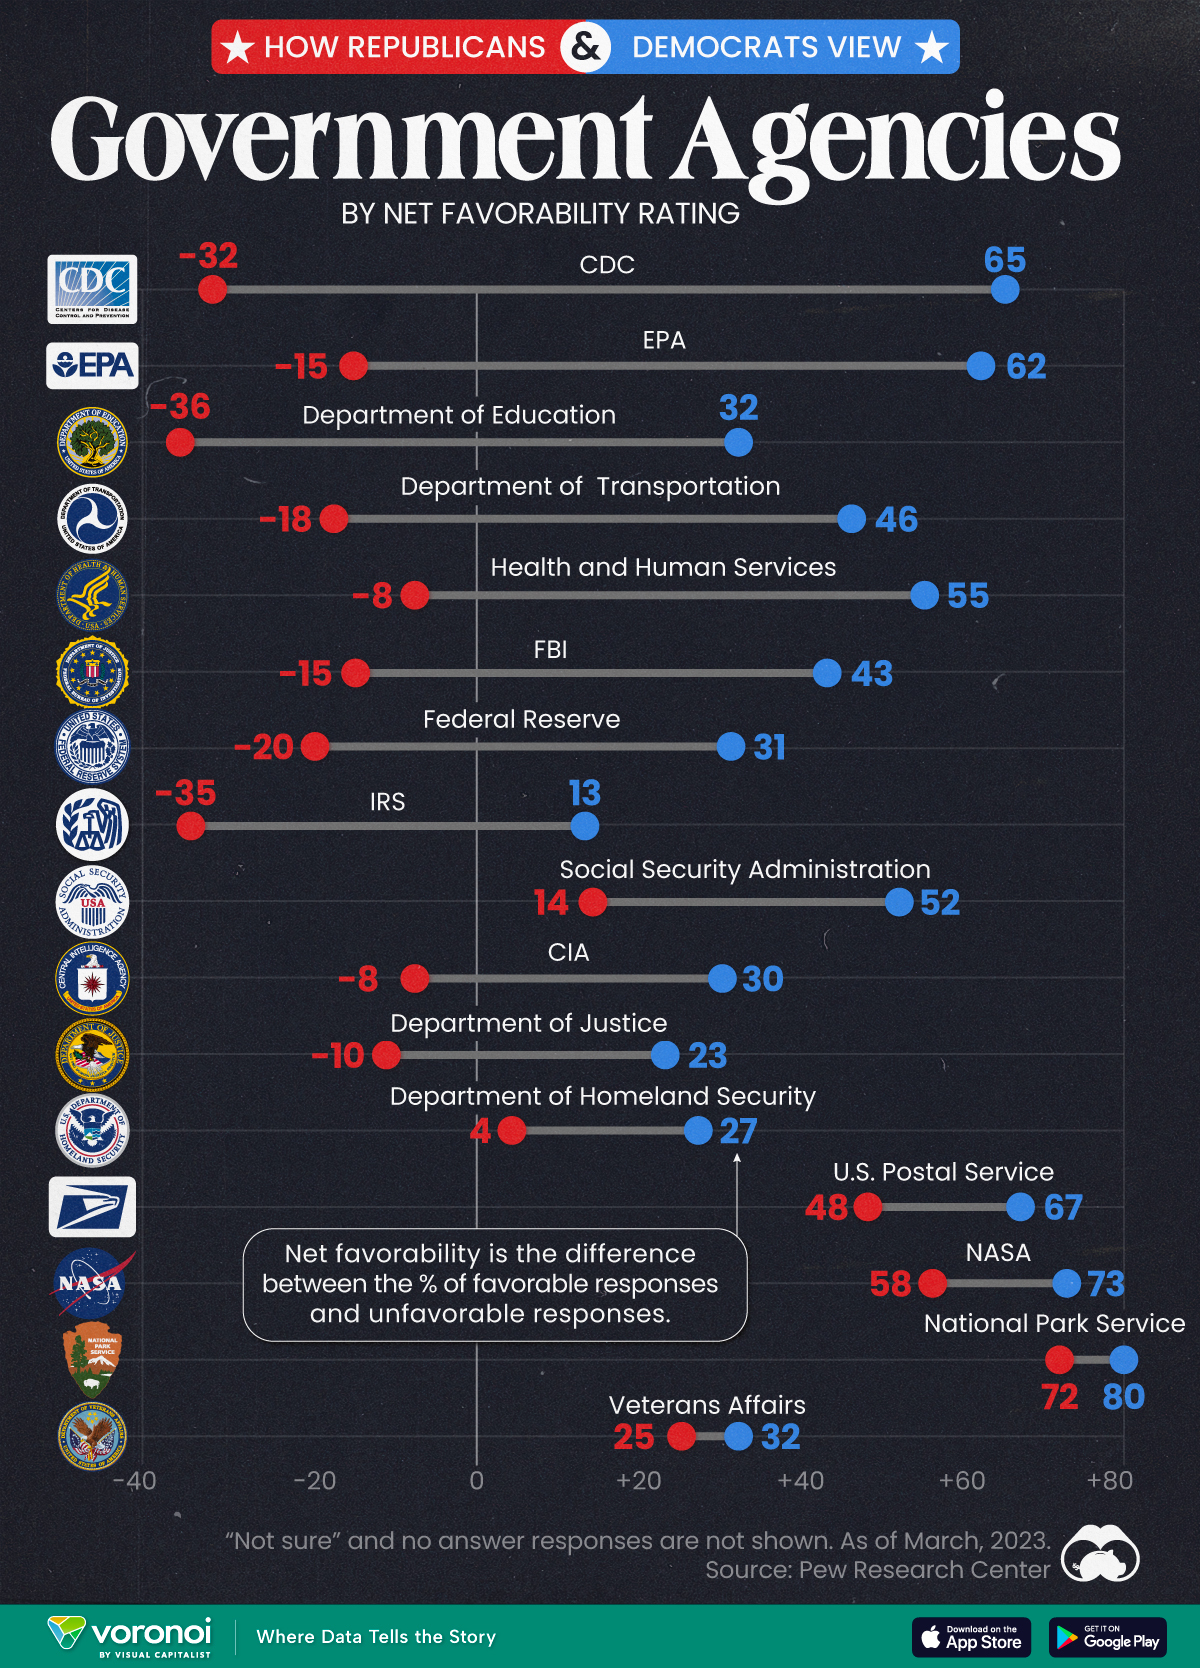
We visualize the net favorability ratings of 16 federal government agencies, based on respondent party affiliation.
To find this data, Pew Research Center surveyed more than 10,000 adults, between March 13-19, 2023. View their methodology page for more details about the survey, the questions asked, and the results obtained.
Republicans Don’t Like How the CDC Handled the Pandemic
The division in net favorability is deepest for three federal government agencies. While the CDC garnered a net favorability rating of 65 from Democrats, more Republicans rated the agency unfavorably, leading to a net favorability rating of -32.
Similarly, with the EPA and the Department of Education, the difference in net favorability between the two voting sides is as high as 70–80 points.
| Federal Agency | Republican Net Favorability Rating | Democrat Net Favorability Rating |
|---|---|---|
| 🔬 CDC | -32 | 65 |
| 🌿 EPA | -15 | 62 |
| 📚 Department of Education | -36 | 32 |
| 🚗 Department of Transportation | -18 | 46 |
| 💉 Health and Humans Services | -8 | 55 |
| 💰 Federal Reserve* | -20 | 31 |
| 🕵️ FBI | -15 | 43 |
| 💼 IRS | -35 | 13 |
| 💼 Social Security Admin | 14 | 52 |
| 🕵️♂️ CIA | -8 | 30 |
| ⚖️ Justice Department | -10 | 23 |
| 🛡️ Homeland Security | 4 | 27 |
| 📮 USPS | 48 | 67 |
| 🚀 NASA | 58 | 73 |
| 🏞️ Park Service | 72 | 80 |
| 🎖️ Veterans Affairs | 25 | 32 |
Note: *The Federal Reserve is considered an instrument of the federal government but does not receive funding from it. However, it is not a private entity either, despite sharing certain characteristics with one. Figures are rounded. No answer responses are not shown.
Pew Research Center notes that Republicans didn’t always view the CDC quite so unfavorably, though a direct comparison is impossible.
Nevertheless, per the source, in March 2020, 84% of surveyed Republicans expressed positive views of the CDC’s performance. By October 2022, just 32% said the CDC had done an excellent or good job of handling the pandemic.
Meanwhile, there are a few agencies the two sides do agree on: the National Park Service, the Postal Service, and NASA.
And they both agree on Veterans Affairs as well: though neither share a particularly high opinion of the organization.
Finally, Democrats consistently rate all sixteen agencies on the survey more favorably than Republicans, showing consistency about how each side views the government in general.

-

 Public Opinion6 days ago
Charted: How Americans Feel About Federal Government Agencies
-

 Healthcare2 weeks ago
What Causes Preventable Child Deaths?
-

 Energy2 weeks ago
Who’s Building the Most Solar Energy?
-

 Markets2 weeks ago
Mapped: The Most Valuable Company in Each Southeast Asian Country
-

 Technology1 week ago
Mapped: The Number of AI Startups By Country
-

 Healthcare1 week ago
Life Expectancy by Region (1950-2050F)
-

 Markets1 week ago
The Growth of a $1,000 Equity Investment, by Stock Market
-

 Markets1 week ago
Mapped: Europe’s GDP Per Capita, by Country