(Related posts: Urban, suburban or rural? Americans’ perceptions of their own community type differ by party and Measuring community type in Europe, from big cities to country villages)
The 2016 U.S. presidential election highlighted the stark divide between America’s urban and rural communities. It also led many researchers (ourselves included) to try to learn more about how the type of community Americans live in might relate to their attitudes and political behaviors.
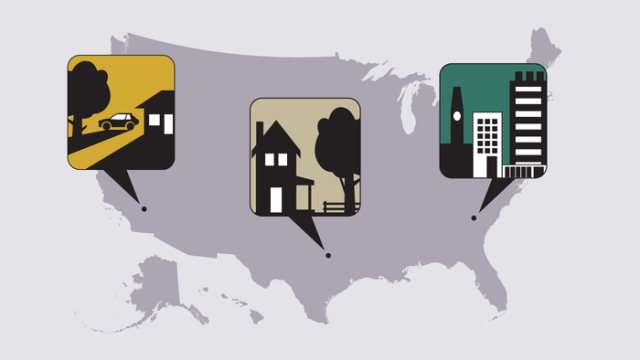
In order to explore a question like this, researchers first need to understand exactly what “community type” means, especially since there are different ways to assess whether an area is urban, suburban or rural. In this post, we’ll explore three measures of U.S. community type and compare them to a more subjective method of finding out: simply asking Americans what kind of community they live in.
On the whole, we find that outside measures generally correspond well with how people describe their own location. But using self-reported information has its own advantages, particularly in cases where the delineation between different community types — such as urban and suburban ones — may not be clear.

Background
In a 2018 Pew Research Center survey, a quarter of Americans said they live in an urban community, while 43% said they live in a suburban area and three-in-ten said they live in a rural area.

While doing background research for this study, we wanted to know if there were any objective measures — like government classifications, the density of where people live or their distance from a city center — that could help us move beyond self-reported community type.
We ended up selecting three outside measures — two from the U.S. government and one based on ZIP code characteristics — and compared them to our survey data. Below, we’ll explore how each of these measures stacked up against our survey respondents’ own assessments.
Government measure #1: National Center for Health Studies Urban-Rural Classification Scheme
The National Center for Health Statistics (NCHS) of the Centers for Disease Control and Prevention publishes the Urban-Rural Classification Scheme for Counties.
The NCHS first classifies counties based on whether they are in a metropolitan or micropolitan area (or neither), as defined by the Office of Management and Budget. Counties within metropolitan areas are then further classified by the size of the metropolitan area. Small metro counties are those with fewer than 250,000 people and medium metro counties are those with 250,000 to 999,999 people. The distinguishing feature of the NCHS classification scheme is that large metro counties — those of 1 million or more — are classified into either “central” or “fringe” metro counties. Large “central” metro counties are those in a large metro area that contain all of or a significant portion of the principal city of the metro area. Large “fringe” metro counties are all other counties in large metro areas.
Overall, the NCHS scheme consists of six different categories: large central metro, large fringe metro, medium metro, small metro and non-core. This metric was primarily created to track health outcomes. For example, the NCHS notes that health outcomes often differ most between residents of large fringe metro counties (akin to suburbs) and those in non-metropolitan (either micropolitan or non-core) counties.
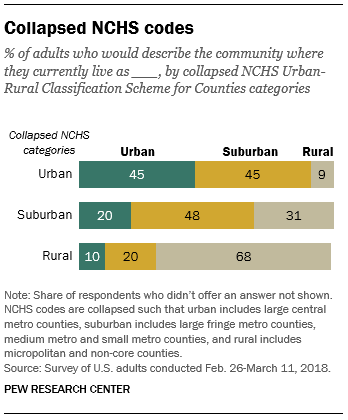
On the whole, the NCHS measure of community type mapped well onto the self-reported community designations we discovered through our survey. Nearly half (45%) of people who live in an NCHS-designated large central metro area also said in our survey that they live in an urban area. The NCHS proved even more accurate on the other end of the spectrum, with 78% of people who live in an NCHS designated non-core county saying they live in a rural area.

When we collapsed the six-category NCHS scheme into urban, suburban and rural, the measure performed particularly well with rural areas. Around two-thirds (68%) of people who were designated as living in a rural area based on the collapsed NCHS measure also said they live in a rural area. Fewer suburban residents classified themselves as suburban (48%) and urban residents classified themselves as urban (45%).
Government measure #2: U.S. Department of Agriculture Economic Research Service’s Rural-Urban Continuum County Classification
Another U.S. government measure we consulted was the U.S. Department of Agriculture Economic Research Service’s (ERS) Rural-Urban Continuum Codes (RUCC). These codes divide metropolitan counties by the size of the metro area (similar to the NCHS classification) while also classifying non-metropolitan counties by the degree of urbanization.
Specifically, counties in metro areas are classified by one of three population sizes of the metro area they are part of: fewer than 250,000, between 250,000 and 999,999, or 1 million or more. The distinguishing feature of this classification scheme is that non-metropolitan counties are classified by the number of people living in a Census Bureau-defined urban area: fewer than 2,500, between 2,500 and 19,999, and 20,000 or more. ERS notes that dividing non-metro counties by the size of the urban population allows for finer analysis of trends affecting non-metro areas.
Similar to the NCHS, this government measure generally mapped nicely onto self-reported community type. Overall, eight-in-ten respondents who were classified as living in a non-metro area with a population of less than 2,500 said in our survey that they live in a rural area.

Here, again, we collapsed the six Rural-Urban Continuum Codes into urban, suburban and rural to compare with self-reported community type. Similar to the NCHS measure, the RUCC codes classified rural Americans with a high degree of accuracy. A total of 68% of those classified as living in a rural area also said they live in a rural community, while 42% of those classified as living in a suburban area said they live in a suburban community.

This coding scheme slightly underperformed when it came to accurately classifying those in urban areas. Only about a third (32%) of those classified as living in an urban area — counties in a metro area with a population of 1 million or more — said they live in an urban community.
ZIP code measure
In addition to county-level metrics available from government sources, we wanted to see if we could better understand community type by looking at smaller geographical areas. Specifically, we wanted to look at the ZIP codes where our survey respondents live to see whether the characteristics of the area matched their self-description.
We assessed this using two factors as inputs — the distance from the ZIP code to the center of the largest principal city in the nearest metro area (as measured by distance to the city hall) and the household density in the ZIP code.
These were included in a decision tree, a machine learning technique designed to identify the best configuration of variables to predict a particular outcome — in this case, the type of community where Americans live.
Decision tree analysis identifies various ways of splitting a dataset into branches based on options for each variable. The algorithm starts by searching for the value among the predictor variables that can be used to split the dataset into two groups that are most homogenous with respect to the outcome variable — in this case, community type. These subgroups are called nodes, and the decision tree algorithm proceeds to split each node into progressively more and more homogenous groups until a stopping criterion is reached.
Our analysis produced eight nodes that were largely homogenous. We then selected which would be classified as urban, suburban and rural, based on the majority classification within the node. In nodes without a clear majority for a single community type, ZIP code-level data within that node was assessed to determine the best classification. Here is the resulting classification:
Urban: Americans living in ZIP codes that are 12 miles or less from the center of the nearest city and have a household density of more than 1,314 households per square mile.
Suburban: Americans living in ZIP codes that are 12 miles or less from the center of the nearest city and have a household density of 1,314 households or fewer per square mile. This group also includes people who live in ZIP codes that are more than 12 miles from the center of the city and have a household density of more than 106 households per square mile.
Rural: Americans living in ZIP codes that are more than 12 miles from the center of the nearest city and have a household density of 106 households or fewer per square mile.
In practice, this classification of urban areas largely applies to those who live in dense areas near the city center, while the classification of rural areas applies to those living in less dense areas farther away from cities. Suburban areas are both the less-dense areas near cities and the more-dense areas that might be slightly farther away from the city center.
Using our decision tree model, we found that 56% of those who were classified as living in an urban area self-identified their community as urban, while 34% identified it as suburban and 9% as rural. Among those who were classified as living in a suburban area, 58% identified their community as suburban, while about a quarter (24%) identified it as urban and 17% as rural. And among those who were classified as living in a rural area, about two-thirds (66%) identified their community as rural, with 22% identifying it as suburban and 9% as urban.

How all three measures fared
A few patterns emerged when we compared all three measures against our survey findings. All three methods most accurately classified rural Americans and did less well with Americans in urban and suburban areas. And while all the measures performed relatively well overall, the decision tree most closely matched self-reports across all three community types.
Assessing the decision tree model, about two-thirds (66%) of those who were classified as living in a rural area also self-reported as living in a rural community. Similarly, large shares of those who were classified as living in suburban (58%) and urban areas (56%) also reported living in those types of communities.

Using the NCHS county classification, a majority of those who were identified as living in a rural area (68%) reported living in the same type of community, compared with about half of those who were classified as living in a suburban community (48%) and 45% of those classified as living in urban areas.
Using the RUCC county classification, again about two-thirds of those classified as rural (68%) self-reported as the same. Smaller shares of those who were classified as living in suburban (42%) and urban areas (32%) reported living in those types of communities.
Conclusion
While the decision tree measure did slightly better than the two government measures, there was no clear winner for our analytical purposes. In the end, we decided that self-reported community type turned out to be the most useful metric.
Self-reported community type has the advantage of measuring how the respondent feels. Take, for example, a community that sits right on the edge of a major city, technically inside the bounds. The houses are far apart and are not within walking distance to food or commerce. Since it is technically inside the city limits, is it urban? Or, because the houses are far apart, is it suburban? We determined that how respondents feel about their community helped us to best assess their community in a survey.


