-
��վ��ҳ����
��վ��ҳ����
�����Ƿ���¼
360��վ��ȫ���
�ѹ��Ƿ���¼
360�Ƿ���¼
�ٶ��Ƿ���¼
�ٶ�����¼
��վ����
�ٶȰ�ȫ
�ٶȲ�ѯ
��������
��վip��ѯ
��վICP����������ѯ
�ѹ�����
�ٶȿ���
�ٶȷ���������ѯ
�ѹ�PR������ѯ
�ȸ�PR������ѯ
����Ȩ��������ѯ
360�ƶ�Ȩ��������ѯ
վ���ƶ�Ȩ��������ѯ
��վ�ƶ�Ȩ��������ѯ
360Ȩ�ز�ѯ
վ��PCȨ��������ѯ
��վPCȨ��������ѯ
�ѹ�����¼������ѯ
360����¼������ѯ
360����¼������ѯ
�ٶ�����¼������ѯ
�ٶ�����¼������ѯ
�ٶ�����¼������ѯ
�ٶ���վ��¼������ѯ
��ȡ��վIP
��ȡ��վ����
��ȡ��վ�ؼ���
��ȡ��վ����
HTTP״̬��
�ѹ�Ȩ��
�ѹ�����
��������¼
�ٶ�Ԥ������
ALEXA����
360����
��ǰλ�� ������ҳ > Python���ݿ��ӻ�֮��Matplotlib���Ƴ���ͼ��
- һ��ɢ��ͼ
- ������״ͼ
- ����ֱ��ͼ
- �ġ�����ͼ
- �ܽ�
Python���ݿ��ӻ�֮��Matplotlib���Ƴ���ͼ��
���ߣ�tzr0725 ʱ�䣺2021-08-11 18:29
Ŀ¼
һ��ɢ��ͼ
ɢ��ͼ���������ݹ��ɶ������㣬���������ķֲ����ж�������֮���Ƿ����ij�ֹ������ܽ������ķֲ�ģʽ��
�ص����жϱ���֮���Ƿ���������������ƣ���ʾ��Ⱥ��ķֲ����ɡ�
ɢ��ͼ������
plt.scatter(x,y) # ��Ĭ�ϵ���״��ɫ����ɢ��ͼ
ʵ���� �������ǻ�ȡ�����Ϻ�2020��5,10�·�ÿ�������������(�ֱ�λ���б�a��b)����ô��ʱ��ι۲����º���ʱ��仯��ij�ֹ��ɡ�
# ����ͼ�����������
y_5 = [11,17,16,11,12,11,12,13,10,14,8,13,12,15,14,17,18,21,16,17,30,14,15,15,15,19,21,22,22,22,23]
y_10 = [26,26,28,19,21,17,16,19,18,20,20,19,22,23,17,20,21,20,22,15,11,15,5,13,15,10,11,13,12,13,6]
�������£�
import matplotlib.pyplot as plt

# ��������
plt.rcParams['font.sans-serif']=['SimHei'] # �滻sans_serif����
plt.rcParams['axes.unicode_minus']=False # ��������Ḻ���ĸ�����ʾ����

plt.figure(figsize=(12,5), dpi=100)

y_5 = [11,17,16,11,12,11,12,13,10,14,8,13,12,15,14,17,18,21,16,17,30,14,15,15,15,19,21,22,22,22,23]
y_10 = [26,26,28,19,21,17,16,19,18,20,20,19,22,23,17,20,21,20,22,15,11,15,5,13,15,10,11,13,12,13,6]
x = range(1, 32)

plt.scatter(x, y_5, label='���·�')
plt.scatter(x, y_10, label='ʮ�·�')

# ���ӱ��⣬��������
plt.xlabel("ʱ��")
plt.ylabel("����")
plt.title("���º���ʱ��仯��ij�ֹ���")

# ����ͼ��ע��
plt.legend(loc='best')

plt.show()
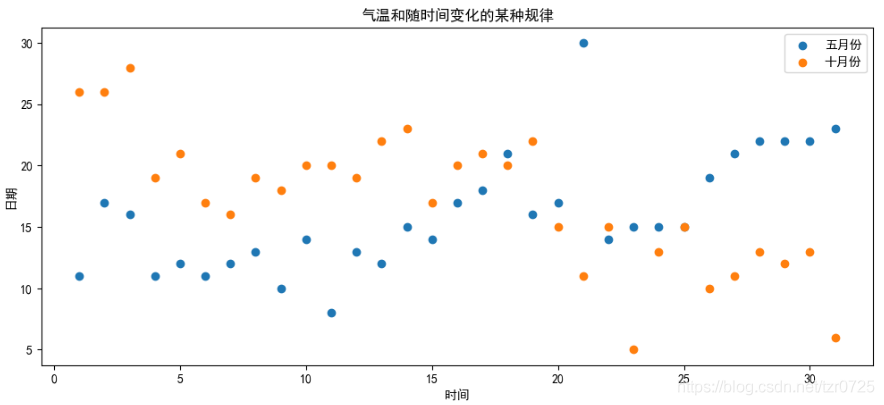
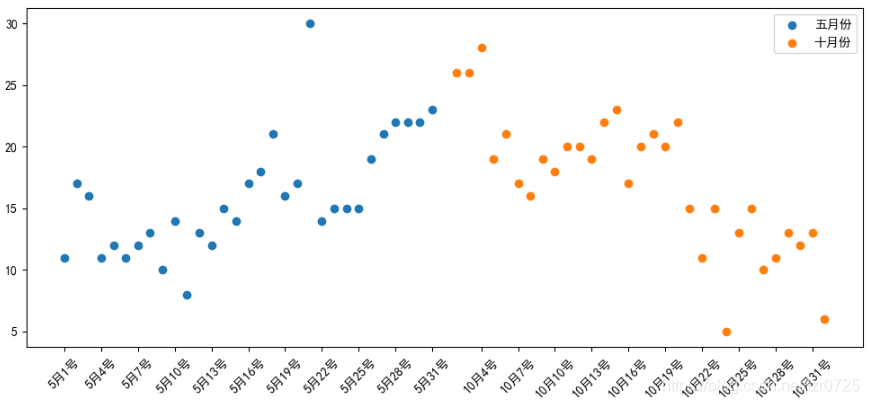
��ͼ��Ȼ���Ƴ�5��10�����������ڵı仯����������һ�𣬲����ڹ۲죬��ͨ����x���ݣ���10�µ�����㼯�����������Ҳ��ƶ����Ľ��Ĵ������£�
import matplotlib.pyplot as plt

# ��������
plt.rcParams['font.sans-serif']=['SimHei'] # �滻sans_serif����
plt.rcParams['axes.unicode_minus']=False # ��������Ḻ���ĸ�����ʾ����

plt.figure(figsize=(12,5), dpi=100)

y_5 = [11,17,16,11,12,11,12,13,10,14,8,13,12,15,14,17,18,21,16,17,30,14,15,15,15,19,21,22,22,22,23]
y_10 = [26,26,28,19,21,17,16,19,18,20,20,19,22,23,17,20,21,20,22,15,11,15,5,13,15,10,11,13,12,13,6]
x_5 = range(1, 32)
x_10 = range(33, 64)

plt.scatter(x_5, y_5, label='���·�')
plt.scatter(x_10, y_10, label='ʮ�·�')

# �̶���ʾ
x_t = list(x_4)+list(x_10)
x_l = ["5��{}��".format(i) for i in x_4]
x_l += ["10��{}��".format(i-31) for i in x_10]
plt.xticks(x_t[::3], x_l[::3], rotation=45)

# ����ͼ��ע��
plt.legend(loc='best')

plt.show()
������״ͼ
��״ͼ���ÿ�����ͬ�����εĸ߶Ȼ�����ʾ���ݶ��ٵ�ͼ�Ρ���״ͼ���Ժ��û����ã�����ʱҲ��Ϊ����ͼ��
�ص���
�ܹ�ֱ�۷�ӳ���������ݵĴ�С��
���ڱȽ�����֮��IJ��
��״ͼ������
plt.bar(x, width, align=��center', **kwargs)
Parameters:
x : sequence of scalars.

width : scalar or array-like, optional, ��״ͼ�Ŀ���

align: {��center', ��edge'}, optional, default: ��center'
Alignment of the bars to the x coordinates:
��center': Center the base on the x positions.
��edge': Align the left edges of the bars with the x positions.
ÿ����״ͼ��λ�ö��뷽ʽ, Ĭ����״ͼ��������x�������Ķ���

**kwargs:
color: ѡ����״ͼ����ɫ
ˮƽ����ͼ����
plt.barh(y, width) # ������yΪy��λ�õ�ˮƽ����ͼ
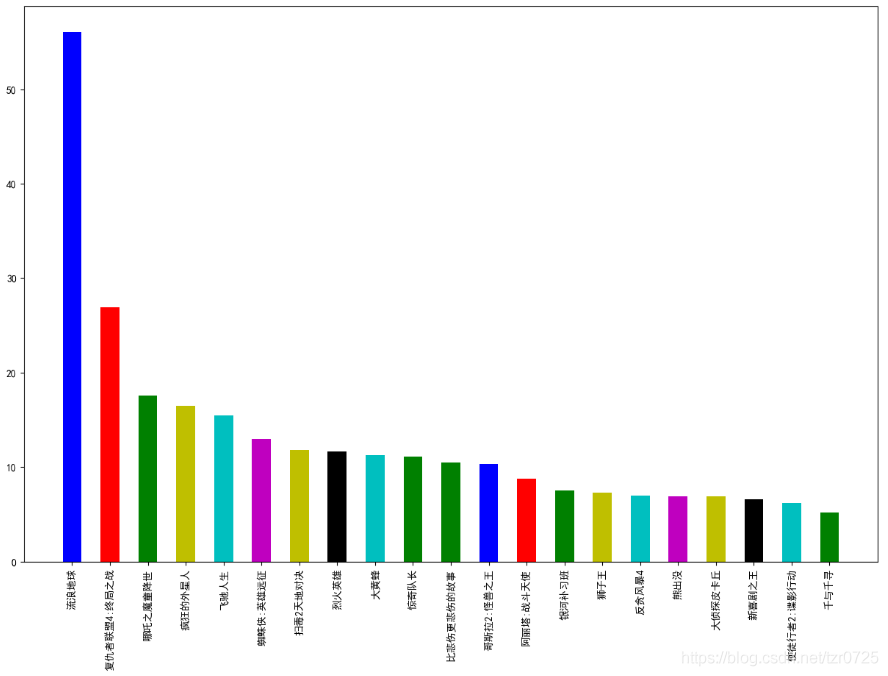
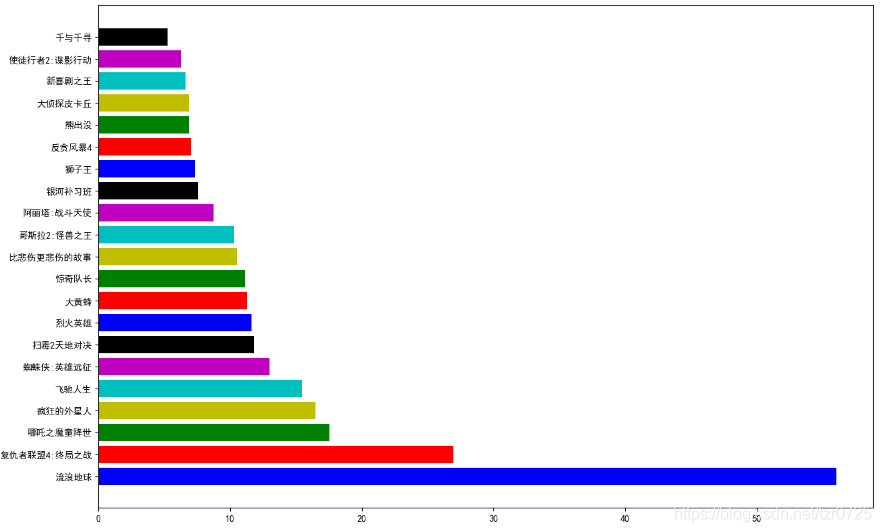
ʵ�����������ǻ�ȡ����2019���ڵص�ӰƱ��ǰ20�ĵ�Ӱ(�б�a)�͵�ӰƱ������(�б�b)��������״ͼֱ�۵�չʾ���ݣ��������£�
import matplotlib.pyplot as plt
# ��������
plt.rcParams['font.sans-serif']=['SimHei'] # �滻sans_serif����
plt.rcParams['axes.unicode_minus']=False # ��������Ḻ���ĸ�����ʾ����
plt.figure(figsize=(15,10),dpi=100)
# ����Ӱ�������Լ���Ӱ��Ʊ������
movie_name = ["���˵���","����������4:�վ�֮ս","��߸֮ħͯ����","����������",
"�ɳ�����","֩����:Ӣ��Զ��","ɨ��2��ضԾ�","�һ�Ӣ��","��Ʒ�",
"����ӳ�","�ȱ��˸����˵Ĺ���","��˹��2:����֮��","������:ս����ʹ",
"���Ӳ�ϰ��","ʨ����","��̰�籩4","�ܳ�û","����̽Ƥ����","��ϲ��֮��",
"ʹͽ����2:��Ӱ�ж�","ǧ��ǧѰ"]
y = [56.01,26.94,17.53,16.49,15.45,12.96,11.8,11.61,
11.28,11.12,10.49,10.3,8.75,7.55,7.32,6.99,6.88,6.86,6.58,6.23,5.22]
# �Ž�������������б�
x = range(len(movie_name))
# ��������ͼ
# ��ɫcolor������ʾ����ͼ��˳����ɫ����ѭ��
plt.bar(x, y, width=0.5, color=['b','r','g','y','c','m','y','k','c','g','g'])
# �Ŀ̶����ƣ�����ת90��
plt.xticks(x, movie_name, rotation=90)
# չʾͼ��
plt.show()
# ˮƽ����ͼ
plt.figure(figsize=(15,10),dpi=100)
plt.barh(movie_name, y, color=['b','r','g','y','c','m','k'])
plt.show()
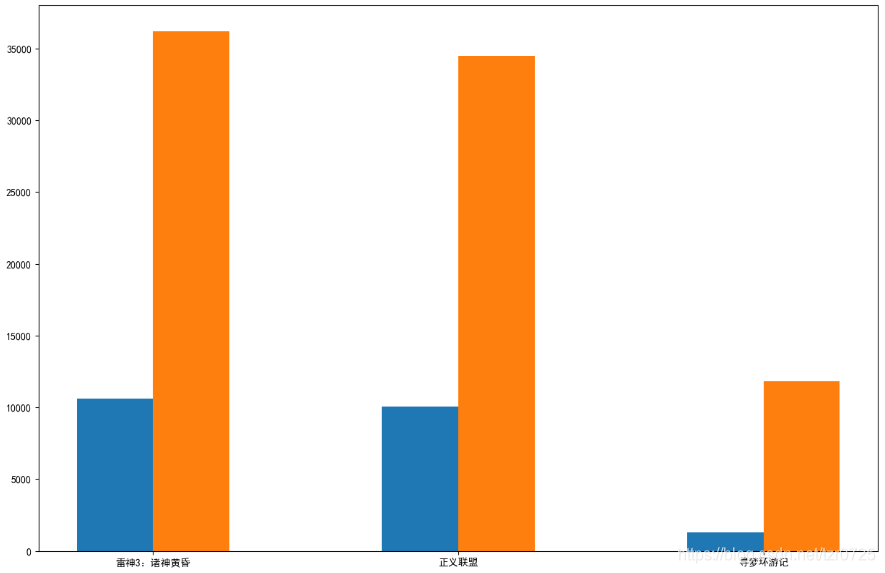
��ʱ��Ϊ�˹�ƽ�����������Ҫ�ԱȲ�ͬ��Ӱ���պ����ܵ�Ʊ�����룬�����ݸ���˵�����������������£�
movie_name = ['����3������ƻ�','��������','Ѱ�λ��μ�']
first_day = [10587.6,10062.5,1275.7] # ����Ʊ��
first_weekend=[36224.9,34479.6,11830] # ����Ʊ��
���Ʋ�ͬ��Ӱ���պ�����Ʊ��������ͼ���������£�
import matplotlib.pyplot as plt # �������� plt.rcParams['font.sans-serif']=['SimHei'] # �滻sans_serif���� plt.rcParams['axes.unicode_minus']=False # ��������Ḻ���ĸ�����ʾ���� plt.figure(figsize=(15,10),dpi=100) # ������ movie_name = ['����3������ƻ�','��������','Ѱ�λ��μ�'] # ��������Ʊ��������Ʊ������ first_day = [10587.6,10062.5,1275.7] first_weekend=[36224.9,34479.6,11830] x = range(len(movie_name)) # ���Ƶ�һ����״ͼ plt.bar(x, first_day, width=0.25) # ���Ż��Ƶڶ�����״ͼ plt.bar([i+0.25 for i in x], first_weekend, width=0.25) # �Ŀ̶����� # ��ʾx�����ģ��̶������պ����ܵ��м�λ�� plt.xticks([i+0.125 for i in x], movie_name) plt.show()
ע�����
x������̶���ʾλ�õĵ������ȿ���ͨ������ͼ��ʱ����x���ݣ�Ҳ����ͨ������x��̶�ʱ�����̶ȵķ�����ʵ��x��̶���ʾ��������״ͼ�м䡣��������κε���������Ĭ�����һ����״ͼ�м����ġ�
����ֱ��ͼ
ֱ��ͼ����״������״ͼȴ��������״ͼ��ȫ��ͬ�ĺ��塣ֱ��ͼǣ��ͳ��ѧ�ĸ������Ҫ�����ݽ��з��飬Ȼ��ͳ��ÿ������������Ԫ�������� ������ϵ�У�������ÿ����Ķ˵㣬�����ʾƵ����ÿ�����εĸߴ�����Ӧ��Ƶ������������ͳ��ͼΪƵ���ֲ�ֱ��ͼ��
�ص������������Ե����ݣ�չʾһ����߶������ݵķֲ����������ͳ�����ݷֲ���������
��ظ�����
��������ͳ������ʱ�������ݰ��ղ�ͬ�ķ�Χ�ֳɼ����飬�ֳɵ���ĸ�����Ϊ������
��ࣺÿһ�������˵�IJ
ֱ��ͼ����
plt.hist(x,bins=None)
������xΪ��ֵ��binsΪ���������� = ����/���
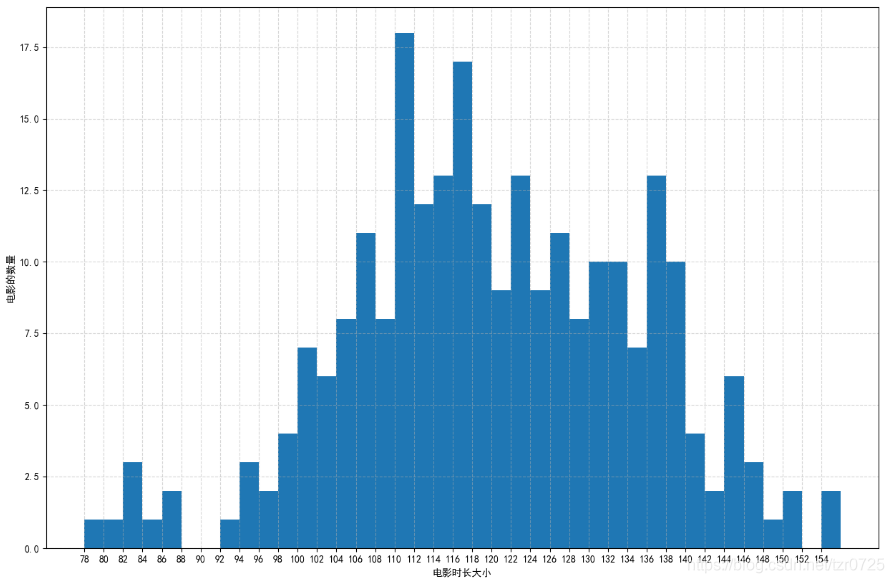
ʵ�����������ǻ�ȡ����һЩ��Ӱ��ʱ��������ֱ��ͼչʾ��Ӱʱ���ķֲ�������������£�
import matplotlib.pyplot as plt
# ��������
plt.rcParams['font.sans-serif']=['SimHei'] # �滻sans_serif����
plt.rcParams['axes.unicode_minus']=False # ��������Ḻ���ĸ�����ʾ����
plt.figure(figsize=(15,10),dpi=100)
# �����ݣ���Ӱʱ��
time =[131, 98, 125, 131, 124, 139, 131, 117, 128, 108,
135, 138, 131, 102, 107, 114, 119, 128, 121, 142,
127, 130, 124, 101, 110, 116, 117, 110, 128, 128,
115, 99, 136, 126, 134, 95, 138, 117, 111, 78,
132, 124, 113, 150, 110, 117, 86, 95, 144, 105,
126, 130,126, 130, 126, 116, 123, 106, 112, 138,
123, 86, 101, 99, 136,123, 117, 119, 105, 137,
123, 128, 125, 104, 109, 134, 125, 127,105, 120,
107, 129, 116, 108, 132, 103, 136, 118, 102, 120,
114,105, 115, 132, 145, 119, 121, 112, 139, 125,
138, 109, 132, 134,156, 106, 117, 127, 144, 139,
139, 119, 140, 83, 110, 102,123,107, 143, 115,
136, 118, 139, 123, 112, 118, 125, 109, 119, 133,
112, 114, 122, 109, 106, 123, 116, 131, 127, 115,
118, 112, 135,115, 146, 137, 116, 103, 144, 83,
123, 111, 110, 111, 100, 154,136, 100, 118, 119,
133, 134, 106, 129, 126, 110, 111, 109, 141, 120,
117, 106, 149, 122, 122, 110, 118, 127, 121, 114,
125, 126,114, 140, 103, 130, 141, 117, 106, 114,
121, 114, 133, 137, 92,121, 112, 146, 97, 137,
105, 98, 117, 112, 81, 97, 139, 113,134, 106,
144, 110, 137, 137, 111, 104, 117, 100, 111, 101,
110, 105, 129, 137, 112, 120, 113, 133, 112, 83,
94, 146, 133, 101, 131, 116, 111, 84, 137, 115,
122, 106, 144, 109, 123, 116, 111,111, 133, 150]
# ���
bins = 2
# ����������/���
groups = int((max(time) - min(time)) / 2)
# ����ֱ��ͼ
plt.hist(time, groups)
# ָ��x��̶ȵķ�Χ
plt.xticks(list(range(min(time), max(time)))[::2])
# ������������
plt.xlabel('��Ӱʱ����С')
plt.ylabel('��Ӱ������')
# ����������ʾ
plt.grid(True, linestyle='--', alpha=0.5)
plt.show()
�ġ�����ͼ
����ͼ��������Բ��ʾ��������Բ�ڸ������εĴ�С��ʾ����������ռ�����İٷ�����
����ͼ����
plt.pie(x, explode=None, labels=None)
x����������
explode������ij�����ֿ��Ƿ�Ҫ�����ͼ
labels��ÿ�����α�ǩ
autopct���ٷֱ����ݱ�ǩ
shadow���Ƿ���ʾ��Ӱ
plt.pie()��3������ֵ��
patches�����Ʊ�ͼÿһ��Ķ���
texts���ı����б�
autotexts���ٷֱȵ��ı��б�
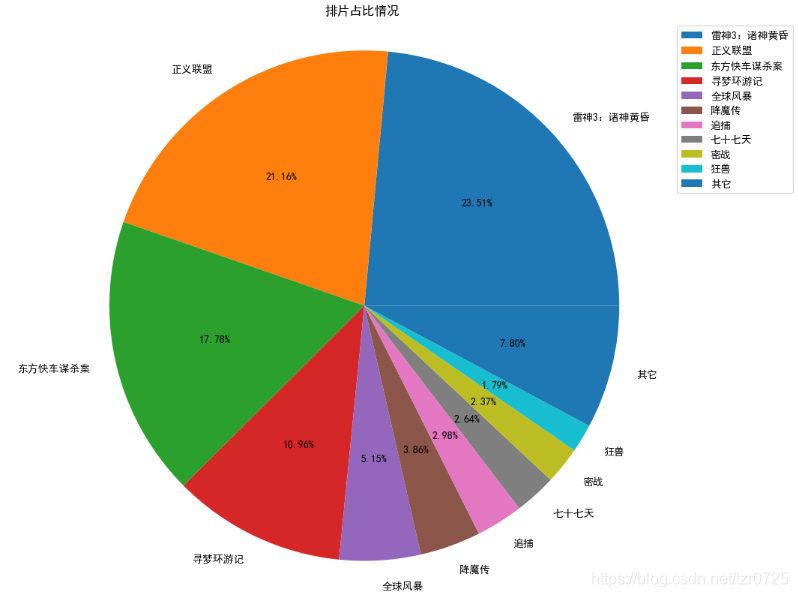
ʵ�����������ǻ�ȡ����һЩ��Ӱ����Ƭ���ݣ���������ͼչʾ��Ӱ����Ƭռ��������������£�
import matplotlib.pyplot as plt
# ��������
plt.rcParams['font.sans-serif']=['SimHei'] # �滻sans_serif����
plt.rcParams['axes.unicode_minus']=False # ��������Ḻ���ĸ�����ʾ����
# ��ͼ����
plt.figure(figsize=(15, 10), dpi=100)
# ��Ӱ��Ƭ����
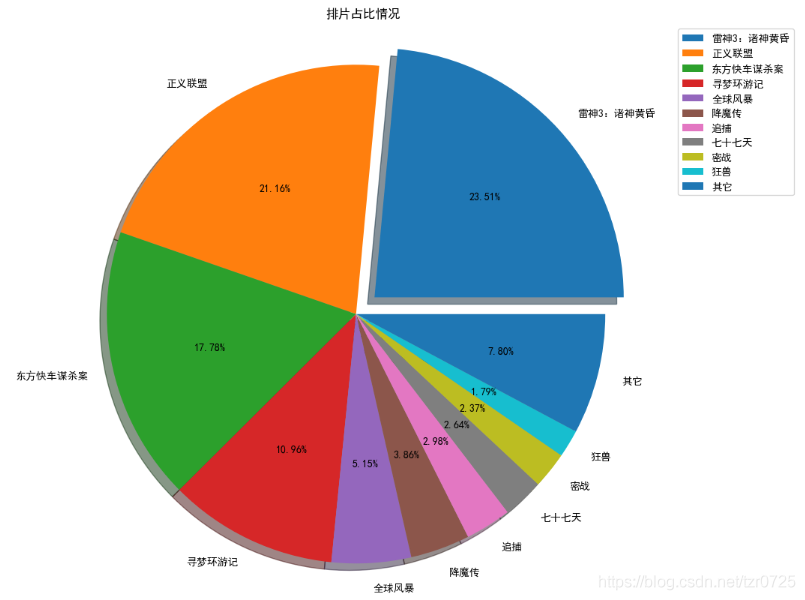
movie_name = ['����3������ƻ�','��������','�����쳵ıɱ��','Ѱ�λ��μ�','ȫ��籩','��ħ��','��','��ʮ����','��ս','����','����']
place_count = [60605,54546,45819,28243,13270,9945,7679,6799,6101,4621,20105]
# ��������ͼ
plt.pie(place_count, labels=movie_name, autopct="%1.2f%%")
# ָ����ʾ��pie����Բ
plt.axis('equal')
# ����ͼ���ͱ���
plt.legend(loc="best")
plt.title("��Ƭռ�����")
plt.show()
����ͼ�Ż����ֶ�������Ӱ�������ض����ݵȣ�
import matplotlib.pyplot as plt
# ��������
plt.rcParams['font.sans-serif']=['SimHei'] # �滻sans_serif����
plt.rcParams['axes.unicode_minus']=False # ��������Ḻ���ĸ�����ʾ����
plt.figure(figsize=(15, 10), dpi=100)
movie_name = ['����3������ƻ�','��������','�����쳵ıɱ��','Ѱ�λ��μ�','ȫ��籩','��ħ��','��','��ʮ����','��ս','����','����']
place_count = [60605,54546,45819,28243,13270,9945,7679,6799,6101,4621,20105]
# ��������ͼ��������ӰЧ��,����ռ����������3����
explode = [0.1, 0, 0, 0, 0, 0, 0, 0, 0, 0, 0]
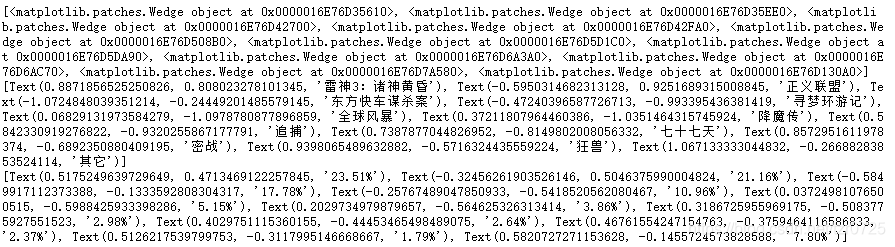
res = plt.pie(place_count, labels=movie_name, explode=explode, autopct="%1.2f%%", shadow=True)
patches, texts, autotexts = res
print(patches) # ��ʾÿ�����εĶ���
print(texts) # ÿ���ı�����
print(autotexts) # ÿ���ٷֱȶ���
# ָ����ʾ��pie����Բ
plt.axis('equal')
# ����ͼ���ͱ���
plt.legend(loc="best")
plt.title("��Ƭռ�����")
plt.show()
��ӡ������ͼ����ֵ��
�Ż��������ͼ��
�ܽ�
���Ľ�����ʹ��Matplotlib����ɢ��ͼ����״ͼ��ֱ��ͼ������ͼ�Ļ���������
jsjbwy- Python���ݿ��ӻ�֮��Matplotlib���Ƴ���ͼ��
- Jupyter Notebook ���������ʹ�С�Լ�����������ʽ
- Pythonʵ�ֻ���ѧϰ�㷨�ķ���
- Python�Զ���֮��������������������
- iPhone�ֻ���ô����������Ч?iPhone�ֻ�����������Ч�̳�
- ƻ���ֻ���ΰѽ��������ӵ�����?
- iPhone�ػ�����ô��λ�٣�iPhone�ػ���λ�ٷ���
- ios14.7.1������� ios14.7.1��������
- ƻ��12��ô���öű�ȫ����?ƻ��12���öű�ȫ�����̳�
- OPPOReno6����������������?OPPOReno6�����������ѽ̳�
- С��MIX4�ֱ����Ƕ��� С��MIX4��2K����
- С��mix4֧��5g�� С��mix4�к����߹�����
- vivos9������÷���?vivos9���÷����̳�
- oppoReno6����ת����������ô����?oppoReno6��������ת��������
- Ħ������Edge���ݰ�Ա�OPPOreno6�ĸ�ֵ����?
- Ħ������Edge���ݰ�ԱȺ���K40�ĸ���?
- ��ҫ50Pro�Ա���ҫV40�ĸ�ֵ������?
- С��11�Ա�vivox60pro�ĸ�����?С��11�Ա�vivox60pro����
- С��MIX4�ò����� С��MIX4ʹ������
- ��ӳ����ڵ�����?��ӳ�༭ʱ�ڵ����ƽ̳�
- ������Զ���״̬��?���Զ���״̬�ʽ̳�
- ֧����������ת���� ֧������Ǯ��ôת����Ǯ��
- lumafusion��ô������Ļ?lumafusion������Ļ�̳�
- Audition��������ô���ÿ��������ֲ���ѡ����Ƶ����?
- Audition�����Ƶ������ôʵ�ֿ�������?
- Audition��ô����ʽ��������Ч? audition������Ч���ļ���
- VisualStudio��ô����ճ��ʱ��ʽ����? vsճ��ʱ�Զ������ļ���
- VSCode�ײ�״̬����ô����? VSCode����״̬���ļ���
- evEco Studio��ô���ط����ָ���? evEcoStudio����ʾ�����ָ���
- CDR����ͼ����ʾ��coreldraw2021-2017/x8/x7/x6/x5/x4����ͼ����