the Creative Commons Attribution 4.0 License.
the Creative Commons Attribution 4.0 License.
 | 15 May 2024
Evapotranspiration evaluation using three different protocols on a large green roof in the greater Paris area
Pierre-Antoine Versini
Leydy Alejandra Castellanos-Diaz
David Ramier
Ioulia Tchiguirinskaia
Nature-based solutions have appeared as relevant solutions to mitigate urban heat islands. To improve our knowledge of the assessment of this ecosystem service and the related physical processes (evapotranspiration), monitoring campaigns are required. This was the objective of several experiments carried out on the Blue Green Wave, a large green roof located in Champs-sur-Marne (France). Three different protocols were implemented and tested to assess the evapotranspiration flux at different scales: the first one was based on the surface energy balance (large scale); the second one was carried out using an evapotranspiration chamber (small scale); and the third one was based on the water balance evaluated during dry periods (point scale). In addition to these evapotranspiration estimates, several hydrometeorological variables (especially temperature) were measured. Related data and Python programs providing preliminary elements of the analysis and graphical representation have been made available. They illustrate the space–time variability in the studied processes regarding their observation scale. The dataset is available at https://doi.org/10.5281/zenodo.8064053 (Versini et al., 2023).
- Article
(2109 KB) - Full-text XML
- BibTeX
- EndNote


Nature-based solutions (NBSs) are solutions that can restore natural processes while also providing a variety of valuable environmental, economic, and social benefits (European Commission, 2015). Among NBSs, green roofs are often proposed for sustainable urban adaptation. They have been widely recognized to reduce urban stormwater runoff (Ayata et al., 2011; Stovin et al., 2012; Versini et al., 2020) and the urban heat island (UHI) phenomenon (Cascone et al., 2018; Coutts et al., 2013; Sharma et al., 2016; Wadzuk et al., 2013) while also preserving biodiversity (Duffaut et al., 2022).
The UHI phenomenon is characterized by a difference in the air temperature between urban and rural areas, mainly at night (Oke, 1982). According to Sharma et al. (2016), several factors contribute to the UHI effect. Among them, the conversion of vegetation to impervious surfaces is highlighted, as it decreases the cooling provided by vegetational evapotranspiration (ET) process. Several studies have found that buildings' roofs represent around 25 % of the land surface in urban areas (Cascone et al., 2018; Yang et al., 2018). Therefore, the implementation of vegetated structures, like green roofs, into new constructions or retrofitted ones is highly promoted as a solution to mitigate the UHI effect.
Consequently, understanding the ET process is key to identifying the conditions under which green roofs provide the highest cooling benefit. ET is a combined process by which water is transferred to the atmosphere via evaporation from surfaces and via transpiration from plants. Evaporation is the physical process of change from liquid water to vapour, whereas transpiration is the transfer of liquid water from the plant root system to the leaves, where water is evaporated. The transformation of liquid water to vapour requires sufficient energy to overcome liquid-phase intermolecular forces. As a consequence, the heat (i.e. as a form of energy) is removed from the atmosphere because of ET.
In green roofs, the mass and heat transfer of water vapour involved in the ET process makes air become moist and reduces the surface temperature of the roofs and the adjacent environment. Different conditions can affect the ET efficiency of green roofs. These can include external conditions (e.g. local climate, surface albedo, and soil moisture) or internal factors (e.g. substrate and vegetation properties). External conditions, such as local climate, determine the amount of energy available for ET, whereas internal factors govern the water retention and water loss rate. As a large number of physical, meteorological, and vegetation parameters are involved in the ET process of green roofs, several methods for ET measurement have been developed at different scales.
One of the most widely applied methods to measure ET over green roofs is the weighing lysimeter, which is considered to be the only direct quantitative ET estimation technique (Rana and Katerji, 2000). This method monitors weight changes in the green roof structure due to water losses from ET. For technical and financial reasons, this method is limited to small prototypes of a few square metres (Cirkel et al., 2018; DiGiovanni et al., 2013; Wadzuk et al., 2013). Laboratory experiments carried out by Ayata et al. (2011) to estimate ET using weighing lysimeters and water balance methods demonstrated that the main advantage of such experiments is the full control of environmental conditions (e.g. temperature, humidity, and solar radiation). Some cheaper devices (compared with lysimeters) to monitor the weight change of green roofs have also been used. For example, in New Zealand, mass changes of eight green roof trays due to water loss by ET were monitored with a weight sensor (single-beam load cells) (Voyde et al., 2010). Furthermore, examinations of the mass balance and soil moisture variations in green roof plots (laboratory scale) inside a climate chamber have been carried out in other studies (Poë et al., 2015; Tabares and Srebric, 2012).
Plant physiology approaches, such as chamber systems, have also been used on green roofs. In New York, an experiment used a portable dynamic closed chamber to survey the water vapour concentration on extensive green roofs (Marasco et al., 2015). Likewise, measurements from a chamber on warm and sunny days in Melbourne (Coutts et al., 2013) demonstrated the link between soil moisture and ET.
Moreover, micrometeorological approaches used to examine ET at large scales in agricultural experimentation, such as the eddy covariance (ECO) technique, have been deployed in urban environments. The ECO technique derives convective fluxes from the covariance of fluctuations in the vertical wind velocity and the atmospheric scalars by turbulent eddies. As a consequence, it has been recognized as a useful method to investigate green roofs and the surrounding atmospheric energy exchanges in the case of a very large surface with a sufficient fetch. A 1-year ECO experiment to characterize annual variability in the surface energy balance (SEB) parameters (Thorp, 2014), conducted on a green roof located at the California Academy of Sciences, showed that the sensible heat flux was the dominant component of the SEB during the daytime; meanwhile, the latent heat (proportional to ET) was only higher in the first daytime hours. The ECO application by Heusinger and Weber (2017) over an unirrigated extensive 8600 m2 green roof in Berlin confirmed the dominant fraction of sensible heat in the warmer periods.
Apart from ECO, another micrometeorological approach that is frequently used in agriculture for the deduction of the latent heat flux by means of the SEB via estimation of the sensible heat flux is scintillometry. This technique is deployed to measure fluctuations in the air reflective index that are induced by temperature changes over a horizontal path. However, because of its implementation limitation over small horizontal distances, this method has not yet been used for green roofs. Various authors have recognized optical scintillometry methods as an accurate and suitable tool to estimate turbulent fluxes, such as the latent heat flux, over homogeneous and heterogeneous surfaces (Guyot et al., 2009; Meijninger et al., 2002; Moene, 2003; Moorhead et al., 2017; Valayamkunnath et al., 2018; Yee et al., 2015).
Due to wide variability in the methodologies and measurement conditions related to the examination of ET, misunderstandings regarding ET and the thermo-physical performance of green roofs persists. Moreover, despite the large number of previous studies dedicated to microclimate mitigation using NBSs, no data are currently available. In this context, the aim of this paper is to present and make available data collected using three ET measurement methods and to differentiate them with respect to their spatial and temporal scales. These three experimental methods were conducted on an extensive wavy green roof, called Blue Green Wave (BGW). They rely on the following: (i) the surface energy balance (SEB) to deduce latent heat fluxes (from measurements of sensible heat flux using the scintillometry technique), (ii) the variation in absolute humidity within an evapotranspiration chamber, and (iii) the analysis of the water balance during dry periods to deduce ET by means of water content loss in the ground. Additional hydrometeorological data characterizing the measurement campaign conditions are also made available, including the incident and reflected solar and atmospheric radiation; substrate, surface, and air temperature; water content; and the structural parameter of the refractive index of air.
2.1 The Blue Green Wave
The experimental campaigns were carried out on the Blue Green Wave (BGW), a 1 ha non-irrigated extensive wavy green roof (see Fig. 1) located in front of École des Ponts (ENPC) in Cité Descartes (Champs-sur-Marne, 20 km east of Paris), the research and education core dedicated to sustainable cities of eastern Paris. The BGW vegetation includes mainly green grass and a mix of perennial plants, grasses, and bulbs. The depth of the substrate layer varies from 20 to 28 cm, depending on the vegetation type. The substrate is a composition of volcanic soil completed by organic matter (around 13 % by mass). The reader is referred to Stanic et al. (2020) and Versini et al. (2020) for more details on the composition of the different BGW layers.
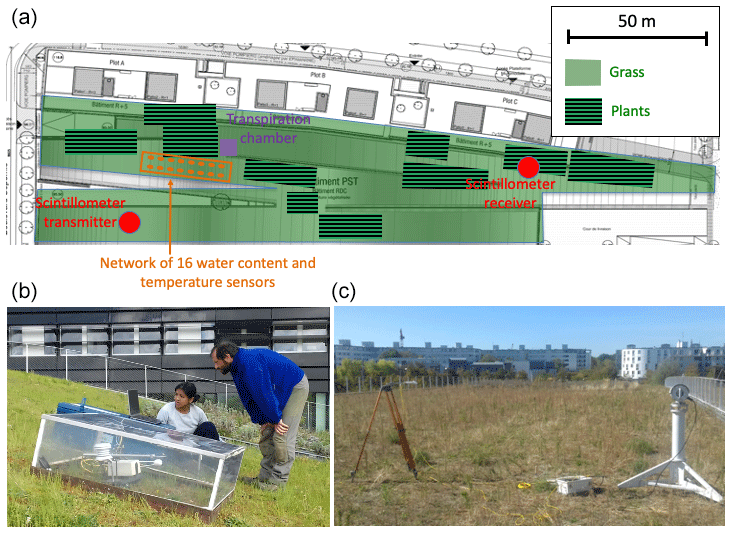
Figure 1The Blue Green Wave experimental site: implementation of the different sensors (a), the evapotranspiration chamber (b), and the surface energy balance instruments (c).
Since 2013 and the EIT Climate-KIC “Blue Green Dream” project (Maksimovic et al., 2013), the BGW has become an experimental site to study and understand the hydrological and thermal behaviour of extensive green roofs. Permanent monitoring of water balance components (e.g. rainfall, soil water content and temperature, and runoff) began in 2018 and has been presented in a previous data paper (Versini et al., 2020). The objective was to better understand how such NBSs can act as a stormwater management tool. To complement this approach and assess their performance with respect to urban cooling, energy balance, and evapotranspiration, campaigns were conducted during the summer months from 2018 to 2020. These experiments were conducted at three different spatial scales, which are presented in the following.
2.2 Experiment protocols and study scale
2.2.1 Large-scale assessment using the surface energy balance
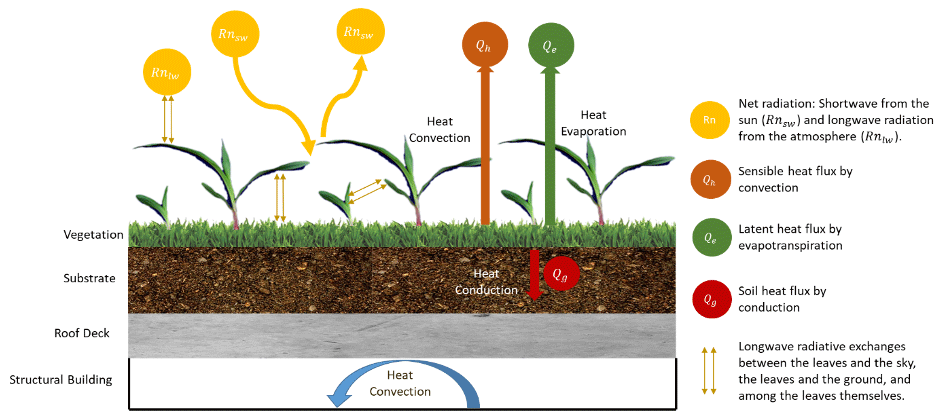
On green roof surfaces, most radiative energy comes from solar shortwave radiation and, to a lesser degree, from longwave radiation provided by the ground, the leaves, and the sky. This energy can be partially absorbed or reflected by the vegetation and the soil of the roof. Thus, the net radiative flux (Rn) is the difference between the incident and reflected radiative fluxes. Rn represents the main input of the surface energy balance (SEB), which is exchanged with the green roof, the surrounding atmosphere, and the building structure (see Fig. 2) via the sensible heat flux (Qh) produced by convection, the latent heat flux (Qe) due to evapotranspiration from vegetation and soil, and the heat conduction into the soil substrate (Qg) (de Munck et al., 2013; Marasco et al., 2015). In this way, the energy balance on a green roof can be defined as follows:
All terms of the energy balance are expressed in terms of energy transfer per unit area (W m−2). The terms on the right-hand side of Eq. (1) can be either positive or negative, representing losses or gains of heat with respect to the surface, respectively. Conversely, the sign of Rn is positive when there is a heat gain and negative when there is a heat loss (Oke, 1987). Additional heat fluxes transferred by advection, anthropogenic sources, photosynthesis process, and heat stored in the substrate matrix are neglected.
As Rn, Qh, and Qg are measured by radiometers, scintillometer, and thermocouples, respectively (see Sect. 2.3), Qe can be deduced like the residual component of SEB:
2.2.2 Small-scale assessment using an evapotranspiration chamber
A portable evapotranspiration chamber built by Cerema (Centre D'études Et D'expertise Sur Les Risques, L'environnement, La Mobilité Et L'aménagement) was installed at specific points across the BGW vegetation to measure Qe. This device (see Fig. 1) consists of a 1 m2 enclosed Plexiglas chamber with a total volume of 0.3 m3 (1 m2 × 0.3 m). Gas exchange, specifically water vapour (absolute humidity), H2O, and carbon dioxide, CO2, was monitored inside the chamber using a LI-COR LI-7500 gas analyser. The chamber was also equipped with two small rotating fans (to homogenize the air sample inside the chamber), two T107 temperature sensors, and an NR Lite radiometer (Kipp & Zonen), in order to control the variation in microclimate parameters inside the ventilated chamber.
The latent heat flux rate of the volume enclosed by the chamber is deduced from the rise in the absolute humidity (Coutts et al., 2013). Measurements of absolute humidity are made each second over a 2 min period. A linear regression is then carried out on the first minute of measurement (assumed to be short enough to not generate microclimate changes inside the chamber and to attain the saturation vapour pressure; see Fig. 3). The latent heat flux rate is then obtained by the slope of the linear regression (Ramier et al., 2015; Ouédraogo et al., 2023) as follows:
where Qe is the latent heat flux (W m−2), Lv is the latent heat of the vaporization of water, Vch and Ach correspond to the respective volume and area of the chamber (0.3 m3 and 1 m2, respectively), represents the absolute humidity variation during the first minute of measurement (g m−3 s−1), and 10−3 is a conversion factor.
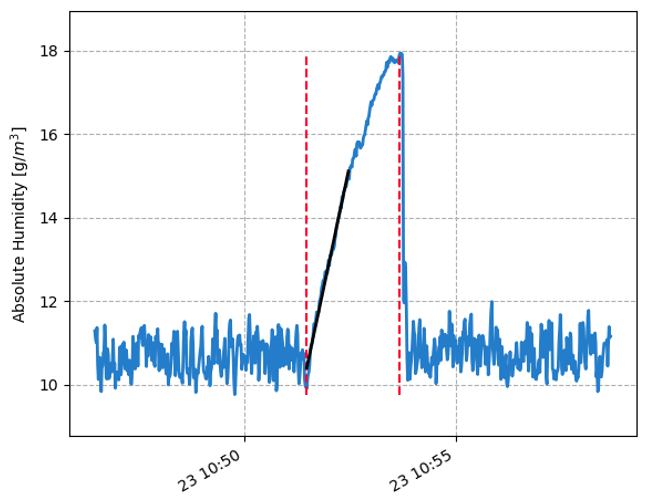
Figure 3Time series of absolute humidity variation (blue) for 2 min (start and end times are shown by the dotted red lines) and the linear regression on the first minute (black).
2.2.3 Point-scale assessment using the water balance
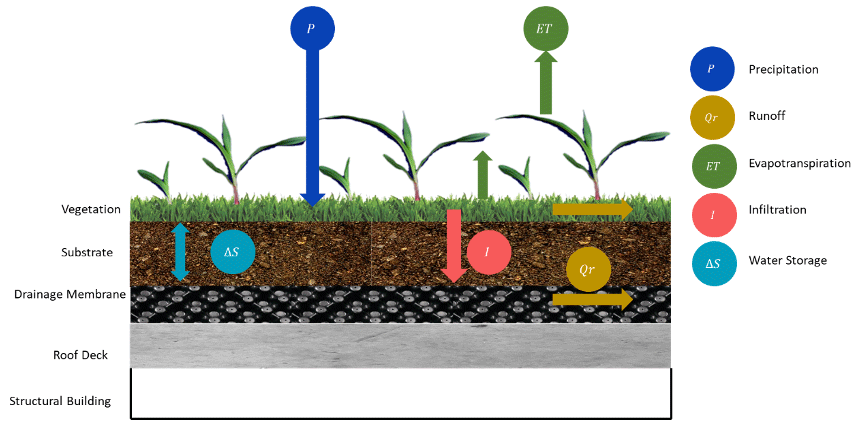
In a green roof, water input fluxes (precipitation or irrigation) can be released to the discharge/sewage network as runoff or to the atmosphere as ET (see Fig. 4). Therefore, the water balance in a green roof can be expressed as follows:
where P represents the precipitation, I is the irrigation, Qr is the runoff, and ΔS corresponds to the variation in the stored water in the soil. All of the terms in Eq. (4) are expressed in millimetres per hour (mm h−1).
In extensive green roofs, where no irrigation system is usually implemented (i.e. as is the case for BGW), there is no water infiltration in the substrate nor runoff during long dry periods without precipitation. Therefore, during these periods, the ET flux can be estimated from the water balance equation using the soil water content variations:
ET can then be converted in Qe as follows:
where Lv (2.45×10⁶ J kg−1 at 20 °C) is the latent heat of the vaporization of water and ρw (1000 kg m−3 at 20 °C) is the water density.
2.3 Devices
The different sensors used for the three measurement protocols are presented in detail in this section.
2.3.1 Radiometer
To analyse the main components that supply energy to the BGW, a CNR4 radiometer from Kipp&Zonen® (Kipp&Zonen, 2014) was installed close to the scintillometer receiver unit and 1.5 m above the ground. The objective was the measurement of Rn, the ratio between the incoming and outgoing short- and longwave radiation (see Eqs. 1 and 2). The CNR4 radiometer includes two pyranometers to measure incident (Swin) and reflected (Swout) solar or shortwave radiation as well as two pyrgeometers to estimate longwave radiation from the sky (Lwin) and the ground (Lwout). Due to the energy gain for the surface from incident radiation, Swin and Lwin are positive, whereas the energy reflected, Swout and Lwout, is negative. All radiation components are used to calculate the net total radiation on the BGW as follows:
As a temperature sensor (Pt100) is incorporated in the CNR4, air temperature was also recorded.
2.3.2 Scintillometer
A scintillometer is an instrument that consists of a transmitter that emits an electromagnetic wave signal (with a specific wavelength λs) to a receiver which records the intensity variations in the signal (Yee et al., 2015). The variations in signal intensity are caused by the fluctuations in the refractive index of air (n) along a propagation path (see Fig. 5), due to eddies created by variations in temperature, humidity, or pressure in the planetary boundary layer. The magnitude of the variations in a scalar, the refraction index of air n for this case, can be described by the structure function parameter of the scalar .
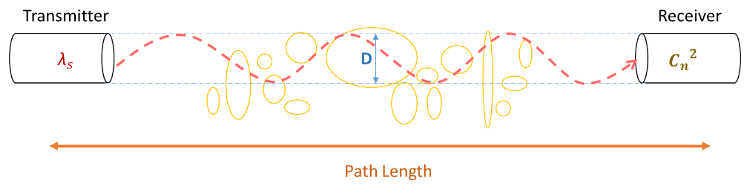
In this experiment, a large-aperture scintillometer (LAS) MkI produced by Kipp&Zonen® (Kipp&Zonen B.V, 2015) was installed at the highest levels of the BGW. The path length range of an LAS is from 250 m up to 4.5 km; however, shorter distances of between 100 m to 1 km can be measured if the aperture diameter (D) is reduced to 10 cm using a diaphragm. Another specification of the LAS is the λs, which corresponds to 850 nm. An LAS MkI provides spatially averaged measurements of . Indeed, the LAS MkI measures the variance in the intensity fluctuations' natural logarithm , which is related to the path-averaged refractive index structure parameter as follows:
where D is the aperture diameter of both the transmitter and receiver and R is the path length between both LAS units.
When the intensity of is too elevated, the signal becomes saturated and the intensity fluctuations in the scintillometer are no longer proportional to . This phenomenon is known as the “saturation effect”. To avoid this, the pathlength, the aperture diameter, and the wavelength are used to evaluate the criterion of for saturation-free conditions using the following formula: .
The spatial fluctuations in n along the path length are associated with fluctuations in temperature (T), humidity (Q), and (to a lesser extent) air pressure (P). Hence, the structure parameter can be related to the thermodynamic structure parameters of air temperature , humidity , and the covariant term CTQ (ignoring pressure fluctuations):
where AT and AQ are constants (functions of the beam wavelength), is the mean value of air temperature, and is the mean humidity.
Nevertheless, as demonstrate by Moene (2003), can be considered to be directly proportional to , as this is more influenced by the temperature than humidity:
From , it is then possible to estimate Qh by applying the Monin–Obukhov similarity theory (MOST) in combination with the following additional meteorological data: air temperature, relative humidity, wind speed, and air pressure (Kipp&Zonen B.V, 2015). MOST derived the universal dimensionless relationship for :
and
Here, d is the zero-plane displacement height (the height to which the roughness length is added to define the height at which the logarithmic wind profile is equal to zero due to obstacles such as buildings or the canopy), zLAS is the effective height of the scintillometer beam above the surface, LMO is the Monin–Obukhov length, T∗ is the temperature scaling variable, and fT corresponds to the universal stability function.
In this way, from measurements, meteorological and terrain parameters, and the application of MOST relationships, T∗, LMO, and the friction velocity u∗ are iteratively estimated. Finally, Qh can be computed as follows:
where ρa is air density (∼1.12 kg m−3 at sea level) and Cp is the specific heat capacity of air at constant pressure (∼1005 J K−1 kg−1).
2.3.3 Thermocouples
According to Fourier's law, the conduction of heat flux into the soil is linearly proportional to the soil temperature gradient of the soil layer (expressed in K m−1) and the capacity of the soil to transfer heat, a property known as soil thermal conductivity k (W m K−1):
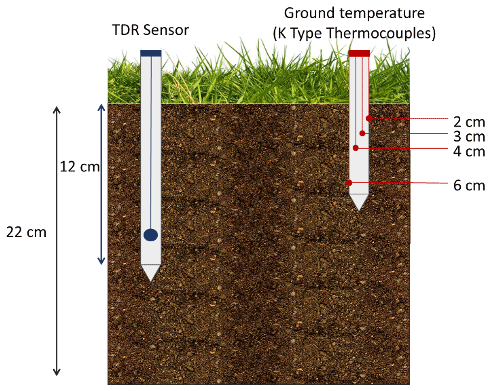
During the energy balance measurement campaigns, four thermocouples were placed in the BGW substrate, between the LAS receiver and the CNR4. They were vertically separated by 1–2 cm, aiming to estimate the soil thermal gradient as a direct application of the one-dimensional form of Fourier's law and to quantify the heat flux transfer (Qg) by means of Eq. (14).
The experimental temperature data gathered by the thermocouples placed in the deepest and most superficial soil locations (z1=6 and z4=2 cm, respectively), as shown in Fig. 6, were used to calculate the temperature gradient in the substrate layer profile. (Note that z3=3 and z4=2 cm can also be used to compute Qg closer to the surface.)
As k is a function of several factors, such as the soil density, porosity, water content, or thermal conductivity of individual particles (Vera et al., 2018), there is a great difficulty in obtaining accurate k measurements under field conditions. In this experiment, a value of k was set according to a literature review (Vera et al., 2017) based on the soil moisture conditions of green roofs. Two values corresponding to dry conditions (0.15 W m K−1) and wet conditions (0.85 W m K−1) have been used, but these values can be modified in the Python script to better account for this variability.
As already mentioned, two additional thermocouples were used with the evapotranspiration chamber (see Section 2.2.2) to measure the air temperature in and outside of the chamber.
2.3.4 TDR water content sensor
The space–time variability in the local water content and soil temperature (Tsoil) was monitored on the BGW by means of a wireless network of 16 CWS665 sensors (produced by Campbell Scientific®) placed at different locations on the roof. The sensors use the time domain reflectometry (TDR) technique to measure the propagation time of an electromagnetic (EM) pulse. This pulse is applied to a pair of 12 cm metallic rods inserted into the soil. The time necessary for the incident EM to reach the end of the rods and its reflection will depend on the dielectric permittivity (ka) of the soil. An empirical universal relationship between ka and the volumetric water content (VWC) for a homogeneous mineral soil was established by Topp et al. (1980):
From VWC (m3 m−3) measurements, variations in the soil water content were determined as follows:
where zs is the soil layer thickness and Δt is the time step of soil water storage variation.
ET in the BGW was then deduced from Eqs. (5) and (16). It represents the water loss due to soil evaporation and plant transpiration over a dry period.
2.3.5 Gas analyser
The concentration of absolute humidity within the evapotranspiration chamber was monitored using a LI-COR LI-7500 CO2/H2O gas analyser (by LI-COR®; see Li-COR Biosciences, 2017, for details).
Measurement consists of a broadband infrared light source, band-pass filters to select a wavelength range that spans absorption lines for CO2 and water vapour, and a detector. Light is absorbed by CO2 and H2O in the light path, and the reduced intensity observed by the detector is a nonlinear function of the molar concentration of CO2 and H2O. The LI-7500 is an open-path analyser that has a sample cell in open air.
Concentration data of H2O in millimoles per mole measured by the LI-COR LI-7500 were directly converted to grams per cubic metre for the deduction of ET from Eq. (3).
2.4 Monitoring campaigns
Due to technical and safety issues, the measuring equipment was not permanently implemented on the BGW. As a consequence, some daily monitoring campaigns were carried out during the 2018–2020 summers.
The LAS MkI was implemented on the BGW over some average periods of 7 h. Each scintillometer unit (transmitter and receiver) was situated on the highest points of the roof, and the transmitter and receiver were separated by approximately 100 m (see Fig. 7). Diaphragms for short-range applications were placed in front of the units, reducing the aperture diameter D from 15 to 10 cm. As the path length and the height of the LAS units are the only variables than can be modified to maintain a value below the saturation criterion, the transmitter and receiver heights (zT and zR, respectively) were adjusted with respect to m over the BGW.
Additional parameters related to the terrain, such as z0 (roughness length) and d (zero-displacement height), were adopted following the LAS MkI manual (Kipp&Zonen B.V., 2015). For z0, the BGW was considered to be rough terrain with an open landscape and obstacles separated by ∼15h (where h is the crop height), while d was considered to be negligible because the roughness elements of the BGW are not closely packed.
The radiometer was placed close to the LAS receiver at a height of 1.5 m (Fig. 7). Additional necessary meteorological data, such as wind speed and direction, relative humidity, and air pressure were not available in situ. As a consequence, they were gathered from the Orly Airport weather station, from the national meteorological service of France (Météo-France, https://meteofrance.com/, last access: May 2024), located 50 km from the BGW. The time step of the dataset was 3 h. The authors are aware that micrometeorological phenomena (particularly wind velocity) can have some influence on UHI creation. To understand the variables that most impact the iterative process of Qh calculation (Eqs. 10, 11, 12), a sensitivity analysis was conducted using Latin hypercube sampling (LHS; see Castellanos, 2022). Pearson's correlation coefficient, used as a sensitivity index in this analysis, showed that the wind speed U was moderately correlated with Qh (0.35). Moreover, for these particular cases, the monitoring campaigns occurred under relatively wind-free conditions. For this reason, very few differences between local data and Météo-France data were assumed.
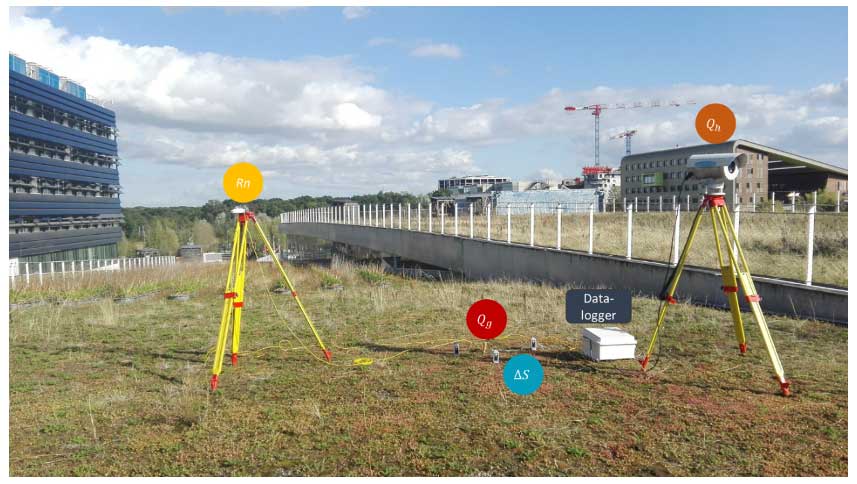
Figure 7Implementation of the CNR4 (yellow), the LAS MkI receiver (orange), the K-type thermocouples (red), and the TDR sensors (cyan) on the BGW.
During the monitoring campaign in the summers of 2018 and 2019, the ET chamber was placed over the ground of the BGW for 2 min every 10 min to monitor the variation in the absolute humidity, carbon dioxide, net radiation, and temperature. It was accompanied by two thermocouples (one inside the chamber and one outside) and by a radiometer placed inside the chamber. These sensors were placed about 20 cm above the ground surface.
2.5 Data processing
The energy balance measurements from the LAS MkI, CNR4, and thermocouples were collected with a CR3000 datalogger (from Campbell Scientific®). A program was created using the LoggerNet software (i.e. from the same datalogger manufacturer) to communicate with the sensors and to collect and store the data. The LAS MkI manufacturer provides the EVATION software (Kipp&Zonen B.V, 2015) to users. It performs estimations of Qh using the monitored data as well as those collected from Météo-France, applying the iterative procedure presented previously. The resulting data are synthesized in a unique file (YYYY_MM_DD_Data_SEB.csv). Each line corresponds to a time step of 10 min for which every piece of information is recorded (the values are separated by a comma). The different columns are detailed in Appendix A.
The sensors associated with the ET chamber (gas analyser, radiometer, and thermocouples) were connected to a CR800 datalogger (from Campbell Scientific®) to collect measurements every second. A Python script was written to verify adequate correspondence between the installation and removal of the chamber and the increase in the absolute humidity rate. It determines an ET value for each installation of the chamber. The resulting data are synthesized in a unique file (YYYY_MM_DD_EvapotranspirationData.csv), and the contents of each column are detailed in Appendix A.
As already presented in detail in Versini et al. (2020), ka and Tsoil data from TDR sensors are transmitted to a CWB100 wireless base, which transfers them to a CR6 datalogger (from Campbell Scientific®). The data are collected and stored every night on the HM&Co server. Here, these data have been gathered with the help of a Python script to create a 10 min resolution time series for every campaign. They are stored in a specific file (YYYY_MM_DD_Data_WB.csv), in which each line corresponds to a time step for which both water content and temperature data are recorded (see Appendix A).
The daily monitoring campaigns were carried out during summers of 2018, 2019, and 2020. Unfortunately, not all measuring equipment was used at the same time during these periods. The data measured by the scintillometer in 2018 were not considered, as the sensor had to be recalibrated. Moreover, the transpiration chamber was out of order in 2020. Finally, the three measurement methods (energy balance, water balance, and transpiration chamber) were only simultaneously operational in 2019. Nevertheless, all daily campaigns measurements are made available and presented below. This dataset (Versini et al., 2023) is available for download from the following website: https://doi.org/10.5281/zenodo.8064053. The following references should be cited for every use of the data: Versini et al. (2023).
3.1 Presentation of the daily campaigns
Table 1 presents the different daily campaigns carried out during the 2018–2020 time period. For each date, the availability of the data regarding the three measurement methods is mentioned. In addition, some information concerning the hydrometeorological conditions is reported. Antecedent humidity was estimated for each date from the precipitation measured during the previous week by the Taranis platform (see Gires et al., 2018). The weather conditions were visually reported and classified into three categories (sunny, cloudy, or variable when clouds occasionally darkened the sky). The ranges of measured air temperature and net radiation are also mentioned.
Table 1Presentation of the daily campaigns and availability of the data.
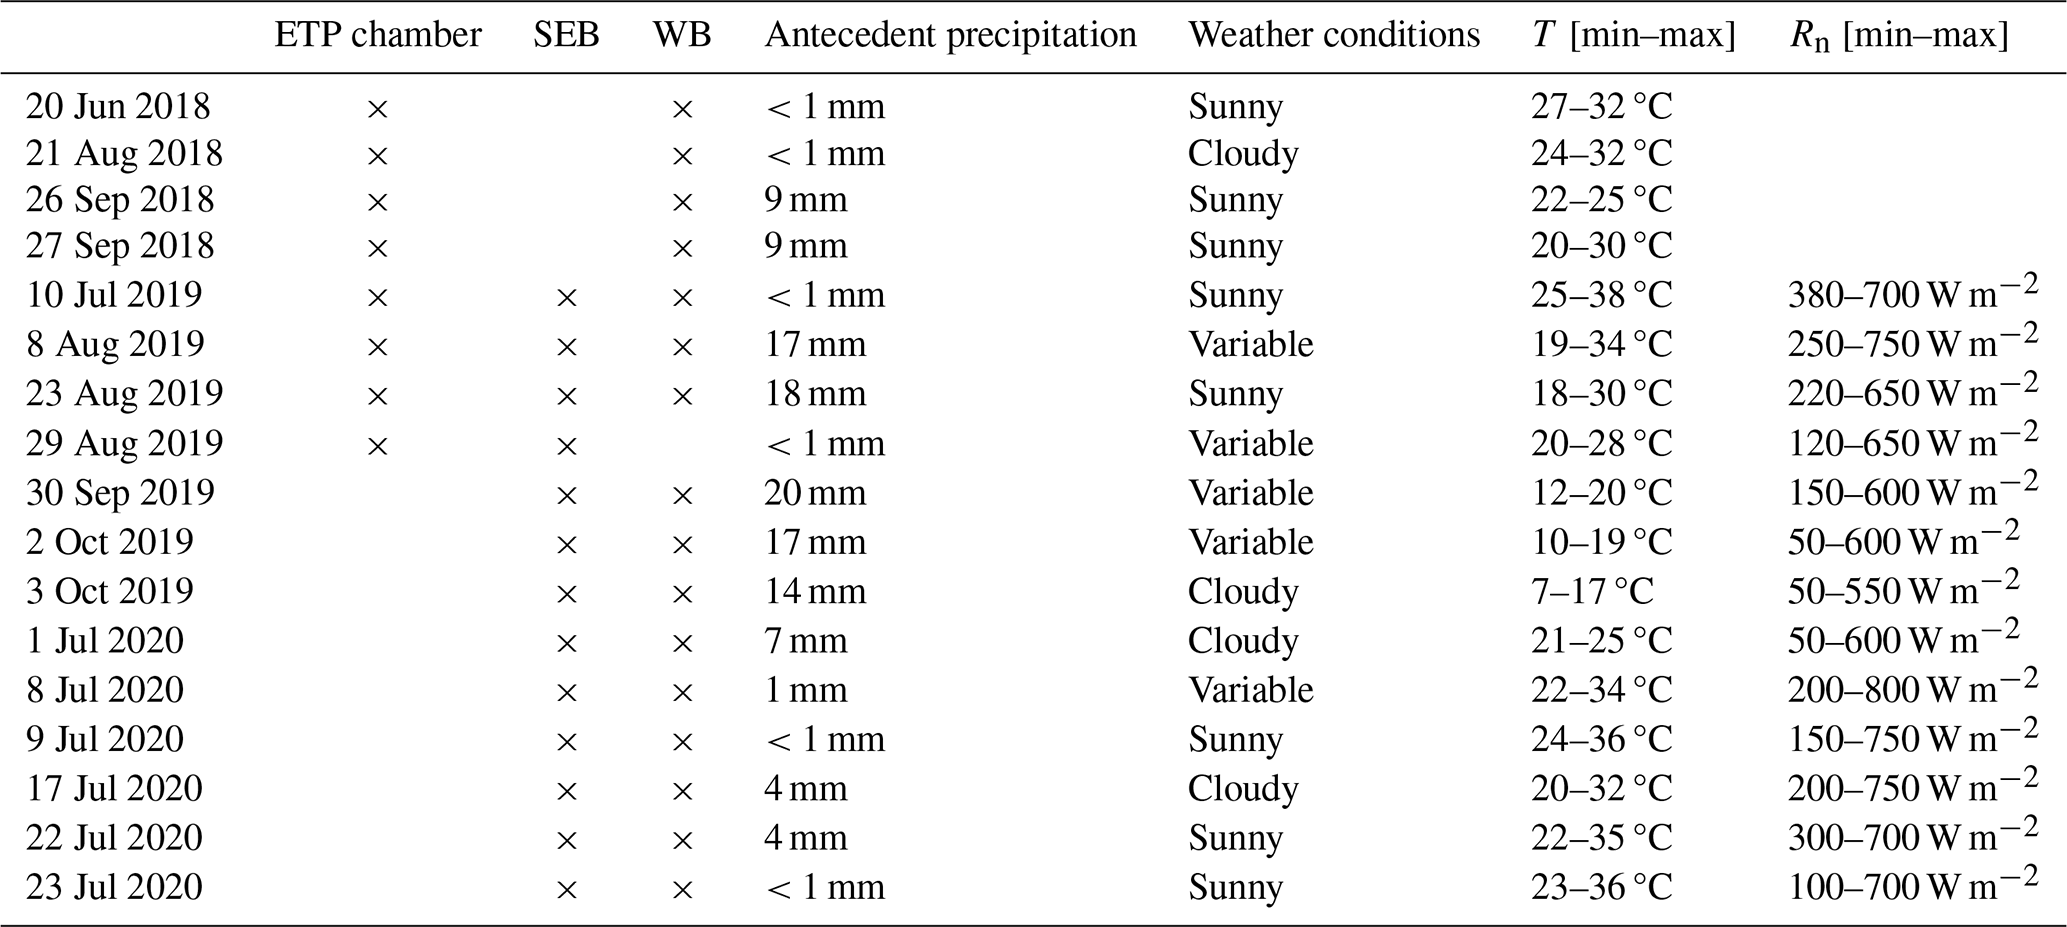
ETP chamber: evapotranspiration chamber; SEB: surface energy balance; WB: water balance.
3.2 Presentation of the available dataset and scripts
For each campaign day, a specific folder has been constructed (e.g. YYYY_MM_DD, 2019_07_10). Every folder contains three data files (when they exist) regrouping the measured data for the three different respective methods: surface energy balance, transpiration chamber, and water balance (YYYY_MM_DD_Data_SEB.csv, YYYY_MM_DD_ETCH.csv, and YYYY_MM_DD_Data_WB.csv, respectively).
For each method, a Python script has also been provided to select the monitoring campaign and the associated data, transform these data into physical variables, and carry out some initial analysis. An additional script is proposed to study and represent the soil, surface, and air temperatures computed from the different sensors. The four Python scripts (developed in Python 2.6) are presented in detail in the Appendix.
3.3 Presentation of an example
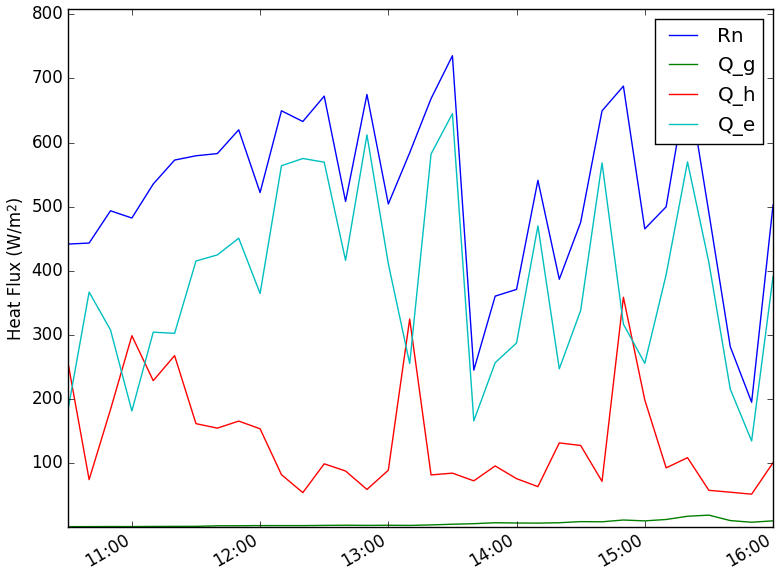
To illustrate the provided data and scripts, the daily campaign on the 8 August 2019 has been chosen. It has the advantage of being one of the days on which the three campaigns were simultaneously carried out. The weather conditions for this campaign were considered to be “variable”, with a blue sky crossed by some clouds during the day. In Fig. 8, it is clearly visible where the different components of the SEB are represented. The net radiation Rn fluctuates during the afternoon, reaching more than 700 W m−2 at around 13:30 LT (local time) and decreasing to 200 W m−2 at 16:00 LT. The sensible heat flux Qh also fluctuates, although within a smaller range (between 60 and 320 W m−2). The conduction flux Qg is the weakest flux, reaching 100 W m−2 at the end of the measurement campaign. It illustrates the inertia properties of the substrate, whose vertical gradient of temperature increases during the day (see also Fig. 11). The resulting latent heat flux Qe roughly follows Qh and varies between 100 and 600 W m−2.
The ET estimated with the chamber also fluctuates during the whole campaign (see Fig. 9), although between quite a different range of values (from 60 to 140 W m−2). The low values occurred around 14:00 LT, as for the SEB campaign. This can be explained by the presence of clouds in the sky, resulting in less radiative flux received and, therefore, less evapotranspiration. Although the order of magnitude is similar, the difference between the evapotranspiration values estimated using the two methods may be questionable. One reason for this difference can obviously be a measurement inconsistency, but it should also be remembered that these methods are carried out at two different spatial scales. The transpiration chamber estimates evapotranspiration on a rather homogeneous grass square metre, whereas SEB assesses it on a more heterogenous 100 m horizontal (but wavy) transept containing bulbs and grass.
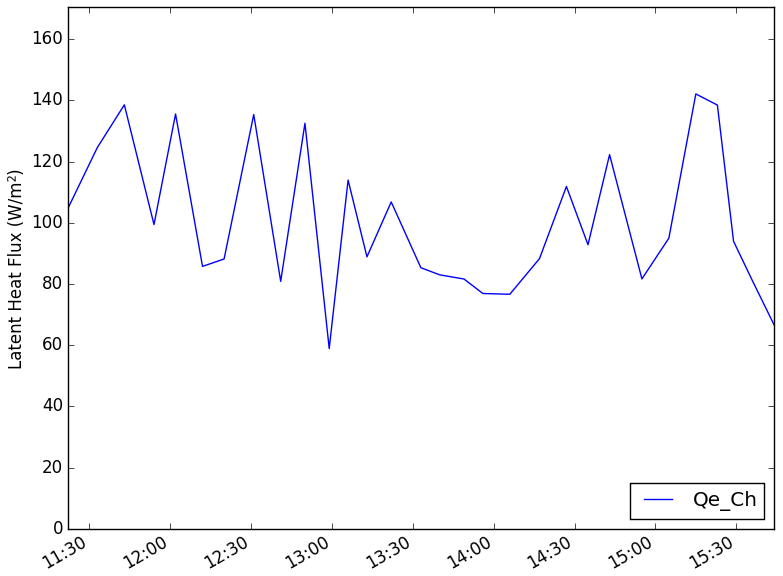
Figure 9Latent heat flux estimated by the transpiration chamber for the 8 August 2019 campaign.
Finally, the ET estimated from the water balance assessed by the TDR sensor network is represented in Fig. 10. The order of magnitude of the ET estimates, as well as their range, is similar to the two previous ones. In this case, the fluctuation can be explained by the small difference between two consecutive water content values, which can sometimes be negative. This is due to the resolution of the sensor, which is not actually adapted to the selected time step (10 min). Indeed, the measurement accuracy is supposed to be ±0.03 m3 m−3 for mineral soils, whereas the fluctuations measured on the BGW are of an order of magnitude of 10−4 m3 m−3.
Moreover, the 16 TDR sensors do not work together due to occasional malfunctions. Although they represent the same dynamic, the sensors show a significant variability in terms of absolute value. These differences illustrate the heterogeneity of this granular substrate in terms of pore size distribution and hydrological behaviour. It is worth noting that the water content value computed from the Topp equation (see Eq. 15) could also be negative. Indeed, this formula was developed for traditional soils, which are significantly different from granular substrates such as that present on the BGW. This difference is more pronounced during dry periods, when very low water content values are expected.
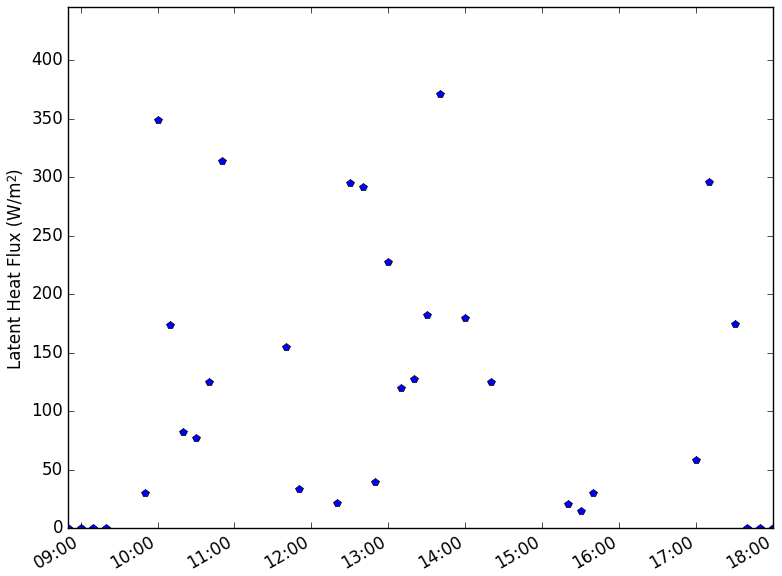
Figure 10Evapotranspiration estimated from the water balance for the 8 August 2019 campaign.
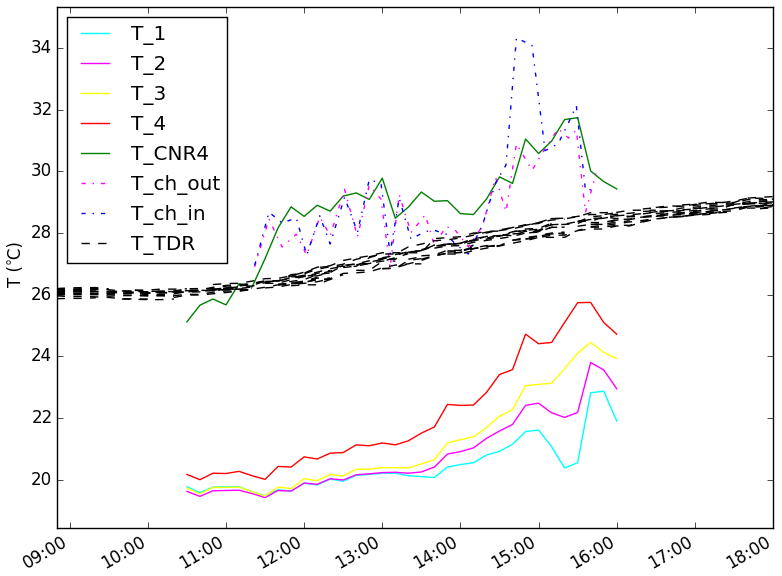
The different temperatures measured during the daily campaign are represented in Fig. 11. The different locations at which these measurements were made are clearly distinguishable. The soil temperatures (T_1, T_2, T_3, and T_4) follow the same trend and increase during the day. The vertical profile is also coherent with the lowest values at depth and the highest close to the surface. The difference, which was only a few tenths of a degree at the beginning of the day, can reach 1 °C at the end of the campaign. It illustrates the thermal inertia of the substrate. The surface temperature measured by the TDR sensors is less variable, ranging between 26 and 29 °C. In the shade of the sensor, the measurement does not consider direct radiation from the Sun or the atmosphere. Finally, the air temperature measurements are quite similar from one sensor to another. The most reliable ones seem to be the measurements performed by the thermocouples inside and outside of the chamber. They fluctuate together and match very well. Taker at higher elevation (1.5 m instead of 20 cm for the thermocouples), the temperature measurement carried out by the CNR4 is also in accordance and seems not to be influenced by the internal heat of the sensor.
This paper presents thermo-hydric data collected using three different methods to assess the evapotranspiration process at three different spatial scales: the first one is based on the surface energy balance (large scale), the second one is carried out by an evapotranspiration chamber and absolute humidity measurement (small scale), and the third one is based on the water balance evaluated during dry periods (point scale). In addition to these evapotranspiration estimates, several hydrometeorological data are made available: incident and reflected solar and atmospheric radiation; substrate, surface, and air temperature; water content; and the structure parameter of the refractive index of air. These data were collected during daily campaigns for three consecutive summers (2018, 2019, and 2020). The presented dataset is available for download free of charge from the following website: https://doi.org/10.5281/zenodo.8064053 (Versini et al., 2023). The dataset is provided by the Laboratory of Hydrology, Meteorology & Complexity of École des Ponts (HM&Co-ENPC). The following reference should be cited for every use of the data: Versini et al. (2023).
These measurements are useful to study the ability of nature-based solutions (NBSs) like green roofs to locally cool and mitigate urban heat islands. Evapotranspiration represents the key process responsible for this cooling effect. Therefore, the presented data can be used to increase knowledge of the estimation of evapotranspiration via the quantification of hydrometeorological variables. These data could also be used to develop, calibrate, and/or validate microclimate models (e.g. Solene-Microclimat – Malys et al., 2014; or ENVI-met – Liu et al., 2021) by considering NBSs in their applications.
The HM&Co-ENPC is still pursuing research activities on multiscale ecosystem services assessment of NBSs and on the use of the Blue Green Wave as a demonstrational experimental site. Monitoring campaigns will continue with a new scintillometer (Scintec SLS20) to study the spatio-temporal variability in the involved processes, particularly the sensible heat flux, as it is of great importance in the energy balance. Combined with the additional measurement methods, the objective is to improve the assessment of the evapotranspiration flux across scales.
This paper, which focussed on urban heat islands mitigation, complements a previous data paper focussed on hydrological data and the use of NBSs to manage stormwater (Versini et al., 2019). These data contribute to the improvement of the Multi-Hydro platform (El-Tabach et al., 2008; Qiu et al., 2021). Initially developed for rainfall–runoff modelling in urban environments, a first coupling with SOLENE-Microclimat was carried out during the EVNATURB project (https://hmco.enpc.fr/portfolio-archive/evnaturb/, last access: May 2024). It aimed to take advantage of the distributed modelling approach to propose a coupled modelling of thermic and hydrological processes. Some further efforts are required to improve this coupling and to reproduce the evapotranspiration flux at different spatial scales (from the infrastructure to the district scale).
A1 Read_Data_SEB.py
This Python script aims to read the data measured during the SEB campaigns. It is structured as follows:
-
Campaign selection. This part can be modified to select the monitoring campaign to be considered (13 dates are proposed).
-
Data selection and transformation. The associated data file corresponding to the measurement method is opened and read. The conduction heat flux is computed using soil temperature data and Eq. (14). The latent heat flux is also deduced from the energy balance equation following Eq. (2).
-
Representation of the computed data. A figure is proposed to illustrate and analyse the produced data. It represents the different components of the surface energy balance – net radiation computed with the radiometer (Rn), conduction heat flux computed with the thermocouples (Qg), sensitive heat flux computed with the scintillometer (Qh), and the latent heat flux deduced from the previous component (Qe).
A2 Read_Data_ETPCH.py
This Python script aims to read the data measured during the evapotranspiration chamber campaigns. It is structured as follows:
-
Campaign selection. This part can be modified to select the monitoring campaign to be considered (eight dates are proposed).
-
Data selection and transformation. The associated data file corresponding to the measurement method is opened, and the evapotranspiration deduced from Eq. (3) is read.
-
Representation of the computed data. The point measurements carried out by the evapotranspiration chamber are depicted in a specific figure.
A3 Read_Data_WB.py
This Python script aims to read and transform the data measured by the TDR water content sensors. It is structured as follows:
-
Campaign selection. This part can be modified to select the monitoring campaign to be considered (16 dates are proposed).
-
Data selection and transformation. Regarding the water balance method, the dielectric constant measured by the 16 TDR sensors is converted to the volumetric water content using the Topp equation (Eq. 15). It is possible to smooth these data using a moving window. The difference between two consecutive water content measures is then computed to estimate water loss. Finally, these values are transformed to latent heat flux using Eq. (17), and an average value for all available TDR sensors is computed.
-
Representation of the computed data. A first figure represents the volumetric water content computed from the Topp equation for the 16 TDR sensors. A second figure depicts the average resulting latent heat flux deduced from the TDR sensors.
A4 Read_Temperature.py
This Python script aims to read and compare the different temperature data (in the soil, on the surface, and in the air) measured during the different protocols. It is structured as follows:
-
Campaign selection. This part can be modified to select the monitoring campaign to be considered (17 dates are proposed).
-
Data selection. Depending on data availability, the data files corresponding to the three different methods are read. The temperature measurements are specifically extracted. They correspond to the soil temperature (measured from the thermocouples placed in the substrate layer), air temperature (from the CNR4 radiometer and from thermocouples in and outside the evapotranspiration chamber), and surface temperature (from the TDR sensors).
-
Representation of the computed data. These temperature data measured by the different sensors are depicted. The legend, the scale, and the time window are adapted depending on the availability of the data.
A5 Content of the data files
The content of each column of the SEB data file is as follows:
-
time step expressed as YYYY-MM-DD HH:MM;
-
item number;
-
internal temperature (°C);
-
upper pyranometer (solar radiation);
-
lower pyranometer;
-
external temperature (°C);
-
external temperature (K);
-
upper pyrgeometer (W m−2);
-
lower pyrgeometer (W m−2);
-
net solar radiation = (upper pyranometer) − (lower pyranometer) (W m−2);
-
net far-infrared radiation = (upper pyrgeometer) − (lower pyrgeometer) (W m−2);
-
albedo = (lower pyranometer) (upper pyranometer) (W m−2);
-
net radiation = (upper pyranometer + upper pyrgeometer) − (lower pyranometer + lower pyrgeometer) (W m−2);
-
soil temperature 1 (°C);
-
soil temperature 2 (°C);
-
soil temperature 3 (°C);
-
soil temperature 4 (°C);
-
relative humidity (%);
-
pressure (hPa);
-
wind velocity (m s−1);
-
wind direction (°);
-
net radiation (W m−2);
-
log of Cn2 structure function PUCn2 (V);
-
Sig_PUCn2 (V);
-
received fluctuation intensity (Udemod) (mV);
-
variance in the received fluctuation intensity Sig_Udemod (mV);
-
conduction heat flux (W m−2);
-
sensitive heat flux (W m−2);
-
Bowen coefficient;
-
estimated latent heat flux (W m−2).
The content of each column of the evapotranspiration chamber data file is as follows:
-
time step expressed as YYYY-MM-DD HH:MM:SS;
-
estimation of the latent heat flux (W m−2);
-
net radiation (W m−2);
-
external temperature (°C);
-
internal temperature (°C).
The content of each column of the TDR data file is as follows:
-
exact definition of the time step expressed in YYYY-MM-DD HH:MM;
-
item number;
-
volumetric water content (expressed as dielectric permittivity) for the 16 TDR sensors;
-
temperature (expressed in °C) for the 16 TDR sensors.
A6 Glossary of the variables
| Structure function of the refraction index of air n (–) | |
| ET | Evapotranspiration (mm h−1) |
| I | Irrigation (mm h−1) |
| ka | Soil dielectric permittivity (–) |
| Lwin | Sky longwave radiation (W m−2) |
| Lwout | Ground longwave radiation (W m−2) |
| P | Precipitation (mm h−1) |
| q | Absolute humidity (g m−3) |
| Q | Relative humidity (%) |
| Qe | Latent heat flux (W m−2) |
| Qg | Heat conduction into the soil substrate (W m−2) |
| Qh | Sensible heat flux (W m−2) |
| Qr | Runoff (mm h−1) |
| Rn | Net radiative flux (W m−2) |
| S | Water stored in the soil (mm) |
| Swin | Incident solar or shortwave radiation (W m−2) |
| Swout | Reflected solar or shortwave radiation (W m−2) |
| T | Air temperature (K) |
| u∗ | Friction velocity (m s−1) |
| VWC | Volumetric water content (m3 m−3) |
PAV supervised the study, wrote a large part of the manuscript and the Python scripts, and reviewed the manuscript. LACD wrote a significant part of the manuscript and the scripts, carried out the measurement campaigns and the collection of the data, and participated in the review of the paper. DR and IT collaborated on the study supervision and the review process.
The contact author has declared that none of the authors has any competing interests.
Publisher's note: Copernicus Publications remains neutral with regard to jurisdictional claims made in the text, published maps, institutional affiliations, or any other geographical representation in this paper. While Copernicus Publications makes every effort to include appropriate place names, the final responsibility lies with the authors.
This work has been supported by the Agence Nationale de la Recherche (grant no. ANR-17-CE22-0002-01) through the EVNATURB project dealing with the evaluation of ecosystem performance for renaturing urban environments. It has also been supported by the Academic Chair of “Hydrology for Resilient Cities”, a partnership between École des Ponts ParisTech and the Veolia company. The authors are particularly grateful to Georges Najjar from the University of Strasbourg for providing the MkI scintillometer, to Cerema for the evapotranspiration chamber, and to the Kipp&Zonen B.V. company for their support concerning sensor implementation.
This research has been supported by the Agence Nationale de la Recherche (grant no. ANR-17-CE22-0002-01).
This paper was edited by Di Tian and reviewed by two anonymous referees.
Ayata, T., Tabares-Velasco, P. C., and Srebric, J.: An investigation of sensible heat fluxes at a green roof in a laboratory setup, Build. Environ., 46, 1851–1861, https://doi.org/10.1016/j.buildenv.2011.03.006, 2011.
Cascone, S., Catania, F., Gagliano, A., and Sciuto, G.: A comprehensive study on green roof performance for retrofitting existing buildings, Build. Environ., 136, 227–239, https://doi.org/10.1016/j.buildenv.2018.03.052, 2018.
Castellanos, L. A.: Deploying nature-based solutions in urban areas : thermal performance and urban feasibility across scales, Environment and Society, École des Ponts ParisTech, https://pastel.hal.science/tel-03764898 (last access: May 2024), 2022.
Cirkel, D. G., Voortman, B. R., Van Veen, T., and Bartholomeus, R. P.: Evaporation from (Blue-)Green Roofs: Assessing the Benefits of a Storage and Capillary Irrigation System Based on Measurements and Modeling, Water, 10, 1253, https://doi.org/10.3390/w10091253, 2018.
Coutts, A. M., Daly, E., Beringer, J., and Tapper, N. J.: Assessing practical measures to reduce urban heat: Green and cool roofs, Build. Environ., 70, 266–276, https://doi.org/10.1016/j.buildenv.2013.08.021, 2013.
de Munck, C. S., Lemonsu, A., Bouzouidja, R., Masson, V., and Claverie, R.: The GREENROOF module (v7.3) for modelling green roof hydrological and energetic performances within TEB, Geosci. Model Dev., 6, 1941–1960, https://doi.org/10.5194/gmd-6-1941-2013, 2013.
DiGiovanni, K., Montalto, F., Gaffin, S., and Rosenzweig, C.: Applicability of Classical Predictive Equations for the Estimation of Evapotranspiration from Urban Green Spaces: Green Roof Results, J. Hydrol. Eng., 18, 99–107, https://doi.org/10.1061/(ASCE)HE.1943-5584.0000572, 2013.
Duffaut, C., Frascaria-Lacoste, N., and Versini, P.-A.: Are really Nature-Based Solutions sustainable solutions to design future cities in a context of global change? Discussion about the vulnerability of these new solutions and their probable unsustainable implementation, Sci. Total Environ., 853, 158535, https://doi.org/10.1016/j.scitotenv.2022.158535, 2022.
El Tabach, E., Tchiguirinskaia, I., and Schertzer, D.: Modelling and managing runoff processes in peri-urban area, AGU Fall meeting, 2008, San Francisco, United States, hal-00742388, 2008.
European Commission, Directorate-General for Research and Innovation: Towards an EU research and innovation policy agenda for nature-based solutions & re-naturing cities – Final report of the Horizon 2020 expert group on “Nature-based solutions and re-naturing cities” – (full version), Publications Office, 2015, https://doi.org/10.2777/479582, 2015.
Gires, A., Tchiguirinskaia, I., and Schertzer, D.: Two months of disdrometer data in the Paris area, Earth Syst. Sci. Data, 10, 941–950, https://doi.org/10.5194/essd-10-941-2018, 2018.
Guyot, A., Cohard, J.-M., Anquetin, S., Galle, S., and Lloyd, C. R.: Combined analysis of energy and water balances to estimate latent heat flux of a sudanian small catchment, J. Hydrol., 375, 227–240, https://doi.org/10.1016/j.jhydrol.2008.12.027, 2009.
Heusinger, J. and Weber, S.: Surface energy balance of an extensive green roof as quantified by full year eddy-covariance measurements, Sci. Total Environ., 577, 220–230, https://doi.org/10.1016/j.scitotenv.2016.10.168, 2017.
Kipp&Zonen B.V.: CNR4 Net Radiometer. Instruction Manual, 37 pp., https://www.kippzonen.com/Download/354/Manual-CNR-4-Net-Radiometer-English-V2104 (last access: May 2024), 2014.
Kipp&Zonen B.V: EVATION, Kipp & Zonen B.V., https://www.kippzonen.com/Download/733/EVATION-V2R5-Software (last access: May 2024), 2015.
Li-COR Biosciences: LI-830 and LI-850 Gas Analyzers For Continuous Monitoring Applications, 7 pp., https://labinstruments.ru/upload/5_4249901b904-LI-830_LI-850_Brochure_17196-min.pdf (last access: May 2024), 2017.
Liu, Z., Cheng, W., Jim, C. Y., Morakinyo, T. E., Shi, Y., and Ng, E.: Heat mitigation benefits of urban green and blue infrastructures: A systematic review of modeling techniques, validation and scenario simulation in ENVI-met V4, Build. Environ., 200, 107939, https://doi.org/10.1016/j.buildenv.2021.107939, 2021.
Maksimovic, C., Stankovic, S., Liu, X., and Lalic, M.: Blue green dream project's solution for urban areas in the future, Inter-national science conference reporting for sustainability, 7–10 May 2013, Becici, Montenegro, 49–54, 2013.
Malys, L., Musy, M., and Inard, C.: A hydrothermal model to assess the impact of green walls on urban microclimate and building energy consumption, Build. Environ., 73, 187–197, 2014.
Marasco, D. E., Culligan, P. J., and McGillis, W. R.: Evaluation of common evapotranspiration models based on measurements from two extensive green roofs in New York City, Ecol. Eng., 84, 451–462, https://doi.org/10.1016/j.ecoleng.2015.09.001, 2015.
Meijninger, W. M. L., Green, A. E., Hartogensis, O. K., Kohsiek, W., Hoedjes, J. C. B., Zuurbier, R. M., and De Bruin, H. A. R.: Determination of Area-Averaged Water Vapour Fluxes with Large Aperture and Radio Wave Scintillometers over a Heterogeneous Surface – Flevoland Field Experiment, Bound.-Lay. Meteorol., 105, 63–83, https://doi.org/10.1023/A:1019683616097, 2002.
Moene, A. F.: Effects of water vapour on the structure parameter of the refractive index for near-infrared radiation, Bound.-Lay. Meteorol., 107, 635–653, https://doi.org/10.1023/A:1022807617073, 2003.
Moorhead, J., Marek, G., Colaizzi, P., Gowda, P., Evett, S., Brauer, D., Marek, T., and Porter, D.: Evaluation of Sensible Heat Flux and Evapotranspiration Estimates Using a Surface Layer Scintillometer and a Large Weighing Lysimeter, Sensors, 17, 2350, https://doi.org/10.3390/s17102350, 2017.
Oke, T. R.: The energetic basis of the urban heat island, Q. J. Roy. Meteor. Soc., 108, 1–24, https://doi.org/10.1002/qj.49710845502, 1982.
Oke, T. R.: Boundary Layer Climates, 2nd edn., Routledge, https://doi.org/10.4324/9780203407219, 1987.
Ouédraogo, A. A., Berthier, E., Ramier, D., Tan, Y., and Gromaire, M.-C.: Quantifying Evapotranspiration Fluxes on Green Roofs: A Comparative Analysis of Observational Methods, STOTEN, 902, 166135, https://doi.org/10.1016/j.scitotenv.2023.166135, 2023.
Poë, S., Stovin, V., and Berretta, C.: Parameters influencing the regeneration of a green roof's retention capacity via evapotranspiration, J. Hydrol., 523, 356–367, https://doi.org/10.1016/j.jhydrol.2015.02.002, 2015.
Qiu, Y., da Silva Rocha Paz, I., Chen, F., Versini, P.-A., Schertzer, D., and Tchiguirinskaia, I.: Space variability impacts on hydrological responses of nature-based solutions and the resulting uncertainty: a case study of Guyancourt (France), Hydrol. Earth Syst. Sci., 25, 3137–3162, https://doi.org/10.5194/hess-25-3137-2021, 2021.
Ramier, D., Chollet, J., Berthier, E., Sabre, M., Tétard, Y., Flori, J.-P., and Bouyer, J.: Mesure de l'évapotranspiration à petite échelle spatiale: applications aux toitures végétalisées, Journée Scientifique du SIRTA, Palaiseau, France, https://sirta.ipsl.polytechnique.fr/documents/JSS2015/posters/JSS2015_poster-A5_Ramier.pdf (last access: May 2024), 2015.
Rana, G. and Katerji, N.: Measurement and estimation of actual evapotranspiration in the field under Mediterranean climate: a review, Eur. J. Agron., 13, 125–153, https://doi.org/10.1016/S1161-0301(00)00070-8, 2000.
Sharma, A., Conry, P., Fernando, H. J. S., Hamlet, A. F., Hellmann, J. J., and Chen, F.: Green and cool roofs to mitigate urban heat island effects in the Chicago metropolitan area: evaluation with a regional climate model, Environ. Res. Lett., 11, 064004, https://doi.org/10.1088/1748-9326/11/6/064004, 2016.
Stanic, F., Cui, Y. J., Versini, P.-A., Schertzer, D., and Tchiguirinskaia, I.: A device for the simultaneous determination of the water retention properties and the hydraulic conductivity of an unsaturated green-roof material, Geotechnical Testing Journal, 43, 547–564, 2020.
Stovin, V., Vesuviano, G., and Kasmin, H.: The hydrological performance of a green roof test bed under UK climatic conditions, J. Hydrol., 414–415, 148–161, https://doi.org/10.1016/j.jhydrol.2011.10.022, 2012.
Tabares, P. C. and Srebric, J.: A heat transfer model for assessment of plant based roofing systems in summer conditions, Build. Environ., 49, 310–323, https://doi.org/10.1016/j.buildenv.2011.07.019, 2012.
Thorp, R.: Observations of heat, water vapor and carbon dioxide exchanges over a living roof using eddy covariance, San Francisco State University, 2014.
Topp, G. C., Davis, J. L., and Annan, A. P.: Electromagnetic determination of soil water content: Measurements in coaxial transmission lines, Water Resour. Res., 16, 574–582, https://doi.org/10.1029/WR016i003p00574, 1980.
Valayamkunnath, P., Sridhar, V., Zhao, W., and Allen, R. G.: Intercomparison of surface energy fluxes, soil moisture, and evapotranspiration from eddy covariance, large-aperture scintillometer, and modeling across three ecosystems in a semiarid climate, Agric. Forest Meteorol., 248, 22–47, https://doi.org/10.1016/j.agrformet.2017.08.025, 2018.
Vera, S., Pinto, C., Tabares-Velasco, P. C., Bustamante, W., Victorero, F., Gironás, J., and Bonilla, C. A.: Influence of vegetation, substrate, and thermal insulation of an extensive vegetated roof on the thermal performance of retail stores in semiarid and marine climates, Energ. Buildings, 146, 312–321, https://doi.org/10.1016/j.enbuild.2017.04.037, 2017.
Vera, S., Pinto, C., Tabares-Velasco, P. C., and Bustamante, W.: A critical review of heat and mass transfer in vegetative roof models used in building energy and urban enviroment simulation tools, Appl. Energy, 232, 752–764, https://doi.org/10.1016/j.apenergy.2018.09.079, 2018.
Versini, P.-A., Stanic, F., Gires, A., Schertzer, D., and Tchiguirinskaia, I.: Measurements of the water balance components of a large green roof in the greater Paris area, Earth Syst. Sci. Data, 12, 1025–1035, https://doi.org/10.5194/essd-12-1025-2020, 2020.
Versini, P.-A., Castellanos-Diaz, L. A., Ramier, D., and Tchiguirinskaia, I.: Evapotranspiration evaluation by 3 different protocols on a large green roof in the greater Paris area, Zenodo [data set], https://doi.org/10.5281/zenodo.8064053, 2023.
Voyde, E., Fassman, E., Simcock, R., and Wells, J.: Quantifying Evapotranspiration Rates for New Zealand Green Roofs, J. Hydrol. Eng., 15, 395–403, https://doi.org/10.1061/(ASCE)HE.1943-5584.0000141, 2010.
Wadzuk, B. M., Schneider, D., Feller, M., and Traver, R. G.: Evapotranspiration from a Green-Roof Storm-Water Control Measure, J. Irrig. Drain. E., 139, 995–1003, https://doi.org/10.1061/(ASCE)IR.1943-4774.0000643, 2013.
Yang, J., Mohan Kumar, D., llamathy, Pyrgou, A., Chong, A., Santamouris, M., Kolokotsa, D., and Lee, S. E.: Green and cool roofs' urban heat island mitigation potential in tropical climate, Solar Energ., 173, 597–609, https://doi.org/10.1016/j.solener.2018.08.006, 2018.
Yee, M. S., Pauwels, V. R. N., Daly, E., Beringer, J., Rüdiger, C., McCabe, M. F., and Walker, J. P.: A comparison of optical and microwave scintillometers with eddy covariance derived surface heat fluxes, Agric. Forest Meteorol., 213, 226–239, https://doi.org/10.1016/j.agrformet.2015.07.004, 2015.