Since the turn of the century, we have experienced a radical shift in the way companies market their products. The consumerist society of the 20th century has been enhanced with a wave of romanticism. These insights come from Yuval Noah Hariri’s book Sapiens, where he says:
Romanticism tells us that in order to make the most of our human potential we must have as many different experiences as we can.
Consumerism tells us that in order to be happy we must consume as many products and services as possible
Through social media, and novel methods of communicating, brands have had to move from selling products to selling experiences.
This echoes deeply with Amy Giuffre's, Harley-Davidson’s (NYSE:HOG) director of investor relations, words during the last earnings call:
A year ago, we began our critical mindset and cultural shift at the company from we build motorcycles to we build riders
The opportunity for businesses has been huge, you’re not buying the motorcycle, you’re buying into the type of person having a motorcycle makes you.
Brands which embraced this approach ten years ago have reaped the benefits, whereas 20th century legacy companies which have been late to the game have struggled to compete.
Harley-Davidson has been operating in an extremely tough US market since 2006 when motorcycle sales peaked. Sales have been about half of that since then, never really recovering.
To make matters tougher, close to 50% of motorbike owners in the US are over 50 years old. This means a large number of consumers might only be buying one more bike in their lifetime.
The obvious shift is to turn towards millennials. This comes for two major hurdles for Harley-Davidson:
- More affordable options need to be available for first-time riders.
- They need to appeal to a different segment's values.
While Harley-Davidson has taken measures to address these, through the introduction of sub $12k bikes and the announcement of a new electric bike, sales are still down and will continue to decrease in 2018. As such given the amount of uncertainty involved in turning the company around, I will wait for either: a) a price point which gives me a better yield or b) confirmation that their efforts are paying off.
I can only advise fellow dividend growth investors to refrain from purchasing at this price.
Fourth-quarter earnings declined by 82% compared to Q4 2016, on revenues which were 12% stronger. During the last 12 months, the company’s stock price has declined by 24% to $42. Harley-Davidson increased their dividend by 1.3% giving the company a 3.6% dividend yield, thus introducing it into my screener.
The S.A.F.E. dividend stock screener is designed to find stocks which have attractive yields, a history of dividend increases, room to grow the dividend, and whose financial condition ensures dividend stability.
It screens on five criteria:
- Dividend yield greater than 3%.
- Payout ratio less than 70%
- Current ratio greater than 1x
- At least 5 years of consecutive dividend payments
- And a positive P/E Ratio.
The two first elements are the most important ratios in the screener. They ensure that I'm getting a yield which I am content with, without horrifying payout ratios. The dividend streak shows some commitment from management to return cash to investors. Positive P/E means the company generated positive net income in the last year, so I know we are not looking at companies that are losing money. The current ratio is a sanity check to only include companies which can cover their short-term liabilities.
This method only gives you a handful of results at any point in time. I like this because I can focus my efforts on a handful of stocks. The obvious shortfall is that some very good dividend growers will be excluded. You can still apply the rest of the framework to any dividend paying stock, this screener gives you a starting point.
Harley-Davidson fits the bill in every single respect, as the table below suggests.
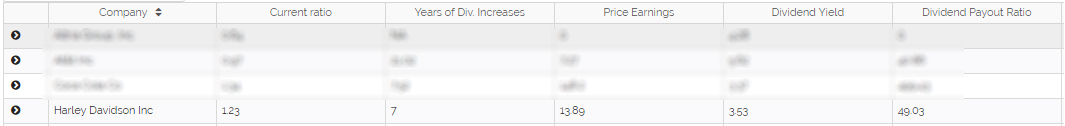
Source: uuptick
The S.A.F.E. Dividend Method is a framework developed by my son Sam and myself to uncover undervalued dividend growth stocks.
Within our framework, I analyze in detail any stock which makes it into our screener. I monitor the screener weekly for new entrants as well as exits.
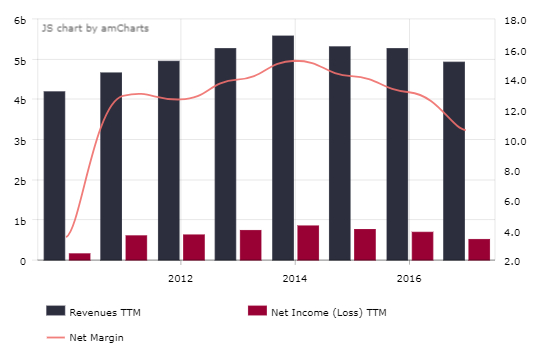
Revenues And Net Income
Harley-Davidson's revenues have grown at a compound annual growth rate (CAGR) of - 0.11% vs. 3% for the S&P 500; Harley-Davidson's earnings underperformed even more at a -3.5% CAGR vs. +5.6% for the S&P 500.
 Source: uuptick
The momentum the company started to build with top-line figures between 2010 and 2014 reversed in subsequent years. The pressure from lower unit sales has been combined with lower gross margins. This is a result of a different product mix, with lower margin bikes being introduced onto the market.
Net income has suffered as a direct consequence. The rest of the company’s cost structure has remained mostly flat. SG&A cuts of $41mn in 2017 come short of making up for the haemorrhaging sales.
Historical Payout Ratio & Outlook
The next thing I do is look at the company's payout ratio relative to its historical value. I also look at the evolution of the two underlying line items: net income and dividends.
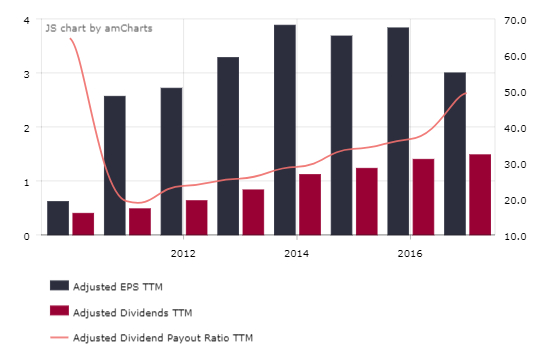
Harley-Davidson has maintained a payout ratio between 20% and 50% throughout the latest 7 years. This is a definitive positive, since the company still has ample room to increase its dividend. However, the aggressive increases in dividends have outpaced earnings which were lower in 2017 than in 2013. This indicates that dividend increases will probably slow down dramatically until the company figures out how to appeal to a large number of younger riders. This was reflected by the $0.005 increase Harley-Davidson announced for this year, way below what they got investors used to.
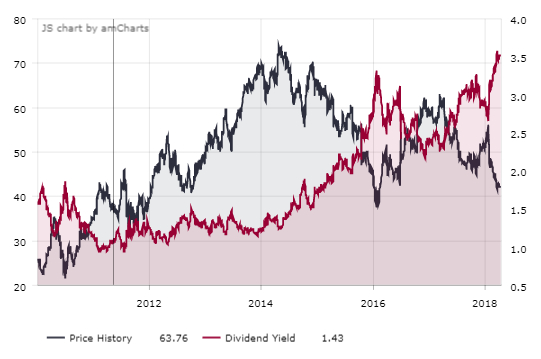
Historical Dividend Yield
I then look at the company's dividend yield compared to its historical value.
 Source: uuptick
Harley-Davidson has historically yielded between 1% and 3.5%. The dividend yield is now at a historical high. Since initiating a dividend, investors have never had the opportunity to invest at such a high yield.
This is a positive since it is a first indicator of potential undervaluation.
Price Action
It goes without saying that the near linear increase in dividend yield since 2014 has been a function of both dividend increases and steady declining share price. The stock price is now 45% lower than its 2014 peak.
 Source: uuptick
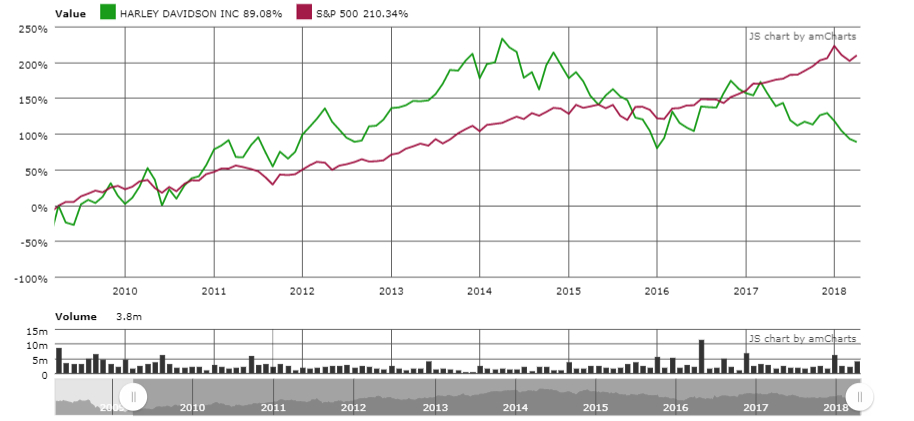
Harley-Davidson’s performance outperformed the S&P 500 for the better part of the first 7 years of this bull market. It is only since 2017 that the company started to severely underperform the benchmark, given back a good portion of the gains which were previously acquired.
Safety Of The Dividend
Next I need to assess the safety of the dividend, since the stock has a historically high yield.
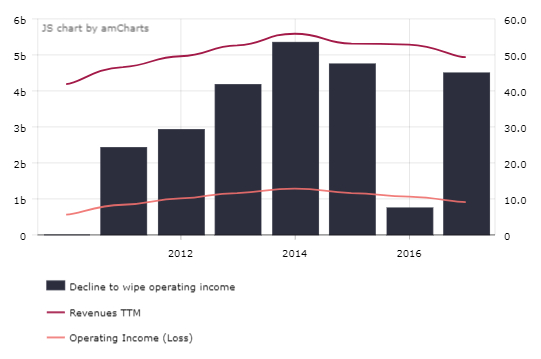
I will look at the degree of operating leverage (DOL) for our security, and how it evolved over the last business cycle. This allows me to estimate the decline in revenues required to wipe out operating income.
 Source: uuptick
In the real world, you sometimes get a negative relationship between revenues and operating income, in which case the data isn't workable. You also get a high standard deviation with so few observations.
However, it is interesting to look at the range of values: here between 30% and 50%. In other words, so long as revenues don't drop by 30%, the company will continue to produce positive operating income.
This is a positive element which proves that Harley-Davidson is operating well above break-even, meaning that they have some downside cushion before wiping operating income directly.
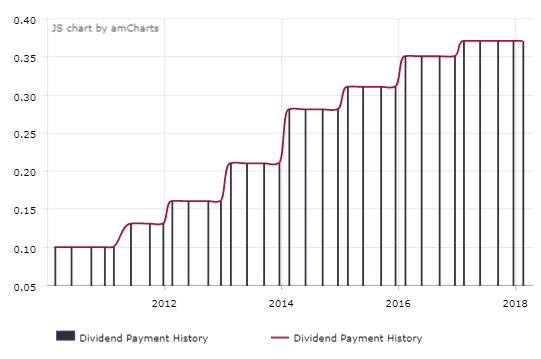
I also want to know that the company has shown dedication to increase its dividend over time. Harley-Davidson has been increasing its dividend every year for the last 8 years by different amounts. This is not on the level of other dividend champion companies. However, it leads to believe the management is starting to build a strong level of commitment towards maintaining the streak. The symbolic $0.005 increase per quarter this year testifies management’s will to keep the streak going.
 Source: uuptick
As you can see, hikes have been as low as 1% this last year. The remaining years, the dividend has grown at rates between 10% and 35%. Harley-Davidson started out with a small dividend, which it has increased aggressively throughout the last few years.
When initiating a dividend, a company sends a strong message to the market: we don’t have enough investment opportunities which meet our required ROIC, and are thus returning money to investors.
While I have no problems with this practice, as a dividend investor, it does signal that we can probably no longer expect aggressive top and bottom line increases. On the other hand, it is a mark of responsible corporate governance, and I appreciate this.
Despite the industry’s headwinds, I believe Harley-Davidson has the financial situation to maintain its dividend and even grow it in upcoming years.
Value Of The Dividend Stream
Next up is figuring out what I want to pay for a stock which pays $1.48 in dividends per year, which I will assume grows at 4% per year.
I run a simple DDM Model three times adjusting the dividend growth rate by +/- 1%. I then divide these values by the price to see what portion of the stock price can be attributed to the dividend stream, and what premium I must pay for exposure to potential stock appreciation.
I assume a constant 10% discount rate for every equity I analyse, which allows me to compare the stocks within my screener’s theoretical value to their stock price.
For Harley-Davidson this gives us a value between $22 and $31, or between 53% and 75% of the current share price.
Given the huge challenges of the motorcycle industry, I don’t have the stomach to pay much for the part of the business which is not being returned as cash to shareholders.
I would like to see the price come down some more to make me comfortable.
Relative Valuation
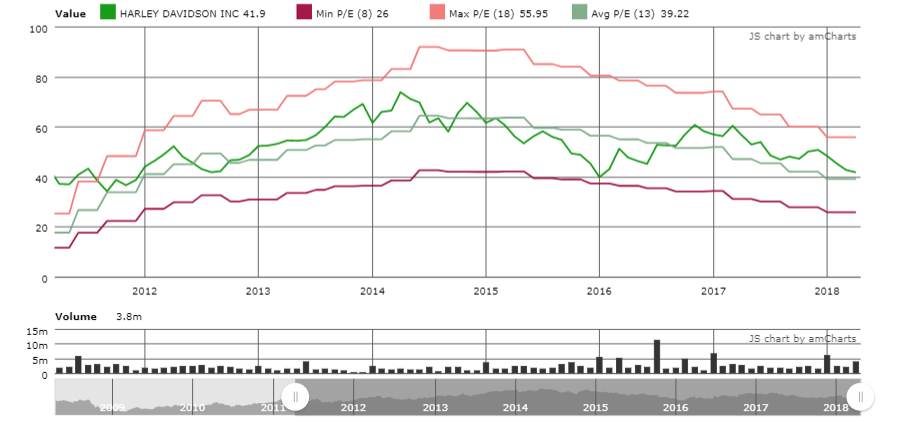
I then look at Peter Lynch P/E lines over the last 5 years. A Peter Lynch P/E line gives you the theoretical price at a point in time if the stock traded at a certain multiple of earnings. I look at the P/E line for the average 5-year P/E as well as the minimum and maximum P/E over the same period.
 Source: uuptick
As you can see, Harley-Davidson is trading around its average P/E multiple for the last 5 years. Harley-Davidson’s stock price has tracked earnings very closely for the last 7 years, spending most of the time trading between a 10x and 15x multiple of earnings.
Given that earnings are expected to decline in 2018, I would not be surprised to see the stock price follow suit.
Conclusion
Harley-Davidson is at a crossroads. It is betting big on millennials to keep the company cruising for the next 50 years, but has yet to prove that these efforts have paid off.
I’m uncomfortable betting on the turnaround at the current price, and would need a higher yield to get interested.
I don’t believe the worst is over yet for the company and, as such, believe the stock price will come down more.
I would reconsider my position if the stock drops more, to around $35, if the company’s results can give some indication that their long-term plays will pay off.
I will be analyzing other stocks which are in my S.A.F.E. stock screener during the next few weeks. So if you enjoyed this article please follow me and don't hesitate to ask any questions you might have.