Broward County Public Schools, Florida
| Broward County Public Schools |
|---|
| Fort Lauderdale, Florida |
| District details |
| Superintendent: Peter Licata |
| # of school board members: 9 |
| Website: Link |
Broward County Public Schools is a school district in Florida.
Click on the links below to learn more about the school district's...
- Superintendent
- School board
- Elections
- Budget
- Teacher salaries
- Academic performance
- Student enrollment
- Demographics
- Contact information
Superintendent
| |
This information is updated as we become aware of changes. Please contact us with any updates. |
Peter B. Licata is the superintendent of Broward County Public Schools. He was appointed to the position on July 11, 2023. Licata's previous career experience includes serving as regional superintendent of Palm Beach County school district.[1]
Past superintendents
- From February 7, 2023 until July 11, 2023, Valerie Wanza served as acting superintendent, and Earline Smiley served as interim superintendent.[2]
- Vickie Cartwright was the superintendent of Broward County Public Schools from August 2, 2021 until February 7, 2023.[3] Cartwright's previous career experience includes working as the superintendent of the Oshkosh Area School District in Wisconsin and as associate superintendent for exceptional learning education for Orange County Public Schools.[2]
- Robert W. Runcie was the superintendent of Broward County Public Schools. Runcie was appointed superintendent in 2011. He stepped down in 2021. Runcie's previous career experience included working in Chicago Public Schools as a chief information officer and chief of staff to the board of education.[4][5]
School board elections
The Broward County school district is overseen by a nine-member board elected to four-year terms. Seven members are elected to geographic districts, and two members are elected to at-large seats.[6]
On August 26, 2022, Governor Ron DeSantis (R) suspended Laurie Rich Levinson, Patricia Good, Donna Pilger Korn, and Ann Murray for misuse of authority, neglect of duty, and incompetence; and appointed Torey Alston, Manuel Serrano, Ryan Reiter, and Kevin Tynan to the board to fill the vacancies.[7][8] DeSantis said the suspensions were a result of a statewide grand jury report on the investigation of the school district's handling of the 2018 mass shooting at Marjory Stoneman Douglas High School in Parkland, Florida.[9] "It is my duty to suspend people from office when there is clear evidence of incompetence, neglect of duty, misfeasance or malfeasance," said DeSantis. "The findings of the Statewide Grand Jury affirm the work of the Marjory Stoneman Douglas School Safety Commission. We are grateful to the members of the jury who have dedicated countless hours to this mission and we hope this suspension brings the Parkland community another step towards justice. This action is in the best interest of the residents and students of Broward County and all citizens of Florida.”[8][10] In a written statement to The Miami Herald, Rich Levinson said, “What country is this? What Governor DeSantis did is un-American and undemocratic ... He doesn’t care about democracy and overturned the will of the voters. ... This is all about political retribution for not firing Superintendent Runcie. It’s about blaming the Superintendent, and any School Board Members who supported him, for the Marjory Stoneman Douglas shooting. Governor DeSantis impaneled a Grand Jury, under the guise of school safety, as a pretext to remove School Board Members who did not fire the former Superintendent. Do future Board Members need to pre-clear their votes with DeSantis? Could future Democratic Governors now remove locally elected Republicans?”[11]
| Office | Name | Date assumed office |
|---|---|---|
| Broward County Public Schools school board At-large Seat 8 | Allen Zeman | November 22, 2022 |
| Broward County Public Schools school board At-large Seat 9 | Debra Hixon | November 17, 2020 |
| Broward County Public Schools school board District 1 | Daniel Foganholi | 2022 |
| Broward County Public Schools school board District 2 | Torey Alston | 2022 |
| Broward County Public Schools school board District 3 | Sarah Leonardi | November 17, 2020 |
| Broward County Public Schools school board District 4 | Lori Alhadeff | 2018 |
| Broward County Public Schools school board District 5 | Jeff Holness | November 22, 2022 |
| Broward County Public Schools school board District 6 | Brenda Fam | November 22, 2022 |
| Broward County Public Schools school board District 7 | Nora Rupert | 2010 |
| |
This officeholder information was last updated on March 11, 2024. Please contact us with any updates. | |
Election dates
Elections are held on a staggered basis in the November general election.[12]
Five seats on the board are up for general election on November 5, 2024. A primary is scheduled for August 20, 2024.
Public participation in board meetings
The Broward County Public Schools school board maintains the following policy on public testimony during board meetings:[13]
| “ |
IV. Public Participation VI. PUBLIC PARTICIPATION
|
” |
Budget
From 1993 to 2013, the Broward school district had an average of $1,992,717,286 in revenue and $2,094,252,095 in expenditures, according to the United States Census Bureau's survey of school system finances. The district had a yearly average of $1,198,562,619 in outstanding debt. The district retired $66,179,333 of its debt and issued $132,816,238 in new debt each year on average.[15]
Revenue
The table below separates the district's revenue into the three sources identified by the agency: local, state, and federal.
| Revenue by Source | |||||||||||
|---|---|---|---|---|---|---|---|---|---|---|---|
| Fiscal Year |
Local | State | Federal | Revenue Total | |||||||
| Total | % of Revenue | Total | % of Revenue | Total | % of Revenue | ||||||
| Click [show] on the right to display the revenue data for prior years. | |||||||||||
|---|---|---|---|---|---|---|---|---|---|---|---|
| 1993 | $481,884,000 | 45.23% | $517,651,000 | 48.58% | $65,958,000 | 6.19% | $1,065,493,000 | ||||
| 1994 | $527,660,000 | 43.32% | $617,046,000 | 50.66% | $73,252,000 | 6.01% | $1,217,958,000 | ||||
| 1995 | $578,695,000 | 43.92% | $661,136,000 | 50.17% | $77,867,000 | 5.91% | $1,317,698,000 | ||||
| 1996 | $583,551,000 | 43.52% | $681,465,000 | 50.82% | $75,842,000 | 5.66% | $1,340,858,000 | ||||
| 1997 | $617,788,000 | 44.21% | $697,535,000 | 49.91% | $82,155,000 | 5.88% | $1,397,478,000 | ||||
| 1998 | $656,001,000 | 42.26% | $796,726,000 | 51.33% | $99,409,000 | 6.40% | $1,552,136,000 | ||||
| 1999 | $689,766,000 | 42.66% | $823,238,000 | 50.91% | $103,898,000 | 6.43% | $1,616,902,000 | ||||
| 2000 | $715,573,000 | 41.22% | $907,465,000 | 52.27% | $113,016,000 | 6.51% | $1,736,054,000 | ||||
| 2001 | $745,953,000 | 38.02% | $1,085,008,000 | 55.30% | $130,969,000 | 6.68% | $1,961,930,000 | ||||
| 2002 | $816,346,000 | 42.27% | $965,805,000 | 50.01% | $149,181,000 | 7.72% | $1,931,332,000 | ||||
| 2003 | $904,434,000 | 44.92% | $934,043,000 | 46.39% | $174,974,000 | 8.69% | $2,013,451,000 | ||||
| 2004 | $952,258,000 | 42.67% | $1,077,893,000 | 48.30% | $201,622,000 | 9.03% | $2,231,773,000 | ||||
| 2005 | $1,068,609,000 | 46.31% | $1,014,617,000 | 43.97% | $224,165,000 | 9.72% | $2,307,391,000 | ||||
| 2006 | $1,216,057,000 | 48.46% | $1,055,493,000 | 42.06% | $237,826,000 | 9.48% | $2,509,376,000 | ||||
| 2007 | $1,427,900,000 | 52.69% | $1,052,289,000 | 38.83% | $229,713,000 | 8.48% | $2,709,902,000 | ||||
| 2008 | $1,508,627,000 | 52.48% | $1,132,545,000 | 39.40% | $233,523,000 | 8.12% | $2,874,695,000 | ||||
| 2009 | $1,422,003,000 | 56.58% | $838,721,000 | 33.37% | $252,590,000 | 10.05% | $2,513,314,000 | ||||
| 2010 | $1,356,860,000 | 53.26% | $776,219,000 | 30.47% | $414,654,000 | 16.28% | $2,547,733,000 |
| 2011 | $1,148,174,000 | 46.34% | $889,729,000 | 35.91% | $439,868,000 | 17.75% | $2,477,771,000 |
| 2012 | $1,115,611,000 | 50.23% | $835,872,000 | 37.63% | $269,571,000 | 12.14% | $2,221,054,000 |
| 2013 | $1,141,397,000 | 49.57% | $897,604,000 | 38.98% | $263,763,000 | 11.45% | $2,302,764,000 |
| Avg. | $936,911,762 | 46.20% | $869,433,333 | 45.01% | $186,372,190 | 8.79% | $1,992,717,286 |
Expenditures
The table below separates the district's expenditures into five categories identified by the agency:
- Instruction: operation expenditures, state payments on behalf of the district for instruction and benefits, and retirement system transfers
- Support Services: support services, food services, and retirement system transfers for support service staff
- Capital Spending: capital outlay expenditures (i.e., construction, land or facilities purchases, and equipment purchases)
- Debt & Gov. Payments: payments to state and local governments and interest on school system debt
- Other: all other non-K-12 programs, except food services
| Expenditures by Category | |||||||||||
|---|---|---|---|---|---|---|---|---|---|---|---|
| Fiscal Year |
Instruction | Support Services | Capital Spending | Debt & Gov. Payments | Other | Budget Total | |||||
| Total | % of Budget | Total | % of Budget | Total | % of Budget | Total | % of Budget | Total | % of Budget | ||
| Click [show] on the right to display the expenditure data for prior years. | |||||||||||
|---|---|---|---|---|---|---|---|---|---|---|---|
| 1993 | $490,008,000 | 41.89% | $398,967,000 | 34.11% | $202,536,000 | 17.31% | $36,242,000 | 3.10% | $42,008,000 | 3.59% | $1,169,761,000 |
| 1994 | $536,199,000 | 43.26% | $431,580,000 | 34.82% | $194,480,000 | 15.69% | $33,323,000 | 2.69% | $43,943,000 | 3.55% | $1,239,525,000 |
| 1995 | $570,890,000 | 42.76% | $453,208,000 | 33.95% | $227,831,000 | 17.07% | $32,622,000 | 2.44% | $50,509,000 | 3.78% | $1,335,060,000 |
| 1996 | $597,547,000 | 42.81% | $481,314,000 | 34.49% | $232,642,000 | 16.67% | $31,950,000 | 2.29% | $52,216,000 | 3.74% | $1,395,669,000 |
| 1997 | $624,960,000 | 44.23% | $509,923,000 | 36.09% | $196,100,000 | 13.88% | $27,714,000 | 1.96% | $54,267,000 | 3.84% | $1,412,964,000 |
| 1998 | $678,498,000 | 46.13% | $547,405,000 | 37.22% | $151,390,000 | 10.29% | $37,272,000 | 2.53% | $56,265,000 | 3.83% | $1,470,830,000 |
| 1999 | $721,832,000 | 45.02% | $584,305,000 | 36.44% | $198,296,000 | 12.37% | $34,487,000 | 2.15% | $64,371,000 | 4.01% | $1,603,291,000 |
| 2000 | $748,789,000 | 43.89% | $608,551,000 | 35.67% | $254,704,000 | 14.93% | $31,956,000 | 1.87% | $62,037,000 | 3.64% | $1,706,037,000 |
| 2001 | $819,079,000 | 44.53% | $650,875,000 | 35.38% | $276,137,000 | 15.01% | $32,654,000 | 1.78% | $60,710,000 | 3.30% | $1,839,455,000 |
| 2002 | $870,044,000 | 42.91% | $670,138,000 | 33.05% | $381,218,000 | 18.80% | $45,705,000 | 2.25% | $60,651,000 | 2.99% | $2,027,756,000 |
| 2003 | $953,562,000 | 44.23% | $717,997,000 | 33.30% | $375,851,000 | 17.43% | $50,478,000 | 2.34% | $57,969,000 | 2.69% | $2,155,857,000 |
| 2004 | $1,079,039,000 | 46.96% | $760,544,000 | 33.10% | $342,719,000 | 14.91% | $50,309,000 | 2.19% | $65,293,000 | 2.84% | $2,297,904,000 |
| 2005 | $1,198,946,000 | 47.38% | $807,923,000 | 31.93% | $397,301,000 | 15.70% | $61,140,000 | 2.42% | $65,296,000 | 2.58% | $2,530,606,000 |
| 2006 | $1,277,239,000 | 46.72% | $839,126,000 | 30.69% | $484,103,000 | 17.71% | $71,272,000 | 2.61% | $62,245,000 | 2.28% | $2,733,985,000 |
| 2007 | $1,354,918,000 | 46.17% | $910,483,000 | 31.03% | $495,981,000 | 16.90% | $96,925,000 | 3.30% | $76,344,000 | 2.60% | $2,934,651,000 |
| 2008 | $1,415,286,000 | 47.25% | $924,309,000 | 30.86% | $469,517,000 | 15.68% | $107,318,000 | 3.58% | $78,645,000 | 2.63% | $2,995,075,000 |
| 2009 | $1,444,702,000 | 47.65% | $920,370,000 | 30.36% | $488,067,000 | 16.10% | $102,904,000 | 3.39% | $75,557,000 | 2.49% | $3,031,600,000 |
| 2010 | $1,489,123,000 | 52.96% | $890,459,000 | 31.67% | $255,501,000 | 9.09% | $101,651,000 | 3.62% | $75,000,000 | 2.67% | $2,811,734,000 |
| 2011 | $1,430,190,000 | 55.02% | $869,590,000 | 33.46% | $129,878,000 | 5.00% | $98,669,000 | 3.80% | $70,920,000 | 2.73% | $2,599,247,000 |
| 2012 | $1,277,974,000 | 55.13% | $795,369,000 | 34.31% | $80,326,000 | 3.47% | $93,967,000 | 4.05% | $70,325,000 | 3.03% | $2,317,961,000 |
| 2013 | $1,314,953,000 | 55.48% | $797,335,000 | 33.64% | $94,625,000 | 3.99% | $92,341,000 | 3.90% | $71,072,000 | 3.00% | $2,370,326,000 |
| Avg. | $994,941,810 | 46.78% | $693,798,619 | 33.60% | $282,343,000 | 13.71% | $60,519,000 | 2.77% | $62,649,667 | 3.13% | $2,094,252,095 |
Debt
The table below shows the amount of debt retired, issued, and outstanding in the district for each year.
| Debt | |||
|---|---|---|---|
| Fiscal Year |
Retired | Issued | Outstanding |
| Click [show] on the right to display the debt data for prior years. | |||
|---|---|---|---|
| 1993 | $41,830,000 | $8,573,000 | $324,102,000 |
| 1994 | $39,100,000 | $30,032,000 | $549,004,000 |
| 1995 | $36,275,000 | $21,565,000 | $534,548,000 |
| 1996 | $45,045,000 | $20,053,000 | $509,799,000 |
| 1997 | $47,280,000 | $203,865,000 | $674,488,000 |
| 1998 | $73,715,000 | $29,980,000 | $630,563,000 |
| 1999 | $57,090,000 | $19,654,000 | $593,909,000 |
| 2000 | $52,440,000 | $22,943,000 | $541,930,000 |
| 2001 | $62,540,000 | $250,923,000 | $757,593,000 |
| 2002 | $43,914,000 | $215,112,000 | $924,594,000 |
| 2003 | $54,320,000 | $214,642,000 | $1,078,552,000 |
| 2004 | $62,406,000 | $384,244,000 | $1,260,261,000 |
| 2005 | $72,280,000 | $247,207,000 | $1,435,823,000 |
| 2006 | $97,361,000 | $348,920,000 | $1,687,912,000 |
| 2007 | $102,083,000 | $272,625,000 | $1,857,337,000 |
| 2008 | $106,839,000 | $286,161,000 | $2,029,468,000 |
| 2009 | $89,484,000 | $150,935,000 | $2,090,919,000 |
| 2010 | $79,303,000 | $10,062,000 | $2,021,590,000 |
| 2011 | $73,267,000 | $51,645,000 | $1,965,151,000 |
| 2012 | $74,836,000 | $0 | $1,890,315,000 |
| 2013 | $78,358,000 | $0 | $1,811,957,000 |
| Avg. | $66,179,333 | $132,816,238 | $1,198,562,619 |
Teacher salaries
The following salary information was pulled from the district's teacher salary schedule. A salary schedule is a list of expected compensations based on variables such as position, years employed, and education level. It may not reflect actual teacher salaries in the district.
| Year | Minimum | Maximum |
|---|---|---|
| 2023-2024[16] | $48,925 | $51,432 |
| 2020[17] | $48,661 |
Academic performance
Proficiency assessments
Each year, state and local education agencies use tests and other standards to assess student proficiency. Although the data below was published by the U.S. Department of Education, proficiency measurements are established by the states. As a result, proficiency levels are not comparable between different states and year-over-year proficiency levels within a district may not be comparable because states may change their proficiency measurements.[18]
Mathematics
The following table shows the percentage of district students who scored at or above the proficiency level each school year:[19]
| School year | All (%) | Asian/Pacific Islander (%) |
Black (%) | Hispanic (%) | Native American (%) |
Two or More Races (%) |
White (%) |
|---|---|---|---|---|---|---|---|
| 2018-2019 | 60 | 85 | 47 | 63 | 62 | 66 | 75 |
| 2017-2018 | 58 | 84 | 45 | 61 | 61 | 66 | 74 |
| 2016-2017 | 58 | 82 | 44 | 61 | 61 | 65 | 73 |
| 2015-2016 | 55 | 81 | 39 | 58 | 58 | 63 | 71 |
| 2014-2015 | 55 | 79 | 39 | 58 | 58 | N/A | 71 |
| 2013-2014 | 59 | 83 | 44 | 63 | 64 | N/A | 74 |
| 2012-2013 | 59 | 83 | 44 | 63 | 65 | N/A | 74 |
| 2011-2012 | 60 | 83 | 45 | 64 | 61 | N/A | 75 |
| 2010-2011 | 71 | 88 | 57 | 75 | 72 | N/A | 84 |
Reading/language arts
The following table shows the percentage of district students who scored at or above the proficiency level each school year:[19]
| School year | All (%) | Asian/Pacific Islander (%) |
Black (%) | Hispanic (%) | Native American (%) |
Two or More Races (%) |
White (%) |
|---|---|---|---|---|---|---|---|
| 2018-2019 | 58 | 80 | 45 | 60 | 59 | 67 | 73 |
| 2017-2018 | 56 | 79 | 43 | 58 | 60 | 66 | 72 |
| 2016-2017 | 55 | 78 | 41 | 57 | 59 | 66 | 71 |
| 2015-2016 | 53 | 75 | 38 | 56 | 58 | 63 | 69 |
| 2014-2015 | 53 | 75 | 38 | 56 | 56 | N/A | 70 |
| 2013-2014 | 58 | 77 | 43 | 62 | 62 | N/A | 74 |
| 2012-2013 | 57 | 76 | 42 | 61 | 59 | N/A | 73 |
| 2011-2012 | 57 | 76 | 42 | 61 | 59 | N/A | 72 |
| 2010-2011 | 62 | 78 | 48 | 65 | 62 | N/A | 76 |
Graduation rates
The following table shows the graduation rate of district students each school year:[19][20]
| School year | All (%) | Asian/Pacific Islander (%) |
Black (%) | Hispanic (%) | Native American (%) |
Two or More Races (%) |
White (%) |
|---|---|---|---|---|---|---|---|
| 2017-2018 | 84 | 93 | 79 | 86 | 80-84 | 87 | 90 |
| 2016-2017 | 81 | 90 | 75 | 83 | 70-79 | 84 | 87 |
| 2015-2016 | 79 | 91 | 71 | 81 | 80-84 | 86 | 86 |
| 2014-2015 | 77 | 90 | 67 | 80 | 80-84 | 85 | 85 |
| 2013-2014 | 74 | 89 | 64 | 78 | 75-79 | N/A | 83 |
| 2012-2013 | 75 | 88 | 66 | 78 | 70-79 | N/A | 83 |
| 2011-2012 | 76 | 90 | 68 | 78 | 60-69 | N/A | 84 |
| 2010-2011 | 72 | 92 | 61 | 75 | 50-59 | N/A | 81 |
Student enrollment
| Year[21] | Enrollment | Year-to-year change (%) |
|---|---|---|
| 2018-2019 | 270,978 | -0.4 |
| 2017-2018 | 271,956 | 0.0 |
| 2016-2017 | 271,852 | 1.0 |
| 2015-2016 | 269,098 | 1.1 |
| 2014-2015 | 266,265 | 1.4 |
| 2013-2014 | 262,666 | 0.9 |
| 2012-2013 | 260,226 | 0.7 |
| 2011-2012 | 258,478 | 0.8 |
| 2010-2011 | 256,472 | 0.1 |
| 2009-2010 | 256,137 | -0.1 |
| 2008-2009 | 256,351 | -1.0 |
| 2007-2008 | 258,893 | -1.5 |
| 2006-2007 | 262,813 | -3.2 |
| 2005-2006 | 271,630 | -0.6 |
| 2004-2005 | 273,346 | 0.5 |
| 2003-2004 | 271,900 | 1.7 |
| 2002-2003 | 267,366 | 2.0 |
| 2001-2002 | 262,054 | 4.4 |
| 2000-2001 | 251,129 | 4.2 |
| 1999-2000 | 241,094 | 4.3 |
| 1998-1999 | 231,187 | 2.8 |
| 1997-1998 | 224,799 | 2.8 |
| 1996-1997 | 218,608 | 4.9 |
| 1995-1996 | 208,359 | 4.6 |
| 1994-1995 | 199,287 | 5.0 |
| 1993-1994 | 189,857 | 6.6 |
| 1992-1993 | 178,060 | 4.7 |
| 1991-1992 | 170,025 | 5.5 |
| 1990-1991 | 161,101 | 8.3 |
| 1989-1990 | 148,739 | 4.6 |
| 1988-1989 | 142,140 | 3.5 |
| 1987-1988 | 137,366 | 4.3 |
| 1986-1987 | 131,726 | - |
About the district
Broward County Public Schools is located in Broward County, Florida. It is classified as a large suburban school district by the National Center for Education Statistics. The district served 270,978 students during the 2018-2019 school year and comprised 328 schools.[22]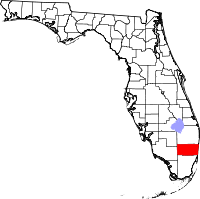
During the 2018-2019 school year, 60.2% of the district's students were eligible for free or reduced-price lunch, 11.7% were English language learners, and 13.7% of students had an Individual Education Plan (IEP).[23]
| Racial Demographics, 2018-2019 | ||
|---|---|---|
| Race | Broward County Public Schools (%) | Florida K-12 students (%) |
| American Indian/Alaska Native | 0.2 | 0.3 |
| Asian or Asian/Pacific Islander | 3.6 | 2.8 |
| Black | 38.8 | 21.9 |
| Hispanic | 34.8 | 33.9 |
| Native Hawaiian/Pacific Islander | 0.2 | 0.2 |
| Two or More Races | 2.7 | 3.6 |
| White | 19.6 | 37.4 |
Note: Percentages for race and ethnicity may add up to more than 100 percent because respondents may report more than one race and the Hispanic/Latino ethnicity may be selected in conjunction with any race. Read more about race and ethnicity in the census here.
Contact information
![]()
Broward County Public Schools
600 SE Third Ave.
Ft. Lauderdale, FL 33301
Phone: 754-321-0000
See also
| Florida | School Board Elections | News and Analysis |
|---|---|---|
 |
 | |
|
|
External links
- Search Google News for this topic
- Broward County Public Schools
- Florida School Boards Association
- Florida Department of Education
Footnotes
- ↑ WPTV, "Peter Licata becomes Broward County Public Schools superintendent," accessed September 6, 2023
- ↑ 2.0 2.1 Miami Herald, "Broward School Board approves interim superintendent’s $275,000 contract," July 28, 2021
- ↑ NBC Miami, "Departure Day: Cartwright Officially Out as Broward Schools Superintendent," accessed September 6, 2023
- ↑ Broward County Public Schools, "Superintendent / Superintendent's Bio," accessed October 26, 2019
- ↑ Local 10, "Broward School Board approves $750,000+ separation agreement for Robert Runcie," May 11, 2021
- ↑ Broward County Public Schools, "School Board of Broward County, Florida," accessed August 2, 2021
- ↑ Office of the Governor, "Executive Order Number 22-202," August 26, 2022
- ↑ 8.0 8.1 Governor of Florida, "Governor Ron DeSantis Suspends Four Broward School Board Members from Office," August 26, 2022
- ↑ Supreme Court of Florida, "FINAL REPORT OF THE TWENTIETH STATEWIDE GRAND JURY," released August 26, 2022
- ↑ POLITICO, "DeSantis suspends 4 Broward school board members after Parkland report," August 27, 2022
- ↑ The Miami Herald, "DeSantis suspends four Broward County School Board members, appoints replacements," August 26, 2022
- ↑ Online Sunshine, "The 2020 Florida Statutes: 1001.35 - Term of office," accessed April 27, 2021
- ↑ Broward County Public Schools, "Speak at a Board Meeting," accessed August 2, 2021
- ↑ Note: This text is quoted verbatim from the original source. Any inconsistencies are attributable to the original source.
- ↑ United States Census Bureau, "Public School System Finances: Historical Data," accessed December 1, 2015
- ↑ Broward County Public Schools, "New Hire Salary Schedule," accessed February 2, 2024
- ↑ Broward County Public Schools, "2020-2021 Grandfathered Teacher Salary Schedule," accessed August 2, 2021
- ↑ U.S. Department of Education, Washington, DC: EDFacts, "State Assessments in Reading/Language Arts and Mathematics- School Year 2018-19 EDFacts Data Documentation," accessed February 25, 2021
- ↑ 19.0 19.1 19.2 To protect student privacy, percentages were reported as ranges for groups of 300 students or fewer. If five (5) or fewer students were included in a data set, the data was replaced by "PS."
- ↑ U.S. Department of Education, Washington, DC: EDFacts, "Four-Year Adjusted-Cohort Graduation Rates - School Year 2017-18 EDFacts Data Documentation," accessed February 25, 2021
- ↑ National Center for Education Statistics, "ElSi tableGenerator," accessed March 8, 2021
- ↑ National Center for Education Statistics, "Search for Public School Districts," accessed March 8, 2021
- ↑ National Center for Education Statistics, "Public Elementary/Secondary School Universe Survey," accessed March 8, 2021
| |||||
